just now


Liquidity Finder Ltd is incorporated in England and Wales, company number 10610740, registered address 167-169 Great Portland Street, Fifth Floor, London W1W 5PF, United Kingdom.
Published: just now

The Nasdaq 100 is trading at 29,382. After reaching a recent high of 29,957, the index reversed sharply and has been recording a series of lower highs and lower lows.
Price is currently trading below all three moving averages MA(5), MA(10), and MA(20), which are aligned in bearish order, with the shorter term averages below the longer term average.
Immediate support lies around 29,356–29,325, followed by the recent low at 29,234. A break below this level could expose the 29,170 area. On the upside, initial resistance lies around 29,450–29,470, followed by 29,568 and 29,680. A recovery above 29,568 would suggest that selling pressure is easing, while a sustained move above 29,680 would provide stronger evidence of a trend reversal. Overall, the short-term bias remains bearish, with downside risks prevailing as long as the index trades below the 29,450–29,570 resistance zone.
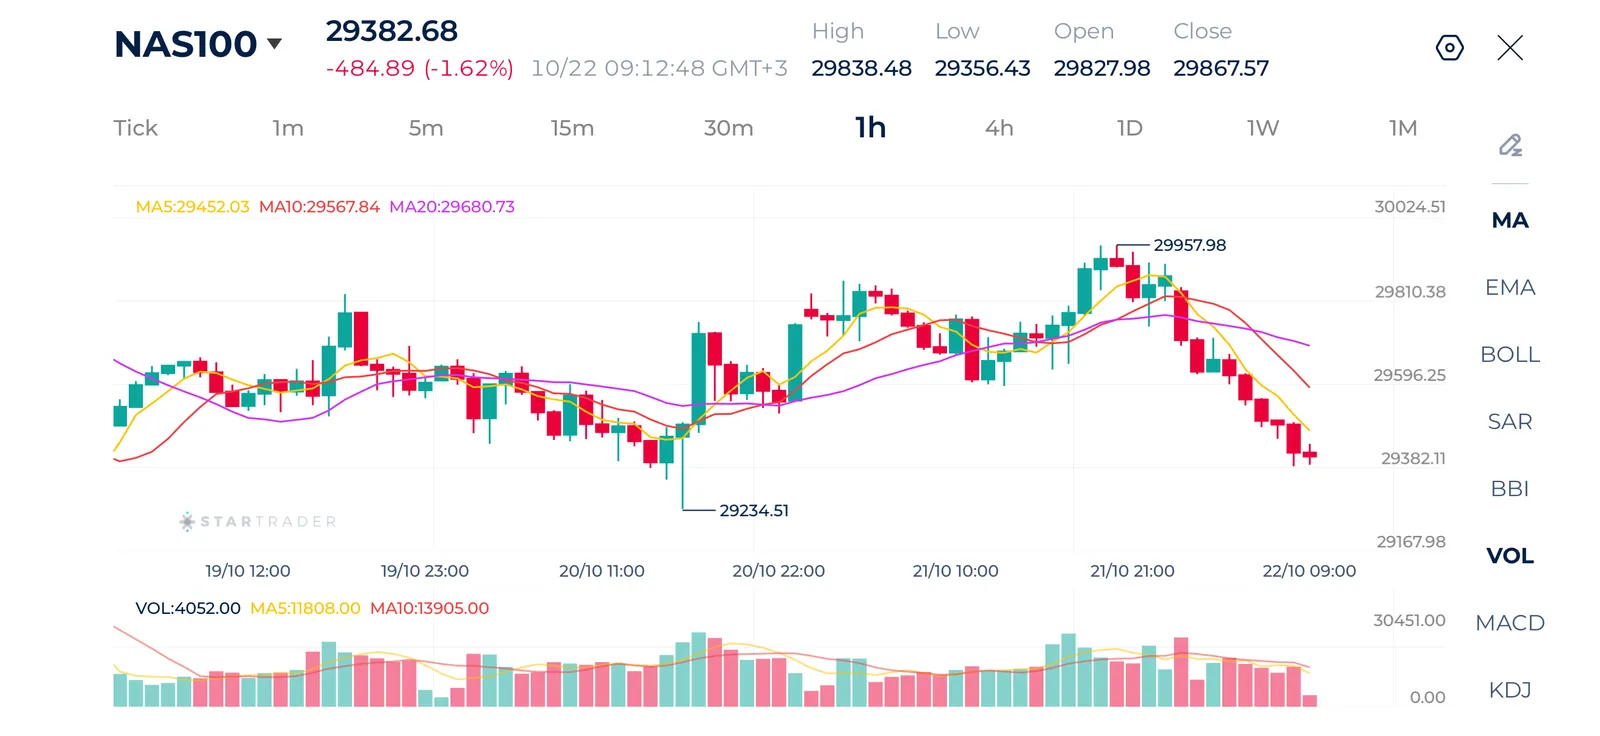
Source: STARTRADER app | Nasdaq reverses downward today after closing higher in yesterday's session
| Resistance | 29,470 | 29,568 | 29,680 |
| Support | 29,325 | 29,234 | 29,170 |
Brent crude is trading at $112.51. Following a sharp reversal from the recent low of $107.39, oil has established a recovery pattern characterized by higher lows and renewed buying momentum. After consolidating around $110–$111 during the previous session, prices have moved higher in the latest candles and are approaching the recent high of $113.41. This suggests that buyers are regaining control and that the market may be preparing to retest its recent peak.
The moving averages support the bullish structure. Price is trading above all three averages MA(5), MA(10), and MA(20). This bullish alignment indicates strengthening short-term momentum.
Immediate support lies around $112.00, followed by $111.60 and $111.00. A pullback toward these moving averages would not necessarily invalidate the bullish structure, provided buyers defend the support zone. On the upside, resistance is located around $112.65, followed by the recent high of $113.41. A decisive break above $113.417 could open the way toward $114.0 and potentially higher levels. Conversely, a move below $111.0 would weaken the bullish outlook and could expose the $110.4 area. Overall, Brent maintains a bullish short-term bias, with a potential continuation toward $113.4 if the current momentum persists.
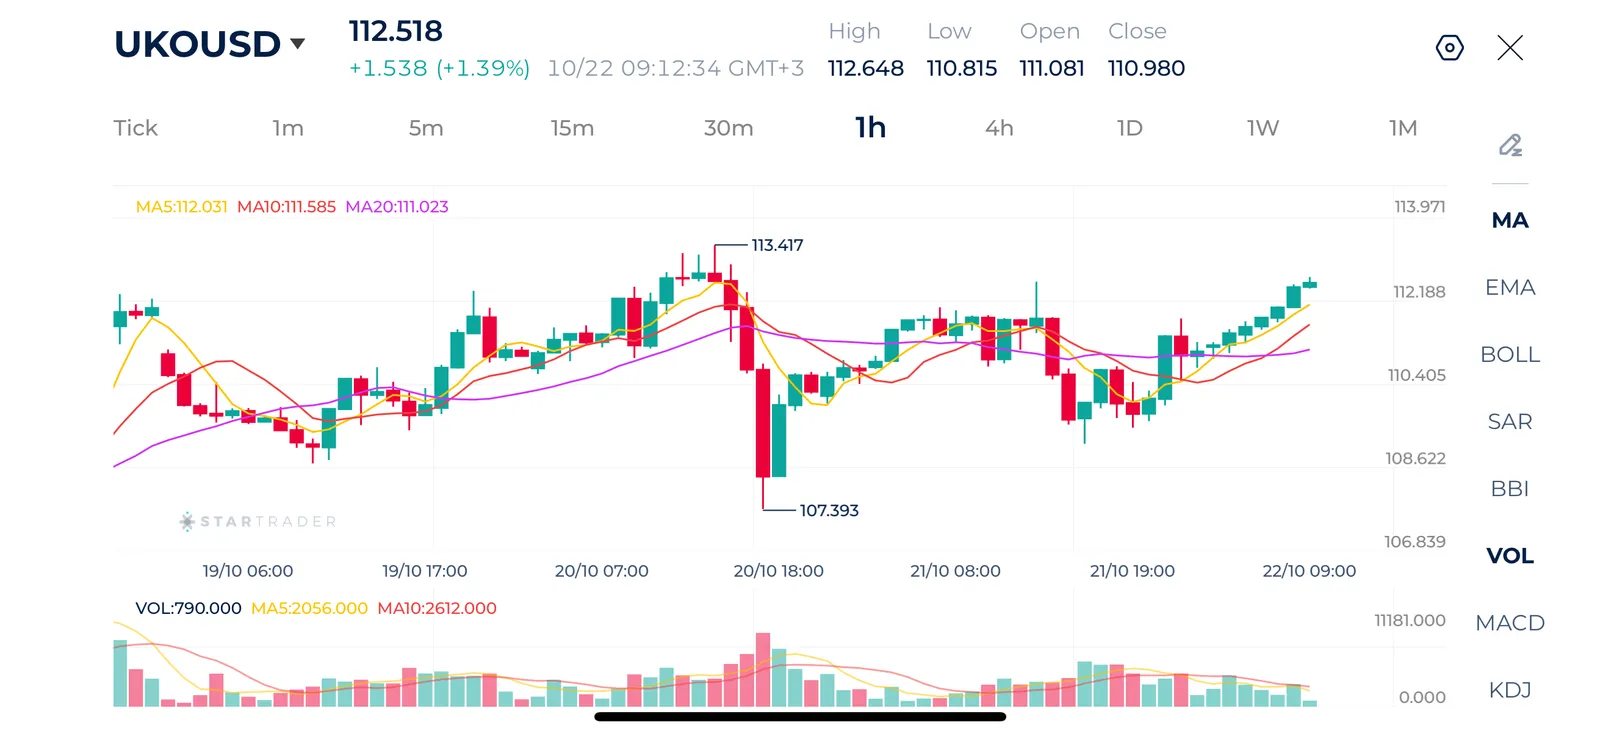
Source: STARTRADER app | Concerns about new strikes in the Middle East push oil prices higher
| Resistance | $113.41 | $114.55 | $115.78 |
| Support | $111.60 | $110.40 | $108.70 |
Gold is trading below $4,100 as it continues to experience significant selling pressure. After consolidating around the $4,120–$4,140 region during the previous sessions, gold broke below this range and dropped sharply toward $4,090. The latest candles show only a limited rebound from the session low of $4,066, indicating that buyers have so far been unable to reverse the downward move.
The moving averages confirm the negative technical structure. Price is currently below all three averages MA(5), MA(10), and MA(20), which are aligned bearishly.
Immediate support lies at the recent low of $4,066, followed by the $4,055 area. A decisive break below $4,066 could extend the decline toward $4,055 and potentially lower levels. On the upside, initial resistance lies around $4,097–$4,111, followed by $4,121–$4,129. A recovery above $4,111 would indicate that selling pressure is easing, while a sustained move above $4,129 would provide stronger evidence of stabilization. Overall, gold remains firmly bearish in the short term, and any rebound is likely to face selling pressure while prices remain below the $4,111–$4,129 resistance zone.
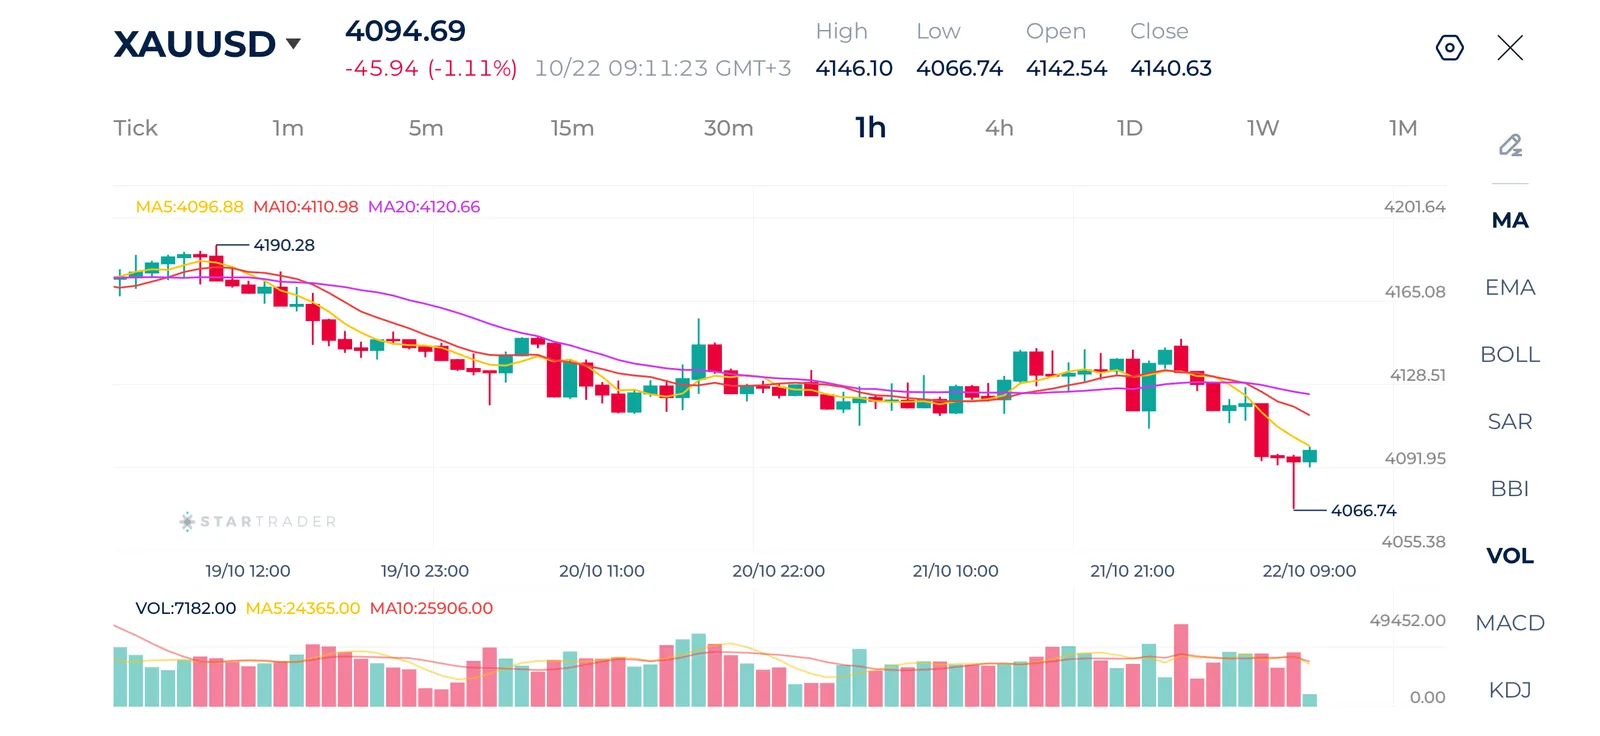
Source: STARTRADER app | Good attempts to rebound after falling below $4,100 psychological support
| Resistance | $4,111 | $4,150 | $4,190 |
| Support | $4,066 | $4,000 | $3,954 |
Risk Disclaimer: This material is provided for informational purposes only and does not constitute a recommendation or investment advice. Trading financial instruments on margin involves substantial risk and may not be appropriate for all investors.
STARTRADER is a global multi-asset broker empowering retail and institutional partners to access global markets through a range of platforms, including MetaTrader, STAR-APP, and STAR-COPY.

Select the categories and companies you wish to follow directly to your person rss feed.
Create Custom RSS FeedSign up and join over 5,000 professional members who receive personalized news alerts, curated professional connections, and more for free!
propfunding.com's free-entry instant funding changes the order of prop funding. Start trading first. Its free-entry instant funding model offers two qualification attempts without an upfront activation fee.
The Nasdaq 100 is trading at 29,382. After reaching a recent high of 29,957, the index reversed sharply and has been recording a series of lower highs and lower lows.
FM Summit London returns to Old Billingsgate on 24 November 2026 for its 15th edition, with a curated one-day format aimed at senior executives. LMAX Group, Plus500, oneZero and MetaQuotes are among confirmed exhibitors, with Business Connect meetings, roundtables and an opening event at The Folly on 23 November.
GCEX has launched European-style, fiat-settled options on Bitcoin and Ethereum with monthly expiries for eligible professional and institutional clients. The service runs through the GCEX OTC desk, with pricing from Tier 1 liquidity providers and reporting on XplorPortal. GC Exchange Limited is authorised by the UK FCA
Wall Street closed mostly higher on Tuesday, led by a nearly 1% gain in the Dow. In Asia, South Korea’s Kospi rebounded 2.7% and Japan’s Nikkei gained 0.8%.
Brent crude is trading at $111.70. The latest price action show the recovery continuing toward $111.70, suggesting that demand has returned after the sharp correction.
FOREX.com has introduced weekend trading for US SP 500 and US Tech 100 CFDs in Japan, operated by StoneX Securities Co., Ltd., a StoneX Group Inc. subsidiary. Investors can manage positions seven days a week, including Saturday and Sunday sessions, without waiting for underlying markets to reopen on Monday.
FINMA has approved Switzerland’s first exchange-traded fund investing directly in Bitcoin, classed as an other alternative investment fund under Swiss law. The regulator cited investor protection and transparency, and warned that Bitcoin investments remain highly risky despite the approval. Others have applied.
Plus500 has conditionally agreed to acquire Guru, a regulated broker-dealer in Brazil, the second largest derivatives market globally. The deal builds on its Nelogica partnership and Colombian presence, and will be funded from existing cash of over $860m as of 30 June 2026. Closing is subject to regulatory approvals.
Market maker and technology provider iSAM Securities has integrated multi-asset liquidity provider Evenox into iSAM Securities Apex.