just now

Liquidity Finder Ltd is incorporated in England and Wales, company number 10610740, registered address 167-169 Great Portland Street, Fifth Floor, London W1W 5PF, United Kingdom.
Published: just now


Retail sales serve as an important evaluation for economic status. Since household consumption drives approximately two-thirds of a nation's GDP, these figures provide investors with a definitive signal on whether the economy is expanding or contracting.
Retail Sales Indicator tracks monthly receipts from supermarkets, e-commerce platforms, and dealerships.
Headline Retail Sales measure the raw percentage change in total consumer spending from the prior month.
Core Retail Sales intentionally strip out highly volatile costs like cars and fuel. Removing these large swings provides a deeply stable view of true underlying consumer demand.
Retail Sales Indicator
When the Retail Sales Indicator is released, markets look closely at two main categories to gauge the market. Understanding the difference is crucial. One metric gives a broad overview of spending, while the other completely removes volatile items to show a much deeper, more accurate picture of consumer demand. Both metrics have value.
Its Implications across Financial Markets
A retail sales release often sparks immediate volatility across several financial sectors:
Retail sales data offers transparency into consumer behavior and its following impact on equities. Consistent growth in the retail sector often correlates with expansionary market cycles, where heightened demand bolsters corporate bottom lines and appreciates share value. A downturn in consumer activity frequently precipitates a contractionary phase. As margins are compressed by falling demand, the market begins to price in a looming slowdown. In this ecosystem, consumer liquidity is the primary engine of growth.
Equities (The Growth Driver)
Expansionary Market Why Robust Sales Drive Stocks Higher
Expansionary or Bullish Scenario where strong sales indicate high consumer confidence. When spending increase, corporate earnings usually follow which makes driving share prices higher.
Contractionary or Bearish Scenario where a decrease in spending indicates that consumers are retreating and which may may result to squeezing profit margins and signal a looming economic slowdown.
Fixed Income & Monetary Policy (The Inflation Gauge) The central banks use this data to adjust interest rates.
Foreign Exchange (The Yield Magnet)
When Sales Exceed Forecasts (The Beat)
When Sales Fall Short of Forecasts or the Miss
Conservative approach to the trading
A non-aggressive approach focuses on confirming a trend rather than guessing a direction, prioritizing capital preservation over catching every pip.
The most conservative approach is to remain holding no active trades during the initial release.
The initial volatility spike following a report is often characterized by erratic price swings sharp, contradictory moves in both directions caused by algorithmic high-frequency trading and a hunt for liquidity.
Allow the 15-minute candle to close before making a move. This timeframe allows the market to digest the data, filtering out the initial noise. If the price maintains its position above or below a significant technical level after 15 minutes, the resulting trend is far more credible.
Example below the 15-minute chart of the pair USDCAD
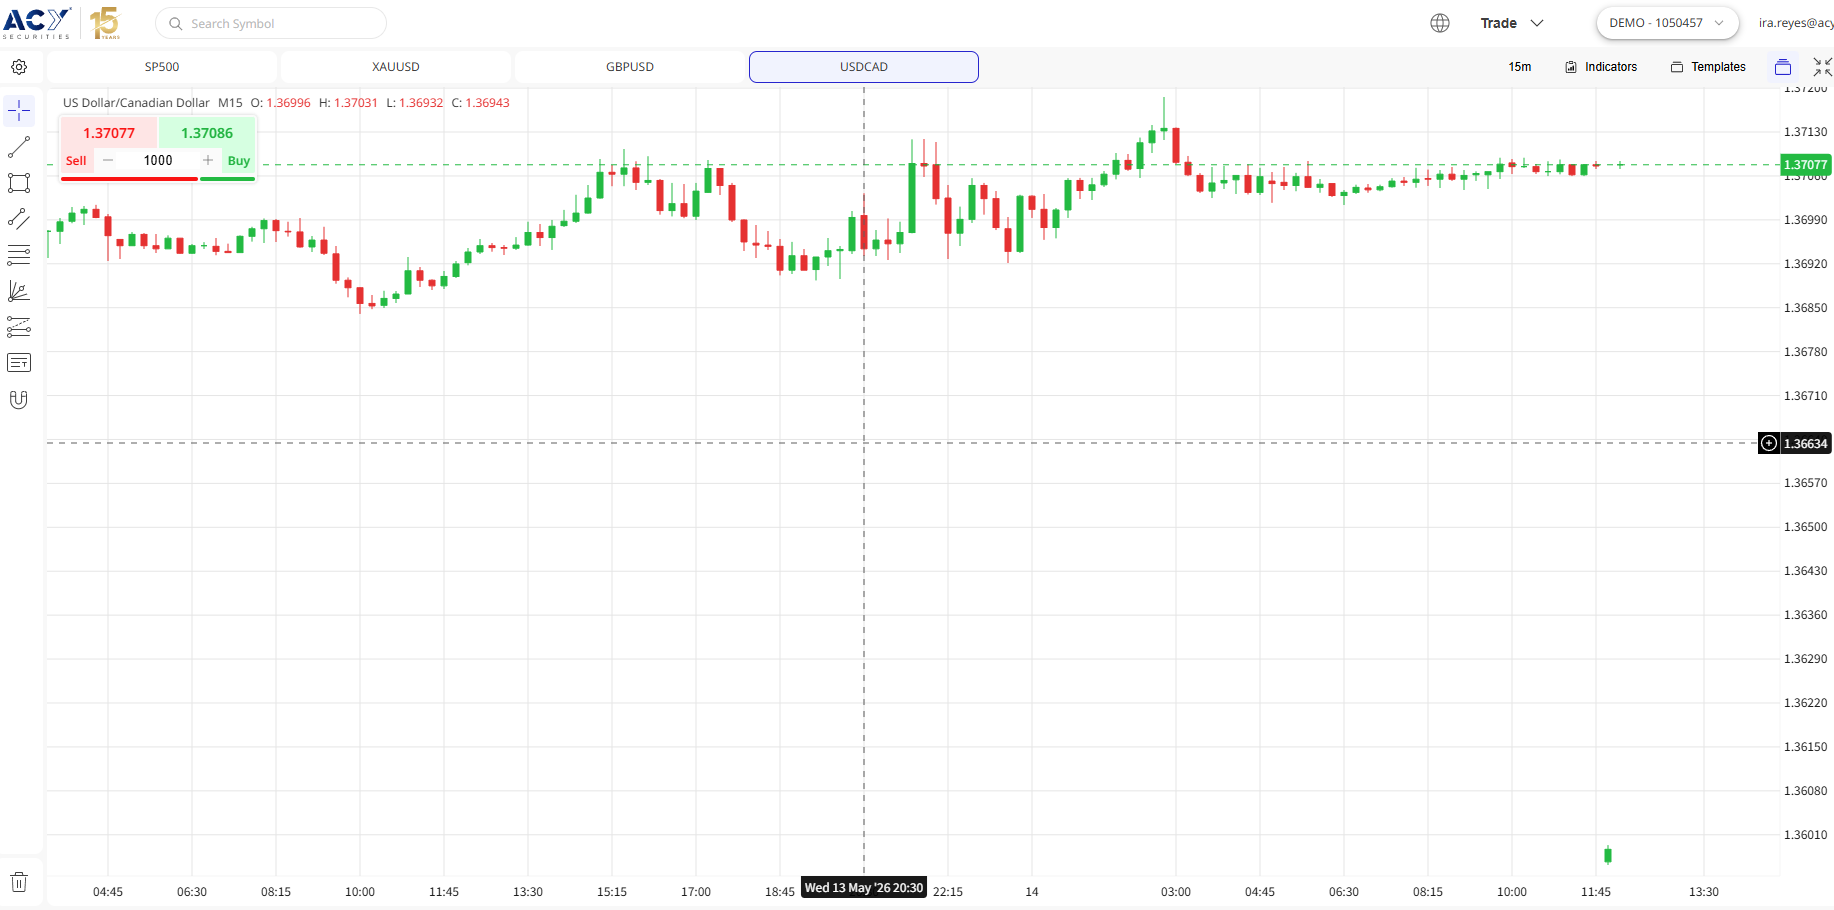
Pre-identify clear Support and Resistance zones on your chart before the data is live.
If the price surges through a Resistance level on positive news, resist the urge to remain bullish. Instead, wait for a corrective dip back to that breached level. If the old Resistance now holds as new Support (evidenced by a bounce), that provides a high-probability entry point. This allows for a much tighter bullish exit trigger.
Rather than trading highly sensitive or erratic assets like Gold or XAU/USD or the British Pound or GBP/USD, look for currency pairs that are already trending.
If the US data is strong just look for pairs like USD/JPY or USD/CAD that are already in a bullish technical structure.
Example below impact of US Retail Sales data on 60-minute chart for pair USDCAD
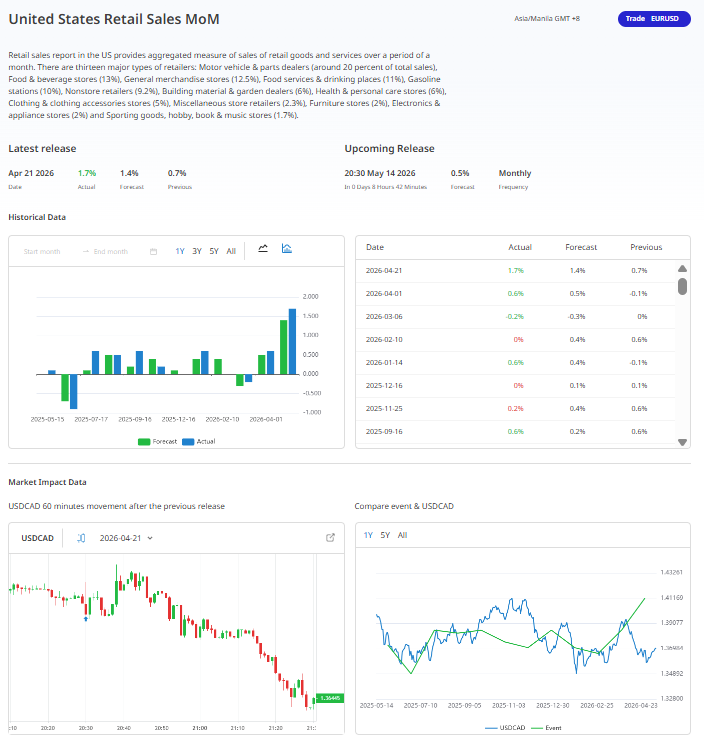
In these cases, the news serves as a fundamental catalyst that accelerates an existing trend. Trading with the prevailing momentum is significantly safer than attempting to catch a reversal in a more volatile market.
During major news events, market liquidity can thin out, meaning a slippage as reducing position size or leveraging down is way to manage this
Compensate for this risk by reducing your standard position size by half. Reduction in leverage ensures that even if the market becomes exceptionally choppy, your account equity—and your emotional discipline remain intact.
Explore my portfolio for further insights:
GBPUSD: Retail Recovery or Energy Trap?
Disclaimer: This content may have been written by a third party. ACY makes no representation or warranty and assumes no liability as to the accuracy or completeness of the information provided, nor any loss arising from any investment based on a recommendation, forecast or other information supplies by any third-party. This content is information only, and does not constitute financial, investment or other advice on which you can rely.
ACY Securities is one of Australia's fastest growing multi-asset online trading providers, offering ultra-low-cost trading, rock-solid execution, technologically superior account management and premium market analysis.
Select the categories and companies you wish to follow directly to your person rss feed.
Create Custom RSS FeedSign up and join over 5,000 professional members who receive personalized news alerts, curated professional connections, and more for free!
Gold Price Action Forecast: Will XAU/USD Drop to $3930? Meta Description: Read our Gold price action forecast to see if XAU/USD will drop to $3930.
BitDelta Securities Financial Services LLC (“BitDelta Securities”) today announced that it has received full regulatory approval from the Capital Market Authority (“CMA”) of the United Arab Emirates under the Category 5 — Arrangement and Advice license framework (License No. 20200000439). The approval follows the firm's receipt of In-Principal Approval earlier this year and represents the successful conclusion of the CMA's full licensing process, including the satisfaction of capital requirements, governance appointments, and operational setup.
Crypto.com has received a $400 million strategic investment from Citadel Securities, valuing the firm at $20 billion. It marks the first institutional funding round in the company's history, aimed at accelerating its expansion into tokenised securities, derivatives and other asset classes.
WTI’s pullback into $79–82 is the first major test of the bullish Elliott Wave count, with buyers targeting a renewed break above $85.

BitDelta Securities has secured a full CMA Category 5 licence in the UAE and opened a regulated office in Business Bay, Dubai. The firm operates as an introducing broker, connecting investors with licensed international brokers across multiple asset classes, with CEO Dr. Demetrios Zamboglou commenting on the milestone.
Index volatility is asleep while single stocks fight it out underneath, credit refuses to confirm the equity rally, and a bare macro calendar hands next week to oil.
Digital assets and FX brokerage GC Exchange FZE (GCEX) has appointed Mohammed A. Mulla as a Board Member of its Dubai-based entity, part of the wider GCEX Group.
Learn what Blockchain-as-a-Service is, how it works, and why businesses are using BaaS to build blockchain applications without managing infrastructure.
CFDs vs stocks compared on leverage, ownership, costs, dividends, taxes, and risk. Learn the differences between stocks and CFDs and discover which suits your investing or trading goals.
Want to master the markets? A winning trading mindset beats a perfect strategy. Learn how emotional discipline helps you conquer fear and avoid heavy losses.