just now


Liquidity Finder Ltd is incorporated in England and Wales, company number 10610740, registered address 167-169 Great Portland Street, Fifth Floor, London W1W 5PF, United Kingdom.
Published: just now

There is a version of this market you can see and a version you cannot, and the gap between them has rarely been wider than it is right now.
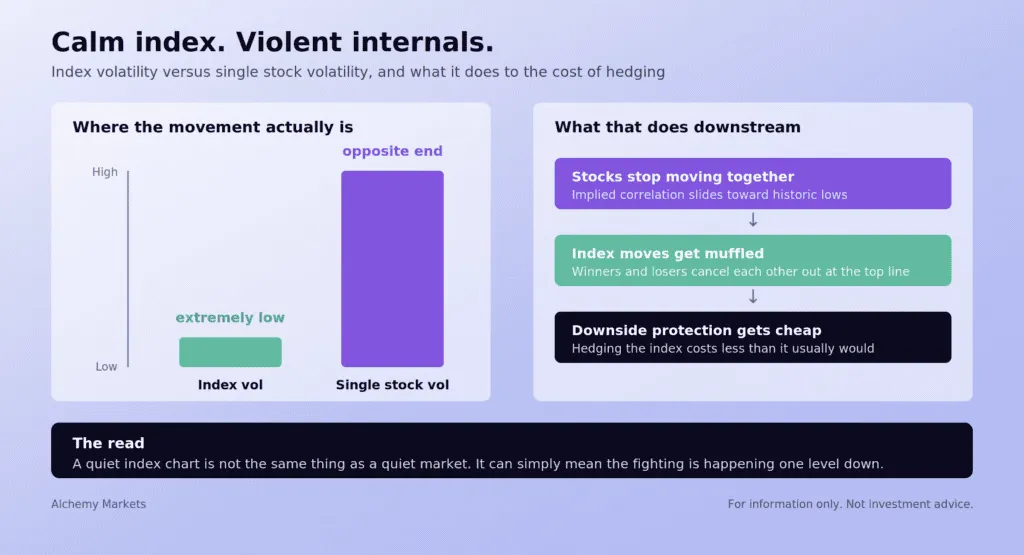
Look at an index chart and you would be forgiven for thinking nothing much is happening. Realised volatility at the top line has been sitting in a range that looks almost sleepy, the kind of tape that makes traders complain about a lack of opportunity. Drop one level down into the single names and the picture inverts completely. Individual stocks have been swinging with a violence that belongs to a very different market environment. Both things are true at once, and the reason they can be true at once is correlation, which has been sliding toward historic lows.
This is what people mean when they describe 2026 as a market of stocks rather than a stock market. When names stop moving together, their gains and losses cancel each other out by the time you get to the index print. The energy is still there. It is just being netted away before it reaches the chart most people are watching. The knock-on effect is that hedging the index has become unusually cheap, which is a curious thing to be able to say in a year that has already contained a Middle East conflict and an energy shock.
I keep coming back to a second divergence that sits alongside this one, because it points in the same direction. Since the Iran conflict began, the S&P 500 has returned close to 10%. Dollar investment grade credit over the same window has managed under 1% on a cumulative excess return basis. That is a nine point gap between two markets that are supposed to be looking at the same set of companies and the same economy.
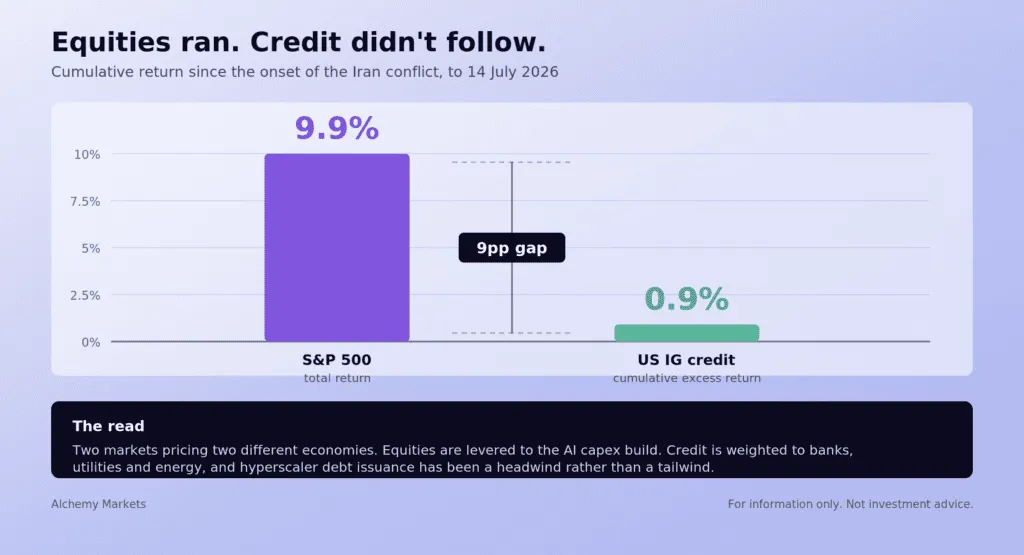
The explanation is not that one of them is wrong. It is that they are no longer measuring the same thing. The equity index has become a levered expression of the AI capex build, weighted toward semiconductors, technology and software, where the addressable market keeps getting revised upward. Investment grade credit is still the old economy in a suit, dominated by banks, utilities and energy, businesses valued for the stability of their cash flow rather than the slope of their growth. Worse, for credit the AI story arrives as a negative, because the hyperscalers are funding that capex by issuing debt in record size, and more supply is not what a bondholder wants to see.
What makes this worth carrying into next week rather than filing away as a curiosity is the behaviour on the way down. Credit has lagged badly on the rallies, but during the equity drawdowns this year it barely flinched. It has been an anchor rather than a participant. So we have an index that looks calm because its internals are cancelling out, protection that is priced as though nothing can go wrong, and a credit market that has quietly declined to validate the equity move. That is a lot of quiet, and quiet is usually a description of positioning rather than a description of risk.
Which brings us to a week where the macro calendar has been stripped almost bare. The Fed is in blackout, the US data slate is thin, and the vacuum will be filled by two things that have nothing to do with economists: oil, and a heavy run of corporate earnings that lands directly on the most dispersed part of the index. If dispersion is going to resolve, this is the week that gives it the excuse.
United States
The Fed has gone into its quiet period ahead of the 29 July FOMC, and it enters it in a very different place than it occupied a fortnight ago. June CPI, PPI and the Beige Book all came in softer on inflation than the market had braced for, and hike pricing collapsed accordingly. What was close to a coin toss before those prints is now roughly a 10% probability. My view is that the disinflation trend holds from here, because the ingredients are all pulling the same way: energy is cheaper, wage growth is weak, housing rents are decelerating and the tariff impulse is fading rather than building. That is not a mix that forces a central bank to act.
The data calendar is thin enough that home sales counts as the headline event, which tells you most of what you need to know. With the Fed silent and the US releases quiet, attention defaults to Middle East headlines, the oil price, and a dense week of corporate earnings that includes several of the big tech names.
Eurozone
ECB rate decision (Thursday). On hold is the base case and comfortably so, but I would not write off a surprise hike entirely. This is the key call of the week.
Flash PMIs (Friday). Last month's survey was collected before the Strait reopening had time to filter through, and this one is likely to have missed the most optimistic reading of that story, because the conflict has flared again and the swift reopening thesis is back in doubt. The likely outcome is a survey that reads cautiously, perhaps marginally better than last month, with the exact timing of when respondents filled it in mattering as much as the underlying economy. That underlying economy still looks set for very muted growth. Nobody should be shopping for miracles here.
United Kingdom
Jobs report (Tuesday). The labour market remains under pressure and the recent payroll numbers have shown little evidence of a turn, with consumer services taking the worst of it. That biases private sector pay growth lower in the near term.
Inflation (Wednesday). Cheaper petrol should nudge headline CPI slightly lower, and services inflation looks set to soften alongside it. July is where the picture changes, as the household energy bill increases feed through, though I still expect the peak to come in below 3.5% this summer.
| DayTime (GMT)CCYEventImpactPreviousForecast | ||||||
| Tue | 06:00 | GBP | Labour Market Report | High | – | – |
| Wed | 06:00 | GBP | CPI y/y | High | – | – |
| Thu | 12:15 | EUR | ECB Rate Decision | High | 2.15% | 2.15% |
| Thu | 12:45 | EUR | ECB Press Conference | High | – | – |
| Fri | 08:00 | EUR | Flash Composite PMI | Med | – | – |
| Fri | 14:00 | USD | Existing Home Sales | Med | – | – |
Alchemy forecast: ECB on hold at 2.15%, consensus 2.15%. Our conviction sits with the hold, but the tail is a hike rather than a cut, which is not how this decision was being framed a month ago.
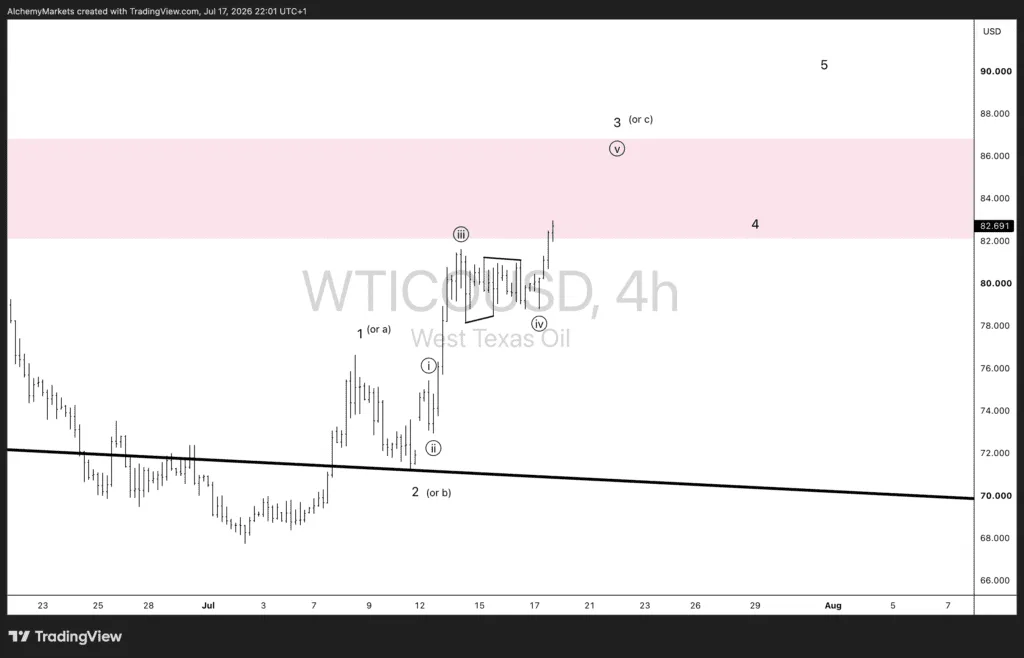
Oil is the asset that gets to write next week's narrative, and its chart is arguably the cleanest thing on my screen right now.
WTI spent the back half of June and the first week of July grinding along beneath a descending trendline that had capped every attempt higher since the spring. That line broke on 7 July, and the move since has developed with a structure worth respecting. What I have marked as wave 1 lifted price off the mid 68s and back through the trendline, wave 2 retraced neatly into that broken resistance and held it as support, which is the textbook confirmation you want after a break of that kind. The advance since has subdivided cleanly. Wave i off the low, a shallow wave ii, an extended wave iii into the low 81s, a wave iv that consolidated sideways in a tidy parallel channel rather than giving much back, and a wave v that is pressing higher as I write with price at 82.66.
That gives me a five wave sequence that looks close to complete at the wave 3 degree. The zone I have shaded between roughly 82 and 86.50 is where I expect this leg to run out of momentum, and the more interesting question is what happens after it does.
Here is where I want to be careful with labelling, because the chart supports two readings. If this is an impulsive advance, then the completion of wave 3 buys us a wave 4 correction into that shaded band, followed by a wave 5 that opens the door to a materially higher target. If instead this is corrective, the same structure resolves as an a-b-c and the move ends where wave 3 would otherwise have paused. The distinction matters enormously for what you do with a pullback, and the chart will tell us which one it is by how the correction behaves rather than by how far it travels.
The fundamental backdrop is doing something unusual to this setup. Normally I would want a story to justify a fifth wave extension in crude, and the story here is already written for us: the conflict has flared again, the Strait reopening timeline is uncertain, and next week's calendar is empty enough that oil headlines will land in a vacuum with nothing to compete against them. That is the opposite of the environment where a completed impulse quietly fades. It is the environment where the fourth wave gets bought.
Which loops back to the top of this piece. If oil pushes into a fifth wave from here, it does not arrive at an index that is priced for it. It arrives at one where correlation is at the floor, protection is cheap and credit has already declined to confirm the equity rally. Energy is a large slice of the investment grade index and a small slice of the S&P. Watch which one reprices first.
Alchemy Markets is a multi-asset brokerage providing retail traders with the same elite trading conditions, tools, and transparency typically reserved for institutions.

Select the categories and companies you wish to follow directly to your person rss feed.
Create Custom RSS FeedSign up and join over 5,000 professional members who receive personalized news alerts, curated professional connections, and more for free!
LSEG has announced a collaboration with NVIDIA that lets financial institutions analyse years of LSEG Tick History data in seconds using NVIDIA cuDF on GPUs, without creating another full copy of the dataset. Tick History holds 110 trillion rows across 100 million instruments and more than 580 venues and contributors.
Standard Chartered has launched a cryptocurrency trading solution letting eligible affluent clients buy and sell Bitcoin and Ether through existing bank accounts. Built with Zodia Markets and regulated by VARA, it launches first for Professional Investor clients in the UAE, with other markets to follow over time.
WTI crude oil breaks above daily resistance after rejecting weekly support. Explore key price levels, breakout confirmation, and the potential 100.305 target.
IG Prime has confirmed Investec Prime Services as a new partner for its institutional white label solution, giving institutional clients in South Africa access to IG’s multi-asset global trading platform under the Investec Prime Services brand. The offering spans equities, indices, FX, commodities and fixed income.
PLUGIT announcing a new YOONIT UX/UI experience coming across all six modules.
The AI conversation in brokerage risk management is mostly led by vendors. Here is what a dealing desk actually needs to know — before signing anything.
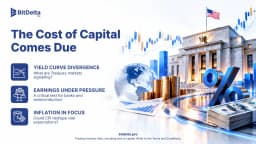
The cost of capital is becoming a defining force in global markets. But are investors pricing in the full impact? With the Fed's policy outlook under scrutiny, major bank and semiconductor earnings approaching, and key inflation data on the horizon, markets face a critical week. In this week's BitDelta Pro Weekly Outlook, we explore the signals shaping market expectations and the factors that could challenge the prevailing narrative.
September's US inflation report could be a defining moment for the Federal Reserve's next interest rate decision. With headline inflation expected to accelerate while core inflation remains steady, the growing divergence raises an important question: Is inflation pressure becoming more widespread, or is energy driving the narrative? Ahead of the October 14 CPI release, BitDelta Pro Research examines the forces shaping inflation expectations, the signals policymakers may prioritise, and what the data could mean for the Fed's next move.
BingX has launched US stock trading through an integration with Alpaca, giving eligible users access to more than 7,000 US stocks and ETFs. Trades can be funded with USDT and USDC, start from $5 and run 24 hours a day, five days a week. A $200,000 Stocks Mystery Box promotion runs from 9 to 23 October 2026.
Bybit has opened stocks trading to eligible users, offering access to more than 1,000 U.S.-listed stocks and ETFs funded in USDC. Orders are executed through Alpaca, with 24/5 trading, fractional shares and zero commission on eligible trades, plus support for dividends and stock splits. Users must complete KYC checks.