just now

Liquidity Finder Ltd is incorporated in England and Wales, company number 10610740, registered address 167-169 Great Portland Street, Fifth Floor, London W1W 5PF, United Kingdom.
Published: just now

The index rallied to 6967 level with impact of better results that cool inflation is on the horizon along with the geopolitical truce extension which made the oil drop to lower prices which can have significant impact lowering energy costs on companies. With tech stocks carrying the weight of the index, strong Q1 financial results with AI investments provided the industries with better corporate profits, dragging the index into bullish channel.

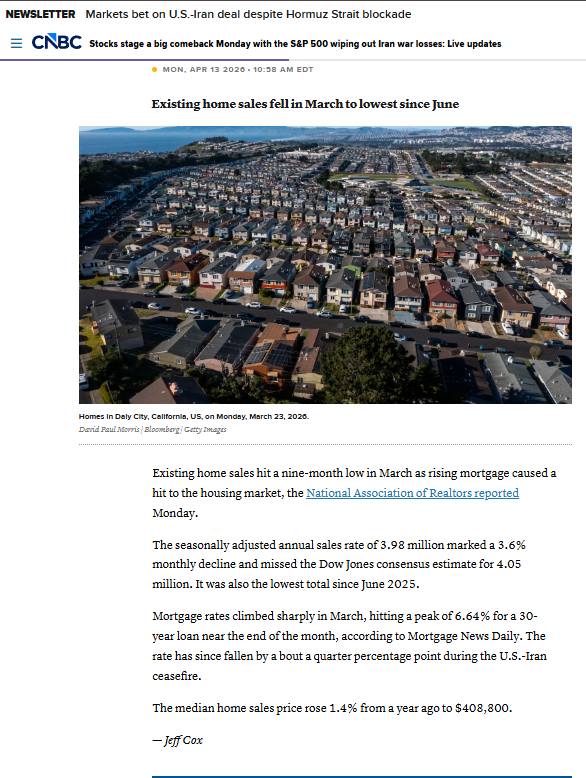
Home Sales Index
Stocks markets react strongly with war updates as a catalyst for sudden movements. It is in between strong stock market and expensive housing market. With geopolitical conflict and market uncertainty, discrepancies can create market confusion.
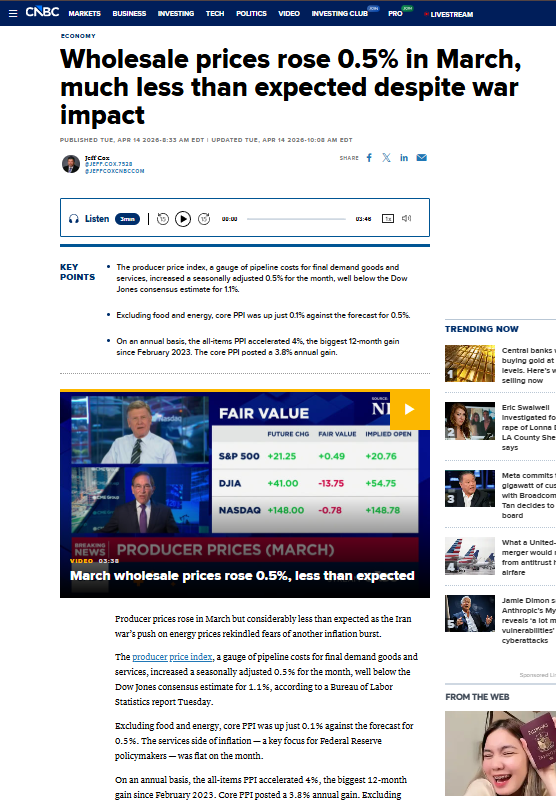
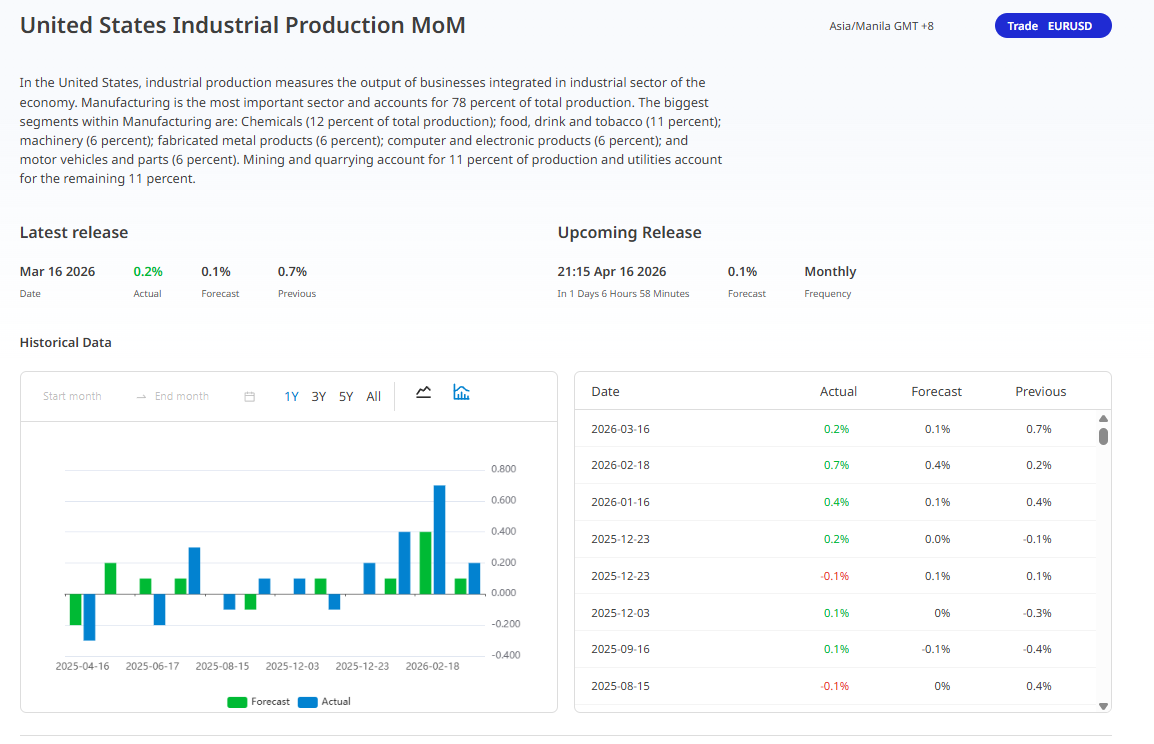
Producers Price Index
With the impact of PPI (Producers Price Index), from a forecast of 1.1% to the release data at 0.5%. This made a positive movement towards the index. Since there is no picture of high inflation and the forecast was below expectation, the index rose with a relief.
| Economic Indicators | Trend | Impact on index | Context |
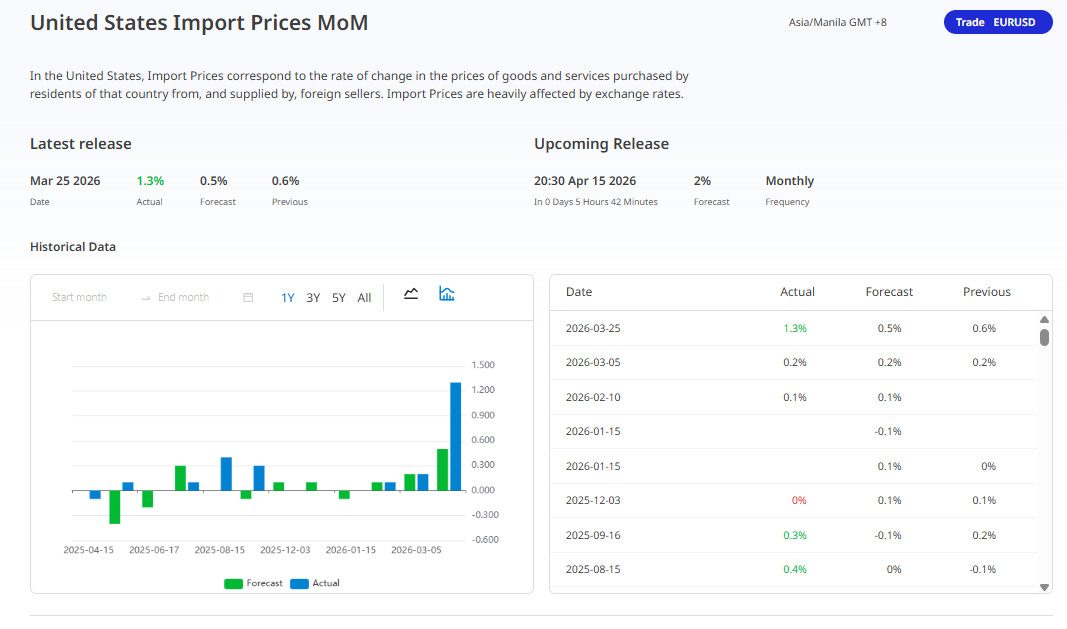
| Import Prices | Increase | Negative | potential higher input costs for US firms and potential hawkish Fed |
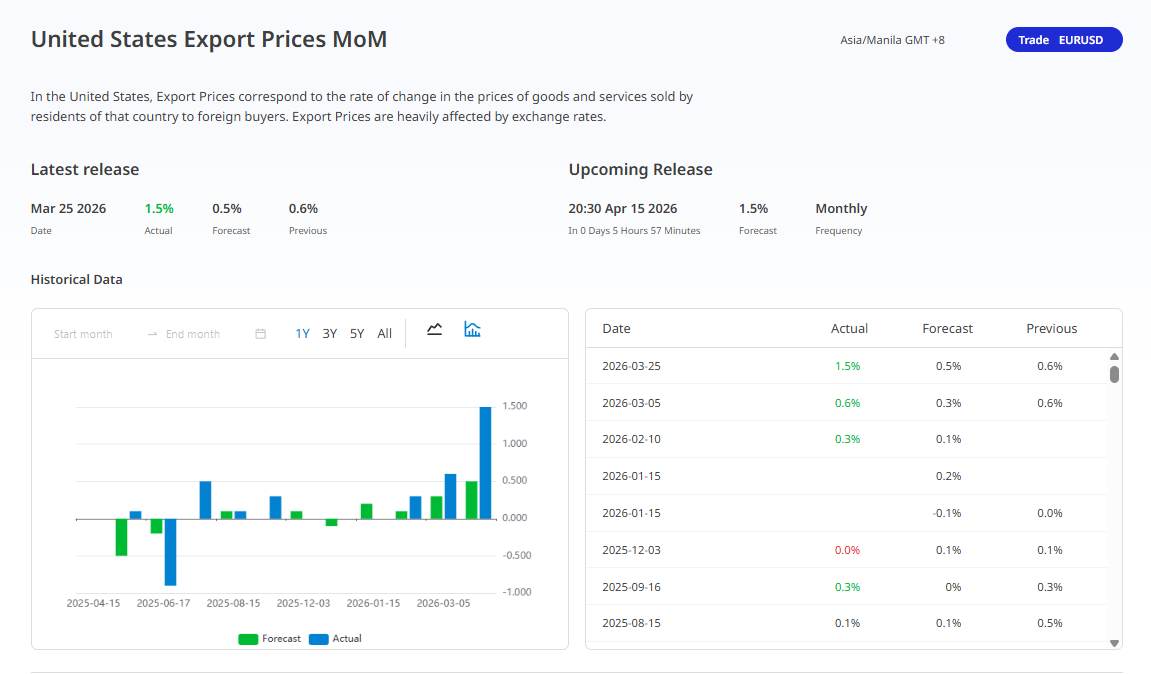
| Export Prices | Increase | Mixed | positive for energy and agricultural industries yet negative for tech or multinationals in terms of competitiveness |
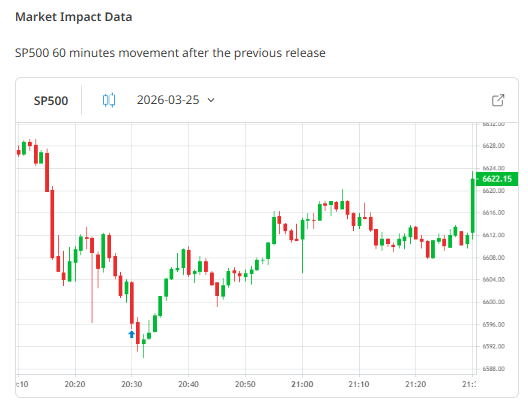
With the under the forecast, if the reported figures fail to meet expectations, historical data shows a 75% probability that the S&P 500 will drop during the first 60 minutes of trading.
With over the forecast results is when the data exceeds expectations, like the March results, the market response is more uncertain, though it leans toward a 55.56% likelihood of a downward move.
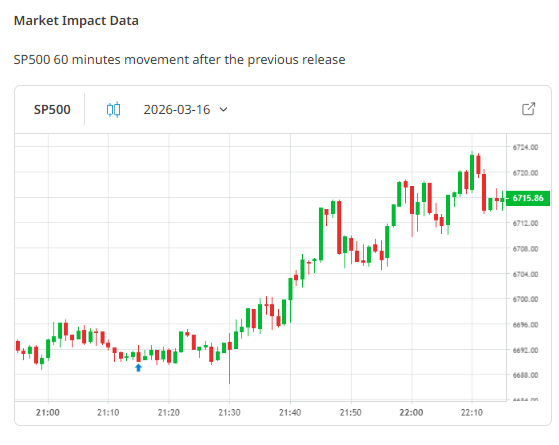
Typical price changes in the hour after the release, range from 0.08% to 0.26%. This means the indicator usually causes market changes and making triggers market volatility.
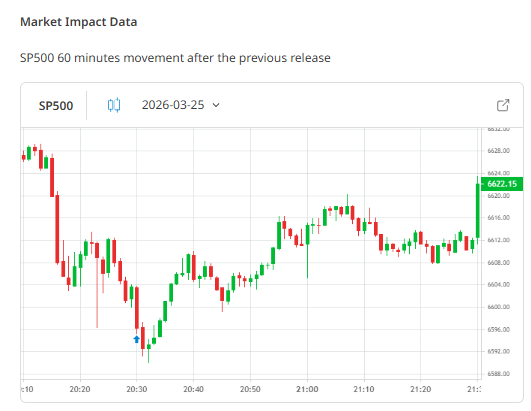
If actual prices are lower than what people expect the S&P 500 has a 75 percent chance of going up in the hour.
Prices being higher than expected makes the S&P 500 likely to go down with a 77.78 percent chance.
The average movement following this release is roughly 0.23%, suggesting that while this data point rarely causes a market crash, it is a very consistent trigger for downward pressure when inflation is high
When the data is weaker than expected, the market is a toss-up, with a 50/50 chance of either a rise or a decline.
When production is stronger than expected the index has a 54.55% probability of rising in the first hour.
The average price movement is 0.24 percent.
This week we can see that trend of the index to reach the 7000 level if indicators provide better results.
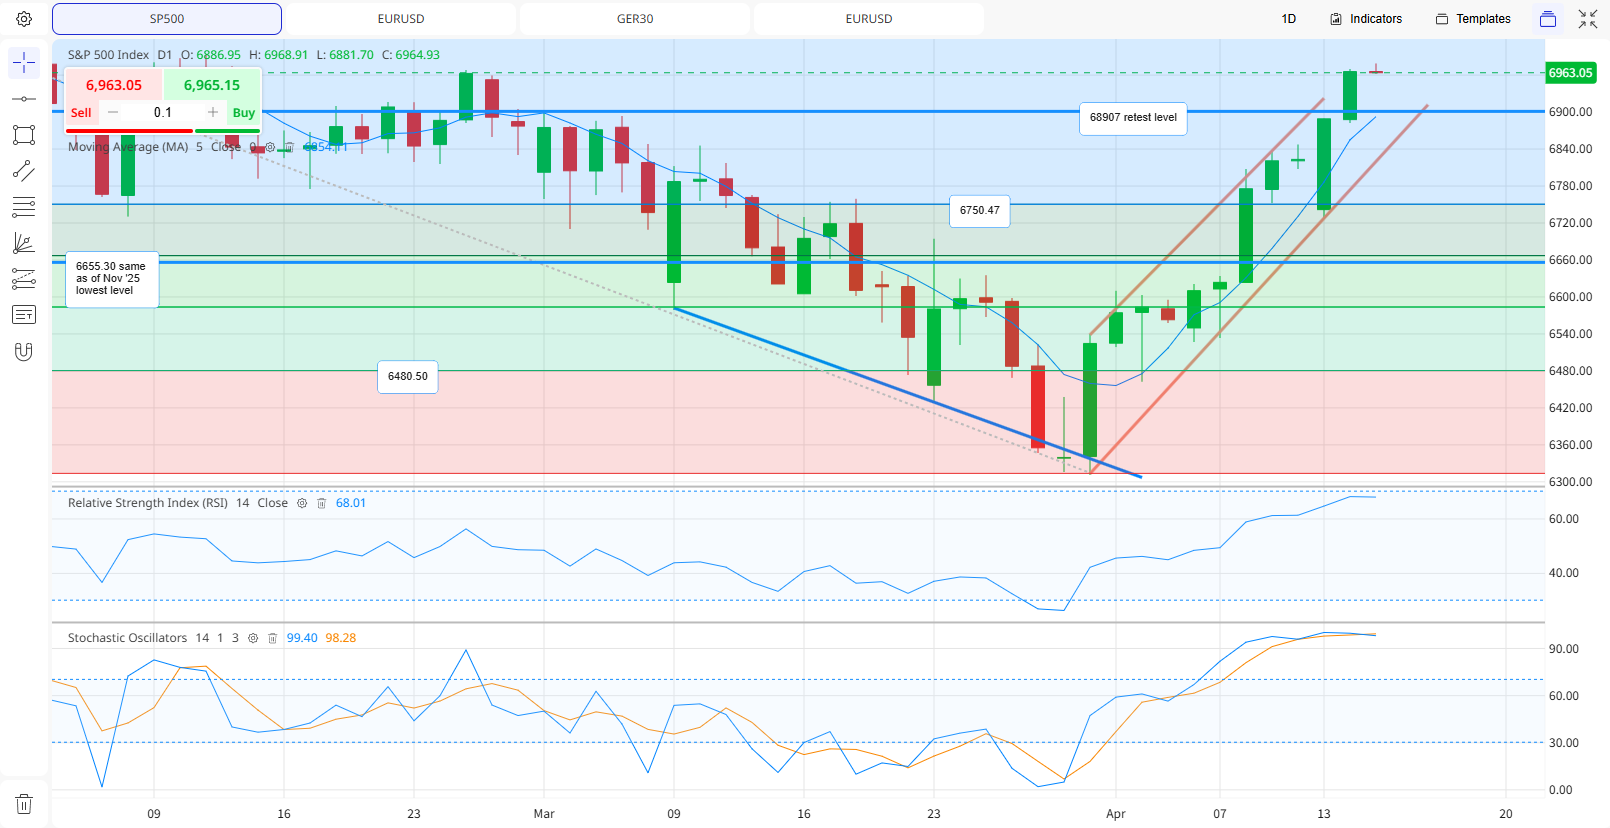
Any sudden surge in oil prices might shift into downward trend putting the corporate profit margins into the spotlight.
Resistance 1 6897 (retest)
Resistance 2 7012.93 all-time high zone if breakout here will materialize, the gateway to bullish market.
Support 1 6750.47 aligns with the 50% Fibonacci retracement of the Q1 26 swing.
Support 2 6655.30 double-bottom (same as November ‘25 lowest level 6655).
Support 3 6480.50 the floor that held correction on October ‘25 lowest level at 6495.
The inflation appears tamed with the index currently has reached an optimal equilibrium where economic cooling is enough to keep the Fed at bay but not so extreme that it signals a recession.
Technically, the index is going through price discovery phase. The rally’s longevity rely on increased market breadth with the 7,000 level is the psychological magnet. Success now depends on tech dominance across broader sector support by much-needed stabilization in the housing market.
Disclaimer: This content may have been written by a third party. ACY makes no representation or warranty and assumes no liability as to the accuracy or completeness of the information provided, nor any loss arising from any investment based on a recommendation, forecast or other information supplies by any third-party. This content is information only, and does not constitute financial, investment or other advice on which you can rely.
ACY Securities is one of Australia's fastest growing multi-asset online trading providers, offering ultra-low-cost trading, rock-solid execution, technologically superior account management and premium market analysis.
Select the categories and companies you wish to follow directly to your person rss feed.
Create Custom RSS FeedSign up and join over 5,000 professional members who receive personalized news alerts, curated professional connections, and more for free!
Sydney-based multi-asset broker ACY Securities has introduced PAXGUSD, a new CFD instrument that allows clients to trade tokenised gold against the US Dollar 24 hours a day, seven days a week. The instrument is available across MetaTrader 4, MetaTrader 5, and the ACY Trading Platform.
Binance has lowered its VIP 3 Wallet Assets threshold from $3 million to $1 million and will now count OTC Spot Trading Volume at a 4x multiplier toward VIP qualification, removing the previous VIP 4 cap and allowing eligible users to progress through the full tier framework up to VIP 9.
Retail futures trading leader NinjaTrader Group has appointed Mark Omens as Senior Vice President, Commercial Strategy, bringing a 25-year veteran of derivatives marketplace CME Group into a newly created role focused on exchange partnerships and enterprise growth.
Gold Price Action Forecast: Will XAU/USD Drop to $3930? Meta Description: Read our Gold price action forecast to see if XAU/USD will drop to $3930.
BitDelta Securities Financial Services LLC (“BitDelta Securities”) today announced that it has received full regulatory approval from the Capital Market Authority (“CMA”) of the United Arab Emirates under the Category 5 — Arrangement and Advice license framework (License No. 20200000439). The approval follows the firm's receipt of In-Principal Approval earlier this year and represents the successful conclusion of the CMA's full licensing process, including the satisfaction of capital requirements, governance appointments, and operational setup.
Crypto.com has received a $400 million strategic investment from Citadel Securities, valuing the firm at $20 billion. It marks the first institutional funding round in the company's history, aimed at accelerating its expansion into tokenised securities, derivatives and other asset classes.
WTI’s pullback into $79–82 is the first major test of the bullish Elliott Wave count, with buyers targeting a renewed break above $85.

BitDelta Securities has secured a full CMA Category 5 licence in the UAE and opened a regulated office in Business Bay, Dubai. The firm operates as an introducing broker, connecting investors with licensed international brokers across multiple asset classes, with CEO Dr. Demetrios Zamboglou commenting on the milestone.
Index volatility is asleep while single stocks fight it out underneath, credit refuses to confirm the equity rally, and a bare macro calendar hands next week to oil.
Digital assets and FX brokerage GC Exchange FZE (GCEX) has appointed Mohammed A. Mulla as a Board Member of its Dubai-based entity, part of the wider GCEX Group.