
just now


Liquidity Finder Ltd is incorporated in England and Wales, company number 10610740, registered address 167-169 Great Portland Street, Fifth Floor, London W1W 5PF, United Kingdom.
Published: just now

Last week, we talked about how USDJPY is at an inflection point. Price was pressing into a known resistance zone, while still holding above the daily 50-EMA band, a level we consistently use to assess trend health.
As long as the lower bound of that band held, USDJPY could remain in an uptrend. However, the higher price pushed into resistance, the greater the risk of a reversal.
Well, by the end of the trading week, it appears the beaver has broken the dam. USDJPY gapped down below the supportive band, dragging DXY down along with it.
On the daily chart, USDJPY has now lost its 50-EMA band; a meaningful shift in short-term structure.
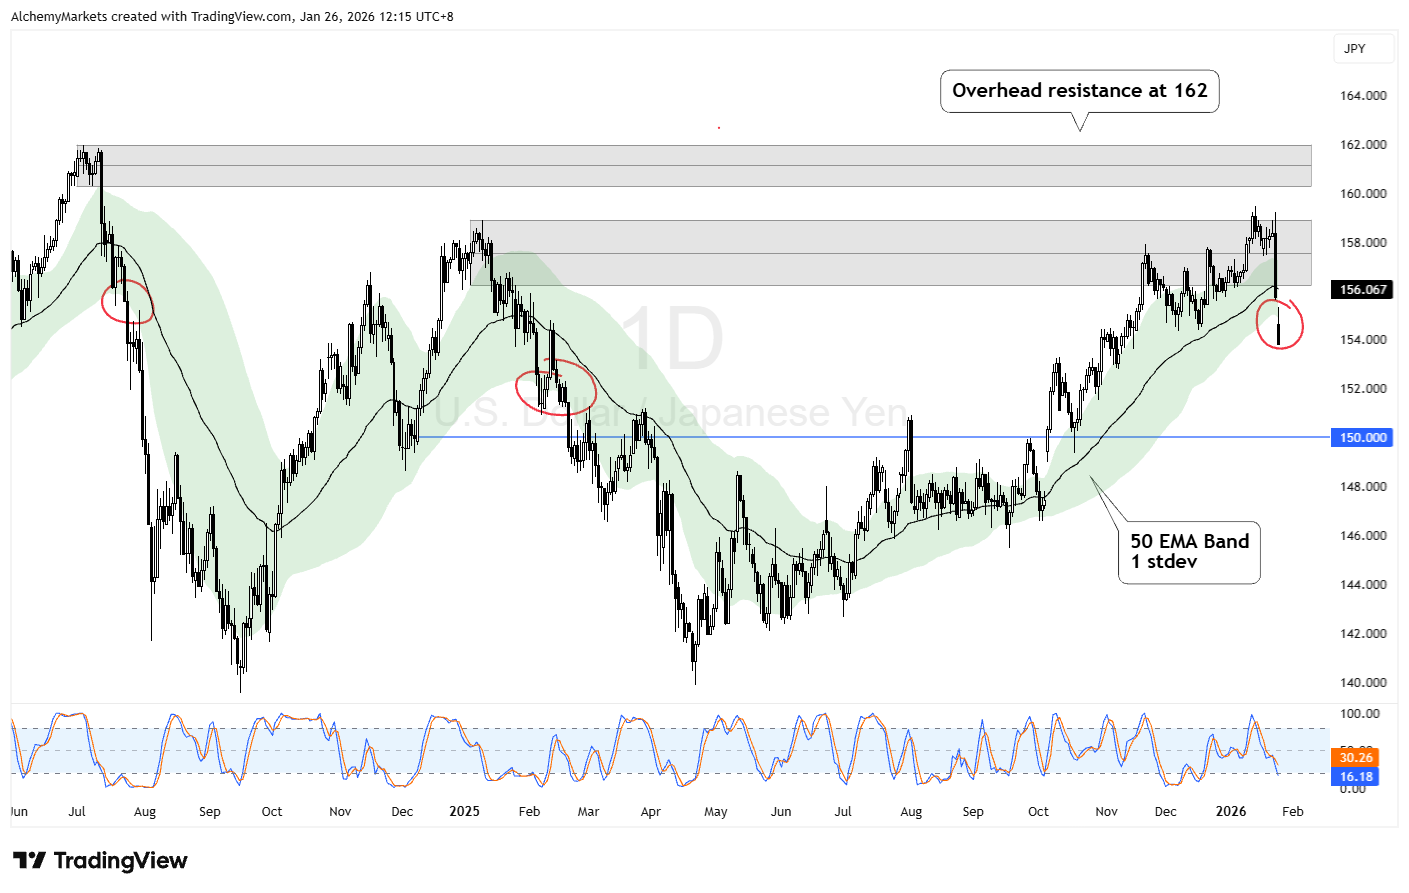
While momentum indicators such as Stochastic RSI are now approaching oversold territory, there has not yet been a confirmed bullish crossover. This places USDJPY in a technically vulnerable position: oversold, but still below trend resistance.
In this context, any rebound should be treated as a retracement, not a trend reversal, unless price can reclaim and hold above the EMA band. USD is showing significant weakness at this juncture.
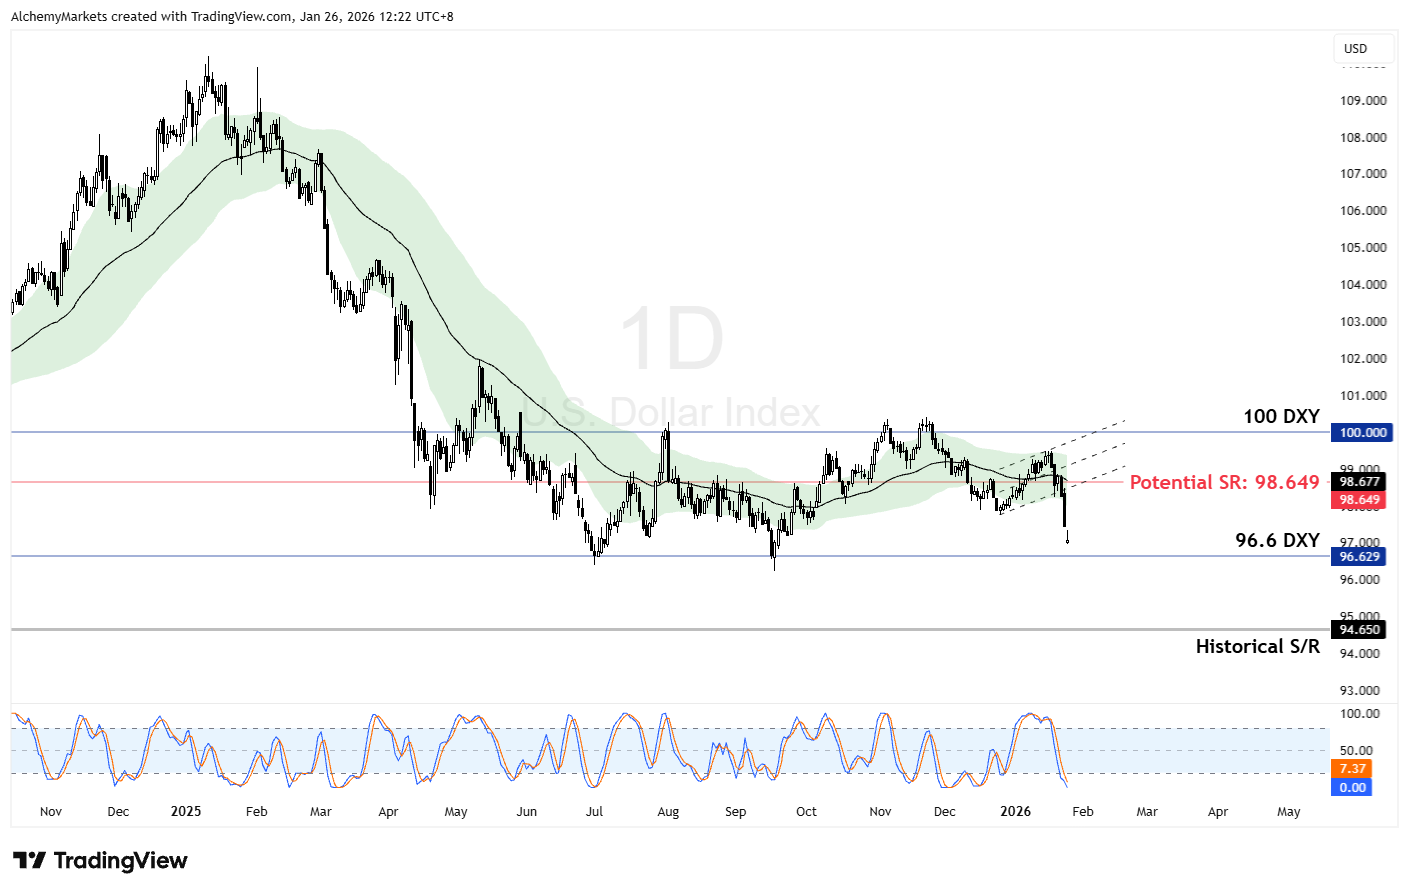
The same structural damage is visible on the DXY.
The dollar index has slipped below its own daily 50-ema band trend support (projected via a Bollinger Bands®) mirroring the USDJPY breakdown. As with USDJPY, momentum conditions suggest the potential for a reflex bounce… but structurally, the dollar remains suppressed as long as it trades below the 50-EMA zone.
This keeps pressure on the dollar in the near term, even if we see short-lived counter-trend rallies.
At its core, a Sell America trade refers to a period where capital rotates away from US assets on a relative basis.
This usually shows up first through US dollar weakness (this is possibly where we are), followed by pressure in US equity leadership, while capital reallocates into commodities, hard assets, or non-US markets.
Importantly, this is not a single event, nor does it imply an outright collapse in US equities. In many past cycles, the process has unfolded in stages, with FX moving first, equities lagging, and leadership gradually shifting rather than breaking outright.
Against that backdrop, recent dollar behaviour and USDJPY’s trend shift naturally raise the question:
Are we seeing the early signals of such a rotation?
While direct confirmation is rarely provided in real time, markets infer action through behaviour. In this case, the price action of USDJPY aligns with prior episodes where Japanese authorities have stepped into FX markets to stabilise the yen (after threatening intervention), primarily via direct currency intervention funded through reserves.
Historically, periods of sustained dollar downside have often coincided with:
That said, a falling dollar does not automatically translate into an immediate sell-off in US equities. In many past episodes, stocks initially held firm, or even advanced, while the dollar weakened, before leadership eventually rotated elsewhere.
The current setup suggests we may be entering the early stages of such a process, rather than a fully developed Sell America regime.
If a broader “Sell America” rotation were to develop, US equity leadership would be one of the first areas to show stress. That makes the Magnificent 7 an important tell.
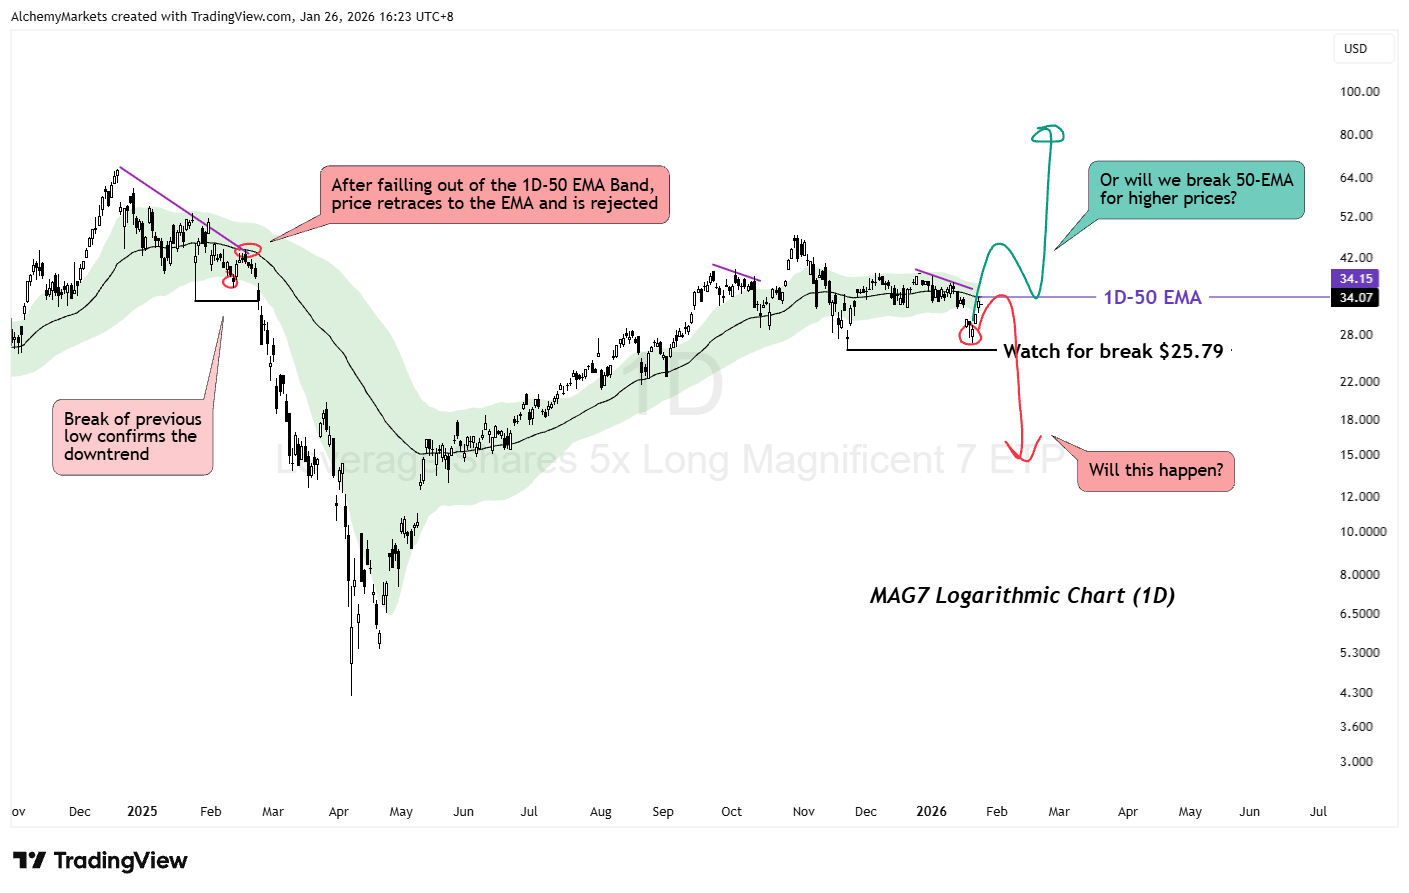
On the daily chart, MAG7 is at its 50-EMA, retesting as potential resistance, as it has previously broken below the 50-EMA band. In 2025, a failure to reclaim this zone marked the transition from consolidation into a deeper corrective phase.
Structurally, the setup is now binary.
On the downside, a clean break below the recent swing low near $25.79 would confirm a loss of short-term trend control and increase the risk of a broader pullback, similar to what followed in 2025.
On the upside, if price can stabilise here and reclaim momentum above the 50-EMA, leadership may yet reassert itself, keeping US equities supported even as the dollar weakens.
As long as leadership holds above key support, dollar weakness alone is unlikely to trigger a full risk-off move. However, a failure here would add weight to the idea that FX-led pressure is beginning to spill into US equity leadership.
Dollar weakness remains the dominant theme while USDJPY and DXY trade below their 50-EMA bands, with rebounds best treated as tactical rather than structural.
For risk assets, MAG7 is the key tell: hold above support and rotation stays contained; lose it, and “Sell America” dynamics gain traction.
DISCLAIMER: For educational purposes only. Trading comes with substantial risk, leading to possible loss of your capital. Traders are advised to do their own due diligence before investing.
You may also be interested in:
Alchemy Markets is a multi-asset brokerage providing retail traders with the same elite trading conditions, tools, and transparency typically reserved for institutions.

Select the categories and companies you wish to follow directly to your person rss feed.
Create Custom RSS FeedSign up and join over 5,000 professional members who receive personalized news alerts, curated professional connections, and more for free!
During Forex Expo Dubai 2026, Adnan Khan, CEO of 4XPORTAL, met with Sam Low, the founder of Liquidity Finder.
ATARIA CRM is a centralized platform designed for fintech teams to manage account operations, verification, fund management, and support in one place. With desktop and mobile access, it helps businesses stay connected, organized, and efficient.
EUR/AUD hits the 1.60500 target after rejecting 1.61715–1.62300 resistance. Review the bearish price action setup and why trade confirmation mattered.
Get an inside look at how rising Treasury yields and sector shifts into healthcare are impacting S&P 500 market dynamics, technical levels, and key economic drivers.
Understand XAUUSD support and resistance with simple gold chart examples. Learn to identify key zones, assess price reactions, and avoid beginner mistakes.
CMC Markets, a FTSE 250 multi-asset financial services firm, has launched a read-only ChatGPT integration for UK CFD clients, giving access to balances, positions, orders, pricing and historical market data through conversational prompts, as part of its ongoing investment in AI and cloud technology.
DXtrade, the multi-asset trading platform from Devexperts, has integrated Notofin's trading performance intelligence solution, adding behaviour-first analysis, structured journaling and pattern recognition tools. Brokers licensing DXtrade can now offer Notofin's services to clients as part of the platform's open integration framework.
KYC is essential for building trust, preventing fraud, and meeting regulatory requirements. A centralized system like ATARIA CRM helps compliance teams manage KYC requests, track pending documents, monitor approvals and rejections, and keep the entire verification process organized. By quickly identifying pending issues, businesses can reduce delays and provide customers with a smoother path from “Pending” to “Approved.”
Build better trading habits with a trading journal. Learn how a trading memory bank helps you review mistakes, manage emotions, and develop confidence.
GBP/USD has fallen to 3-month lows near 1.3200 due to strong US economic data and weakening UK consumer demand, though technical indicators like an RSI of 25.18 suggest the pair is now in oversold territory near key support at 1.3150.