just now


Liquidity Finder Ltd is incorporated in England and Wales, company number 10610740, registered address 167-169 Great Portland Street, Fifth Floor, London W1W 5PF, United Kingdom.
Published: just now


The Bitcoin (BTCUSD) price forecast remains cautiously bullish after price showed rejection at the $78,400–$82,175 weekly and daily support zone, based on the supplied chart observations.
The latest update shows bullish rejection on the weekly chart and strong rejection on the daily chart. A spike in bullish momentum on the 30-minute chart during 10–12 October 2026 adds evidence of buying interest after Bitcoin reached the anticipated support area.
These reactions strengthen the bullish scenario outlined in the previous forecast. The previously identified break above the 50 EMA and inverse head and shoulders pattern remain technical references to monitor.
The next confirmation is sustained bullish follow-through. If buyers continue to defend support and Bitcoin breaks above a nearby daily swing high, $86,550 remains the near-term technical target. $126,235.78 remains a longer-term objective conditional on sustained bullish structure.
A daily close below $80,268.75, followed by a failed retest, would weaken the immediate bullish outlook and bring $75,620 into focus.
This BTCUSD technical analysis examines Bitcoin’s market structure, support reaction, lower-timeframe momentum and the confirmation needed for each scenario.
Can Bitcoin build on its support rejection and move toward $86,550, or will a failed rebound give sellers control?
The forecast combines developing bullish weekly structure with rejection on the daily chart and a momentum reaction on the 30-minute chart.
The weekly chart establishes the broader context. The daily chart shows how price responds at support. The 30-minute chart provides detail on the initial rebound.
| Chart ReferenceObservation From the Supplied AnalysisWhy It Matters | ||
| Weekly market structure | Developing shift from bearish to bullish | Supports the broader bullish outlook |
| Weekly support | Bullish rejection at $78,400–$82,175 | Suggests buyers are defending the anticipated area |
| Daily price action | Strong rejection at the same support zone | Adds evidence of buying interest |
| 30-minute momentum | Bullish spike during 10–12 October after the support retest | Supports the initial rebound |
| 50 EMA | A break above the average was identified in the previous forecast | Provides a trend reference to reassess |
| Inverse head and shoulders | Pattern identified in the previous forecast | Neckline behavior remains relevant to reversal confirmation |
Together, these observations strengthen the BTCUSD bullish outlook. A confirmed trade entry still depends on the chosen timeframe, completed candles and subsequent price behavior.

Current Weekly Timeframe Price Action Analysis. Price Shows Rejections and Weekly and Daily Support Level
The latest weekly observation shows bullish rejection at the support zone identified in the previous Bitcoin price forecast.
This suggests buyers are responding around $78,400–$82,175, supporting the developing shift toward bullish market structure.
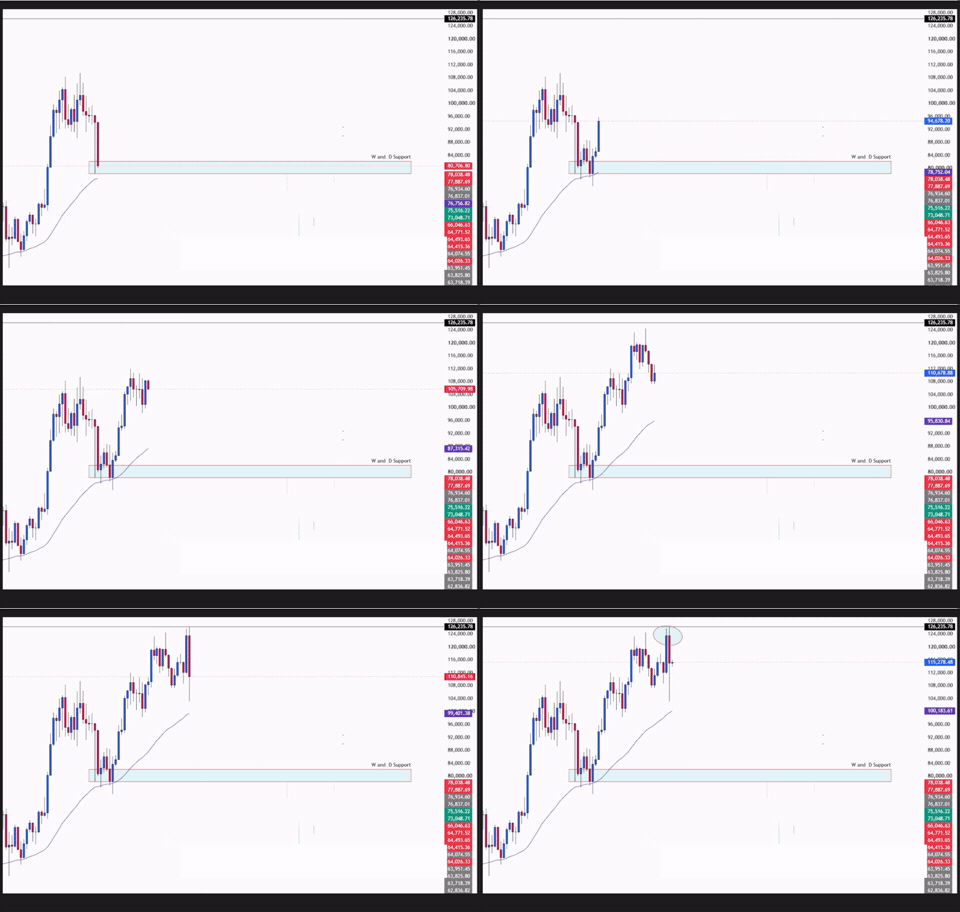
Weekly Chart Price Action: Previous Rally to an All-Time High
The original analysis also highlighted this area as a historical reaction zone, referencing buying interest between 24 February and 25 April 2025. The latest rejection adds a new reaction at the anticipated level.
The next test is whether Bitcoin sustains the rebound. Continued higher highs and higher lows would strengthen the broader bullish interpretation.
Rejection visible on a developing weekly candle should still be assessed against its eventual close and subsequent follow-through.

Weekly Timeframe Price Action Analysis Last Sept. 28 - Oct. 2, 2026
The previous BTCUSD analysis identified an inverse head and shoulders pattern and a break above the 50 EMA.
A neckline breakout is the key reversal confirmation for this pattern. A successful retest can add evidence that the broken neckline is acting as support.
The latest update establishes rejection at the broader support zone. The neckline’s exact location and the current position of the 50 EMA still need to be checked on the chart before treating all three references as overlapping support.
If the neckline and 50 EMA continue to support price, they would add to the bullish case.

Previous Daily Timeframe Price Action Analysis Last Sept. 28 - Oct. 2, 2026
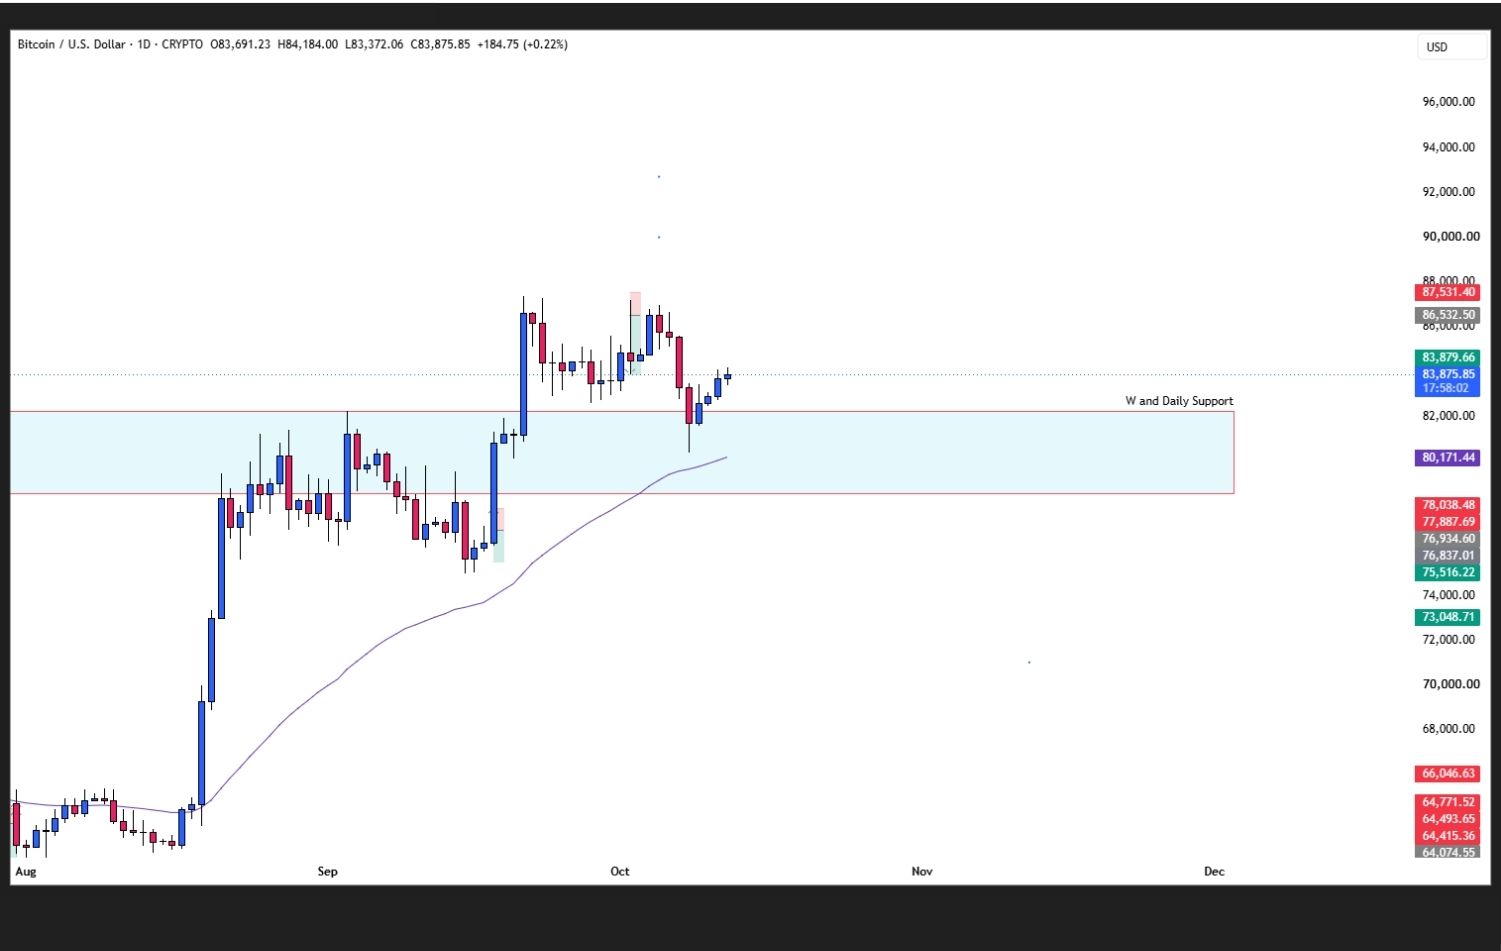
Current Timeframe Price Action Analysis. Price is Retesting Weekly and Daily Support Level
The daily chart also shows strong rejection at $78,400–$82,175, adding support to the weekly reaction.
The previous forecast identified a break above former weekly and daily resistance. Buyers defending the area on a return would support the interpretation that former resistance is becoming support.
The current rejection provides evidence of that defense. Further bullish follow-through and a break above a nearby daily swing high would strengthen continuation confirmation.
The support retest and reaction have developed. The next candles will help determine whether the rebound can extend.
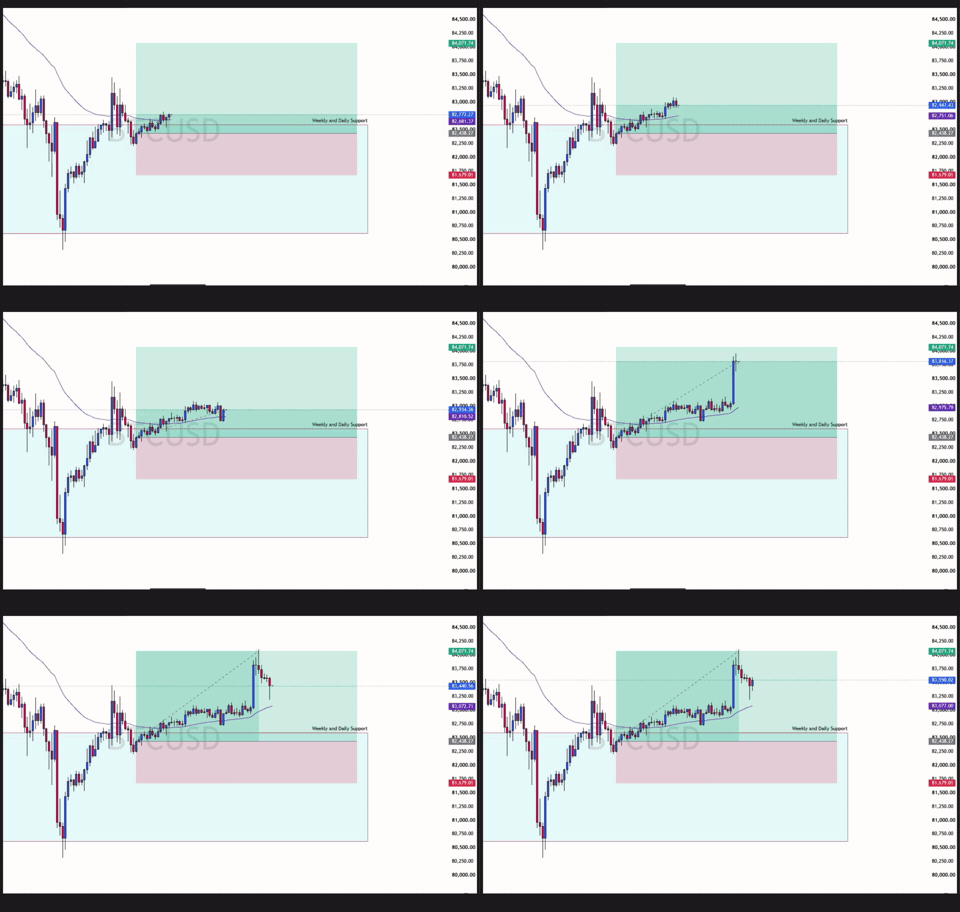
30-Minute Chart Price Action: Bullish Momentum Accelerates After the Support Retest, 10–12 October 2026
During 10–12 October, bullish momentum spiked on the 30-minute chart after Bitcoin reached the anticipated weekly and daily support zone.
This connects the planned support area with an observed upward reaction and reinforces the rejection reported on the higher timeframes.
The next test is whether this momentum develops into sustained daily follow-through. A brief intraday rally alone does not establish a completed higher-timeframe reversal.
The following BTCUSD support and resistance levels define the areas to monitor:
| Technical ReferencePrice Level | |
| Weekly and daily support zone | $78,400–$82,175 |
| Upper boundary of support | $82,175 |
| Early warning of weakness within support | Daily close below $80,268.75 |
| Lower boundary of support | $78,400 |
| Near-term bullish target | $86,550 |
| Longer-term bullish objective | $126,235.78 |
| Potential bearish target | $75,620 |
The targets remain conditional references from the supplied forecast. Their relevance depends on how Bitcoin reacts at support and whether the expected structure develops.
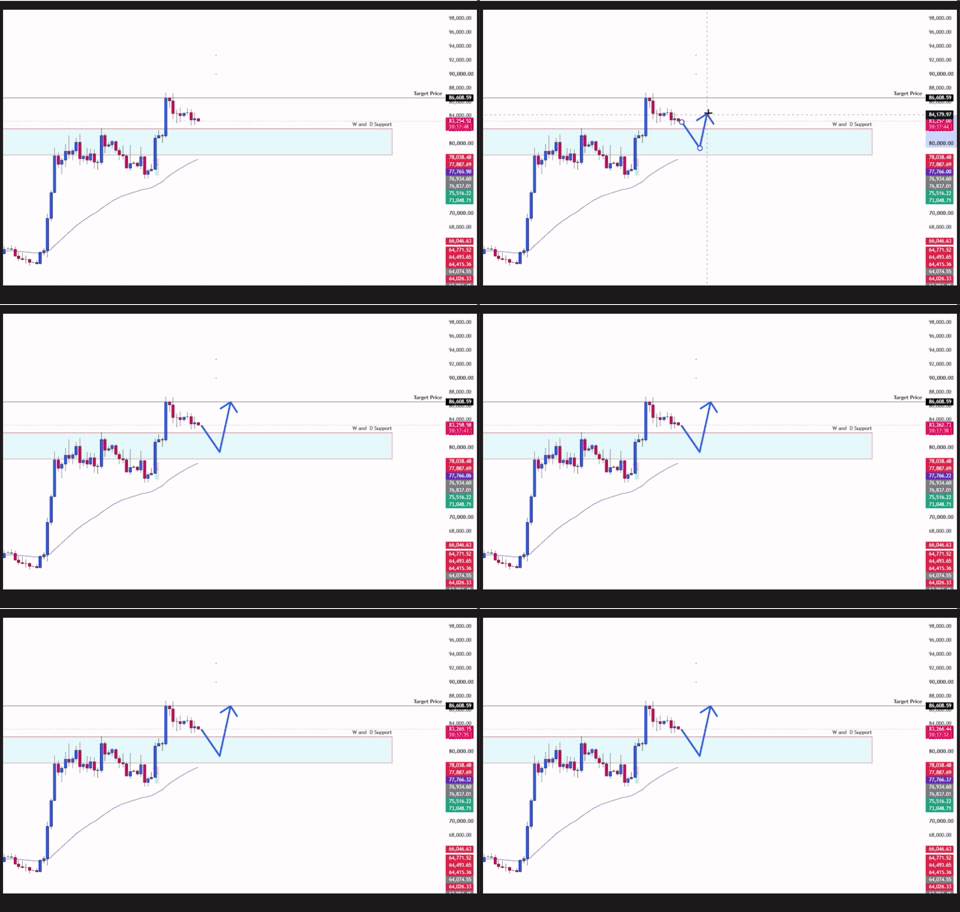
Daily Timeframe Price Action Analysis. Bullish Bias Anticipation
The bullish scenario has gained support from weekly and daily rejection, reinforced by the 30-minute momentum spike.
The remaining confirmation is whether buyers maintain that reaction and push price higher.
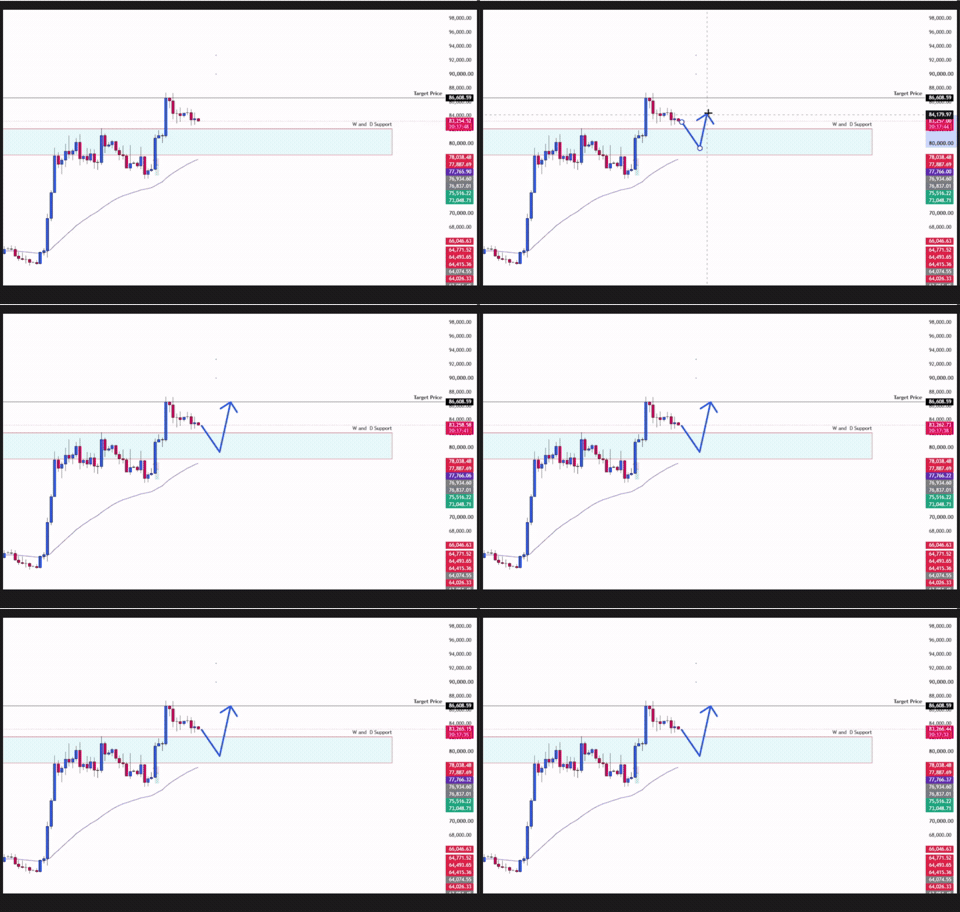
Daily Timeframe Price Action Analysis. Bullish Take Profit and Stop-loss Placement
Under these conditions, $86,550 remains the next upside target.
The initial support reaction is visible. Sustained follow-through would strengthen the continuation setup.
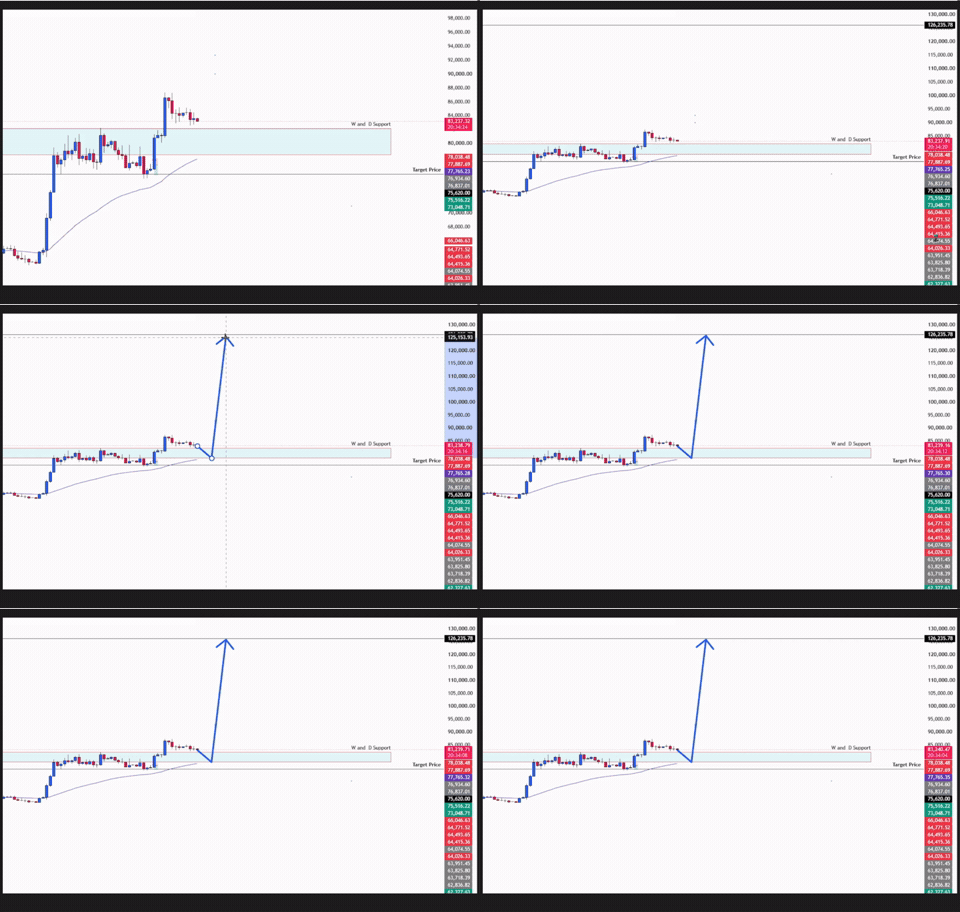
Daily Timeframe Price Action Analysis. Long-term Bullish Bias Anticipation
The longer-term objective depends on Bitcoin maintaining bullish structure beyond the current rebound.
A move toward $86,550, followed by further confirmed breakouts and successful retests, would strengthen the broader outlook.
If higher highs and higher lows continue to develop and key support remains intact, $126,235.78 remains the longer-term technical objective from the original forecast.
The recent support rejection alone does not confirm this outcome.
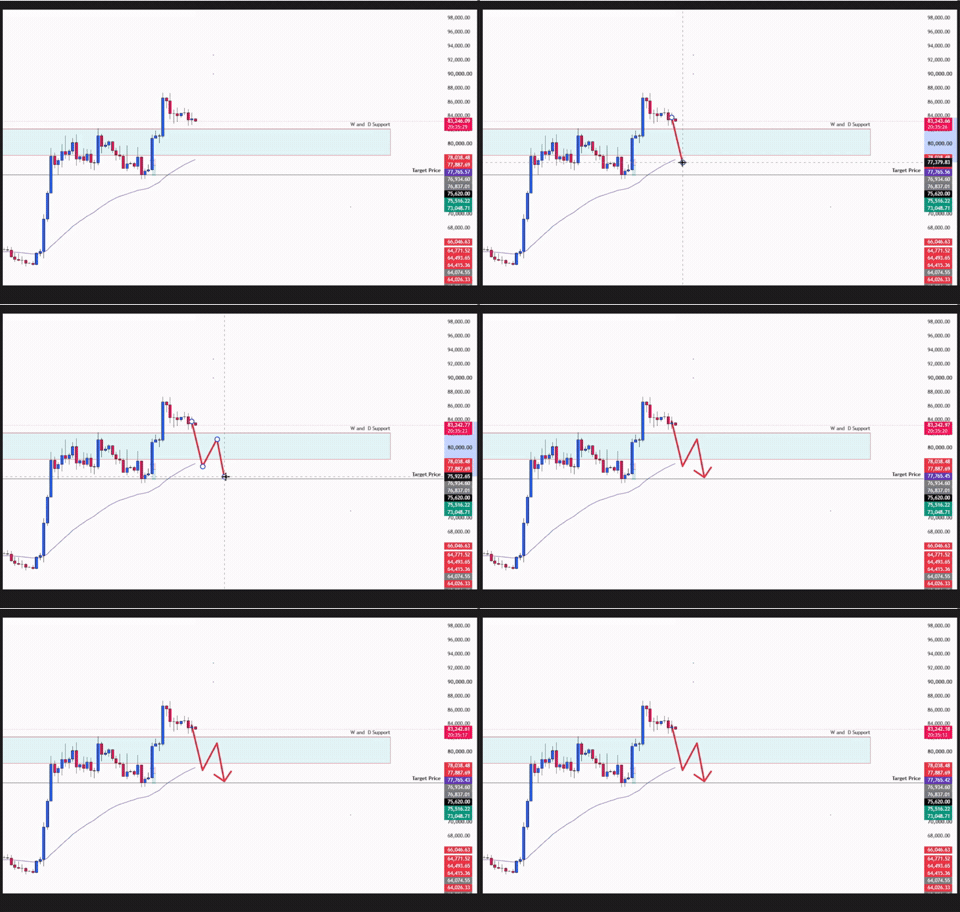
Daily Timeframe Price Action Analysis. Bearish Bias Anticipation
A daily close below $80,268.75 would weaken the immediate bullish rebound. A failed retest from underneath would add evidence that sellers are gaining control.
This threshold sits inside the $78,400–$82,175 support zone. Losing it would signal weakness within support; the lower boundary of the broader zone remains $78,400.
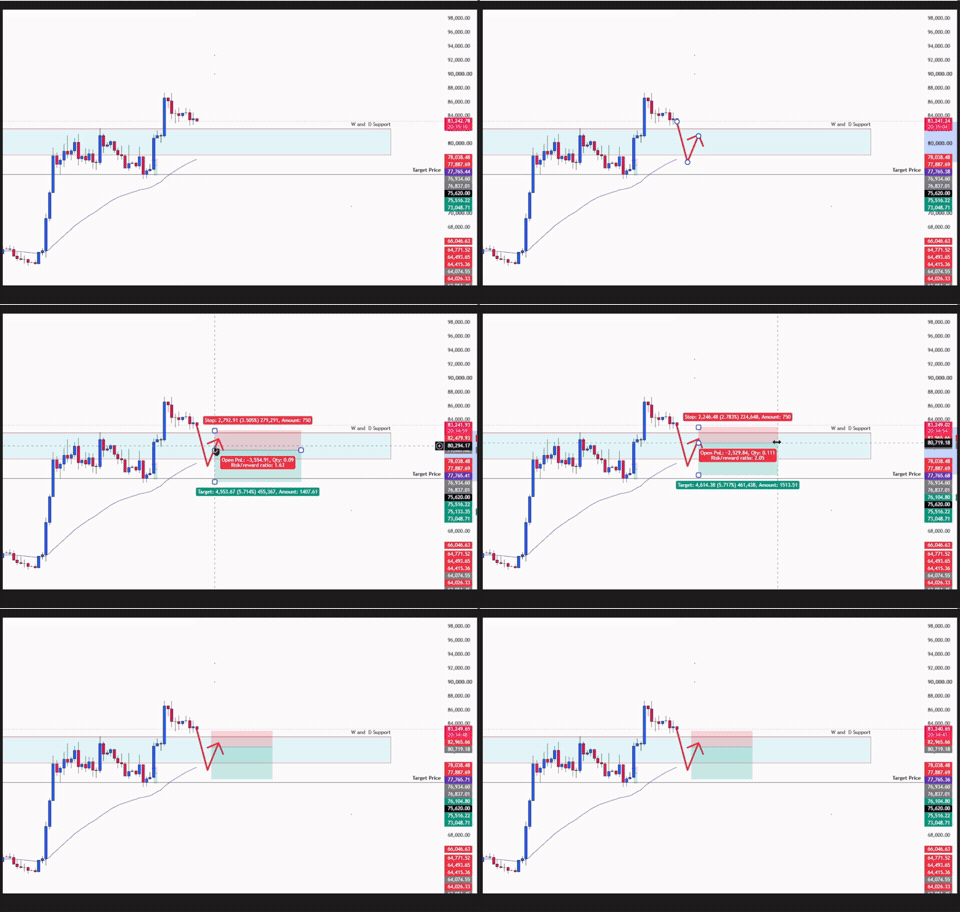
Daily Timeframe Price Action Analysis. Bearish Take Profit and Stop-loss Placement
Under the original bearish scenario, this sequence would bring $75,620 into focus. A decisive close below $78,400, followed by a failed retest, would provide stronger confirmation that the broader support zone has failed.
A temporary move below a level followed by a recovery would weaken the breakdown interpretation.
The BTCUSD price forecast remains cautiously bullish following rejection at $78,400–$82,175 weekly and daily support.
The 12 October update adds weekly and daily rejection, reinforced by a bullish momentum spike on the 30-minute chart during 10–12 October. The next confirmation is sustained bullish follow-through and a break above a nearby daily swing high, supporting the outlook toward $86,550.
Alternatively, a daily close below $80,268.75, followed by a failed retest, would weaken the rebound and bring $75,620 into focus.
The longer-term $126,235.78 objective remains conditional on Bitcoin maintaining bullish market structure.
Before entering, define the price action that would invalidate the setup and assess whether the distance to the target supports the planned risk.
Mark the levels. Watch the follow-through. Let price confirm the setup.
_____________________________________________________________________________________
Move from learning price action to applying it in the real market.
Trade:
Access trading platforms and tools including ACY, MT4, MT5, and Copy Trading.
Create an Account and Start Live Trading
_____________________________________________________________________________________
Build your trading foundation with these step-by-step guides:
Learn to read price action and assess trading setups at key levels:
Learn to recognize bullish, bearish and sideways markets:
Learn to mark key levels and interpret price reactions:
Understand recurring price patterns, retests and false breakouts:
Learn to combine candlestick signals with price action analysis:
Learn to recognize patterns that may signal a change in market direction:
Explore how to combine the exponential moving average with price action:
Bring your technical analysis skills together through a gold swing trading guide:
Learn how risk management and position sizing fit into your trading plan:
Learn how to plan take-profit targets using market structure and risk-reward:
Develop discipline, emotional awareness and a more consistent trading process:
Explore the psychological habits behind a disciplined trading approach:
_____________________________________________________________________________________
Not sure where to begin? Here’s a simple roadmap to guide you:
By building step by step; from basics → real trading → mastering the craft, you’ll gain clarity, confidence, and steady progress without ever feeling overwhelmed.

_____________________________________________________________________________________
Follow Ruffy Grant B. Capacio for Gold analysis, Forex trading ideas, price action education, trading psychology, and market insights: LinkedIn
ACY Securities: Join the Discord Server
Disclaimer:
Trading Forex, Gold, CFDs, cryptocurrencies, commodities, indices, and other leveraged financial instruments involves a high degree of risk and may not be suitable for all investors or traders. Market conditions can change rapidly, and leveraged trading can result in losses that occur quickly.
Before trading, carefully consider your investment objectives, level of experience, and risk tolerance. Only trade with capital you can afford to lose and seek independent financial or professional advice where appropriate.
All market analysis, price forecasts, technical commentary, trading scenarios, educational materials, and opinions presented in this content are provided solely for general informational and educational purposes. They do not constitute financial advice, investment advice, a recommendation, solicitation, or an offer to buy or sell any financial instrument.
Past performance and historical price movements are not reliable indicators of future results. Any price levels, targets, scenarios, or market outlooks discussed should be viewed as analysis rather than guarantees of future market performance. October 12, 2026
ACY Securities is one of Australia's fastest growing multi-asset online trading providers, offering ultra-low-cost trading, rock-solid execution, technologically superior account management and premium market analysis.

Select the categories and companies you wish to follow directly to your person rss feed.
Create Custom RSS FeedSign up and join over 5,000 professional members who receive personalized news alerts, curated professional connections, and more for free!
BTCUSD rejects $78,400–$82,175 support. Watch bullish follow-through toward $86,550 and a daily close below $80,268.75 for weakness.
Gold price forecast: Watch $4,175–$4,190 support for bullish confirmation toward $4,265, or a weekly support breakdown toward $3,935.
WTI crude oil price forecast: A confirmed breakout above $94.765 could open the way toward $100.305, while weekly support remains at $87.360–$90.830.
NAS100 price forecast recap: Explore the Nasdaq 100 rally to 31,401.3, with technical analysis of the breakout and key support and resistance levels.
Learn how to identify, draw and trade XAUUSD supply and demand zones using Gold market structure, price action confirmation and clear risk management.
cTrader has been named Best Trading Platform at UF Awards APAC 2026 during iFX EXPO Asia in Hong Kong.
AUD/CHF reached last week’s 0.57732 bearish target. Learn how resistance, market structure and a neckline retest shaped the original price action forecast.
Businesses eventually reach a point where basic tools are not enough basic tools.
Multi-asset trading broker AvaTrade has agreed to acquire the majority of FXCM Group’s business and brand, in a transaction that would bring a longstanding retail FX franchise into the AvaTrade Group.
LSEG and CMC Markets have signed a multi-year strategic data agreement expanding CMC's access to LSEG's real-time and delayed pricing, reference and corporate actions data, news and analytics, plus AI-ready content, to support new products, entry into new markets and the growth of CMC's institutional and B2B partnerships.