just now


Liquidity Finder Ltd is incorporated in England and Wales, company number 10610740, registered address 167-169 Great Portland Street, Fifth Floor, London W1W 5PF, United Kingdom.
Published: just now


The goal of this lesson is to help traders understand the importance of trend identification in gold trading and learn how to use XAUUSD market structure to determine whether buyers or sellers are in control. By understanding trend direction, traders can improve their technical analysis and identify potential trading opportunities using price action trading.
At the End of This Lesson, You Will Be Able To:
Gold can experience significant price movements during major economic releases, changes in US dollar strength, and shifts in market sentiment. Without understanding the prevailing trend, traders may enter positions against the market's direction or mistake a temporary pullback for a complete reversal.
Many traders focus too much on predicting where gold will reach its highest or lowest price. Instead of guessing reversals, traders can apply a price action trading framework to understand how price moves and whether buyers or sellers are gaining control.
The gold market generally moves in three conditions:
| Market ConditionsXAUUSD Market Structure |
| UptrendHigher highs and higher lows |
| DowntrendLower highs and lower lows |
| Range or ConsolidationPrice moves sideways between support and resistance |
The first step in gold price action analysis is identifying the current market condition. Learning how to master market trends with a price action strategy can help traders understand these conditions across different financial markets.
A simple way to identify the trend in gold is by analyzing its market structure. By observing the relationship between swing highs and swing lows, traders can determine whether gold is trending upward, trending downward, or consolidating.
Understanding the structure of a market trend provides a foundation for identifying these price movements and evaluating potential changes in direction.
A bullish trend develops when gold continues to form:
This pattern suggests that buyers are maintaining control of the market. Each upward move pushes gold to a new high, while pullbacks find buying pressure before breaking the previous significant low.
During a bullish XAUUSD trend, traders may monitor pullbacks toward gold support and resistance levels for potential buying opportunities, provided price action confirms the setup.
Bullish Market Structure
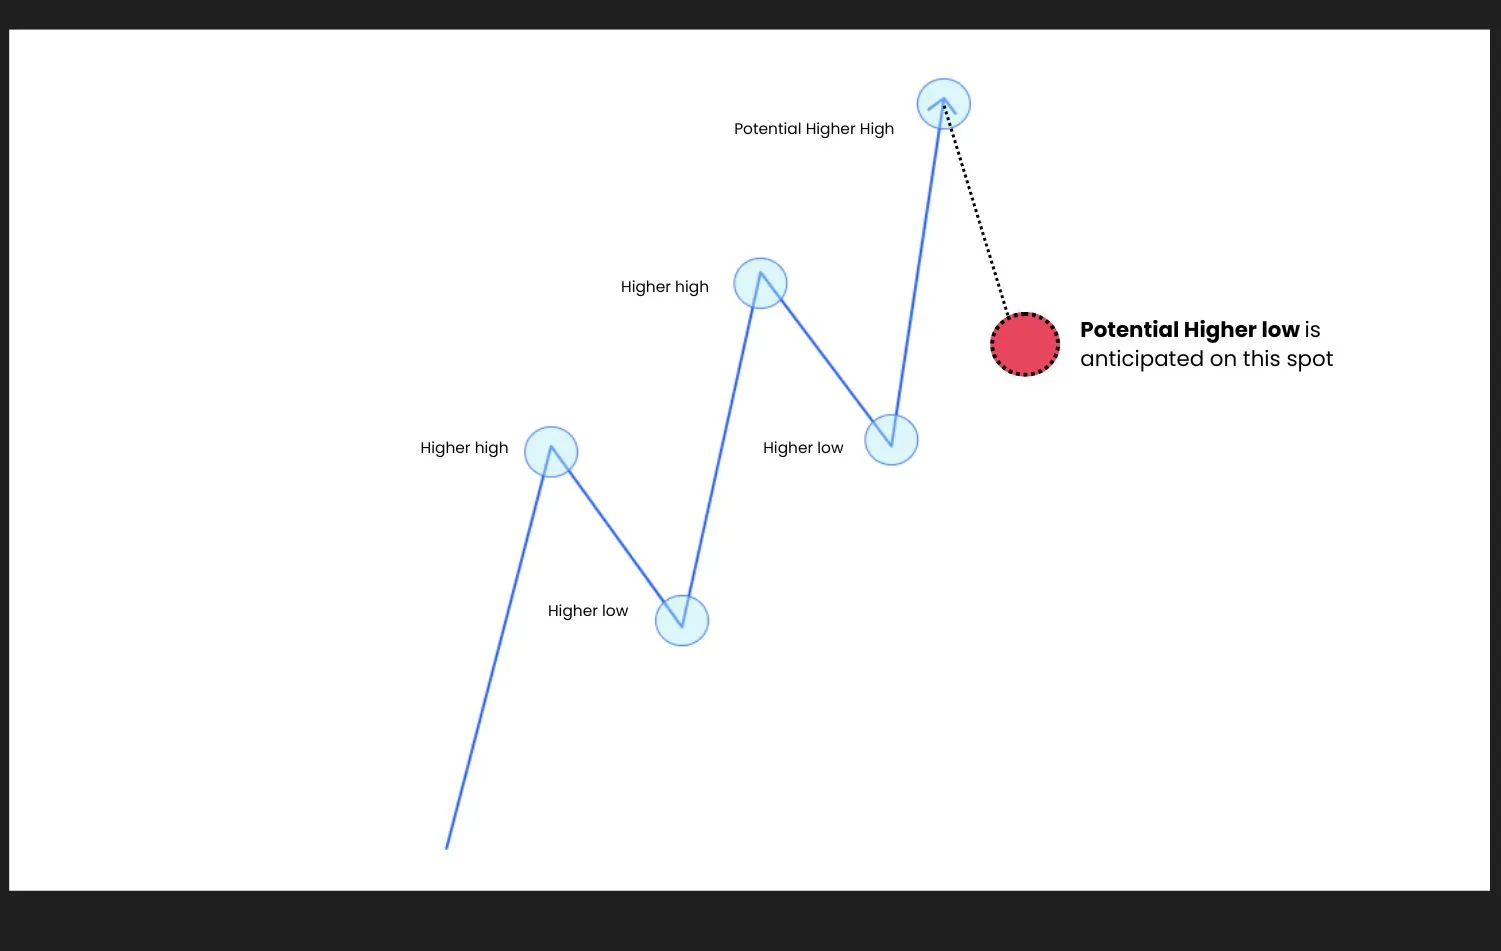
This is how a bullish trend looks on a gold chart:
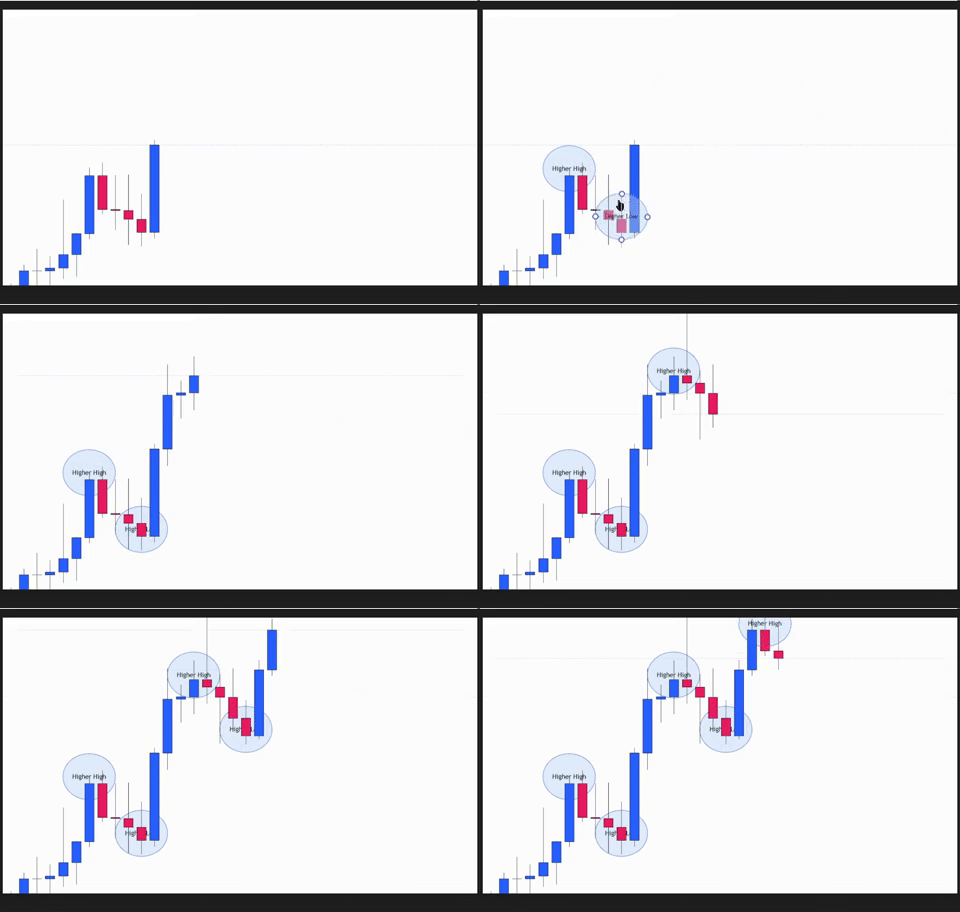
Note: Past performance is not a reliable indicator of future results.
A bearish trend develops when gold continues to form:
This pattern indicates that sellers are exerting greater downward pressure. Gold continues to make new lows, while upward retracements fail to break the previous significant highs.
During a bearish XAUUSD trend, traders may monitor support and resistance levels and bearish price action for potential selling opportunities.
Bearish Market Structure
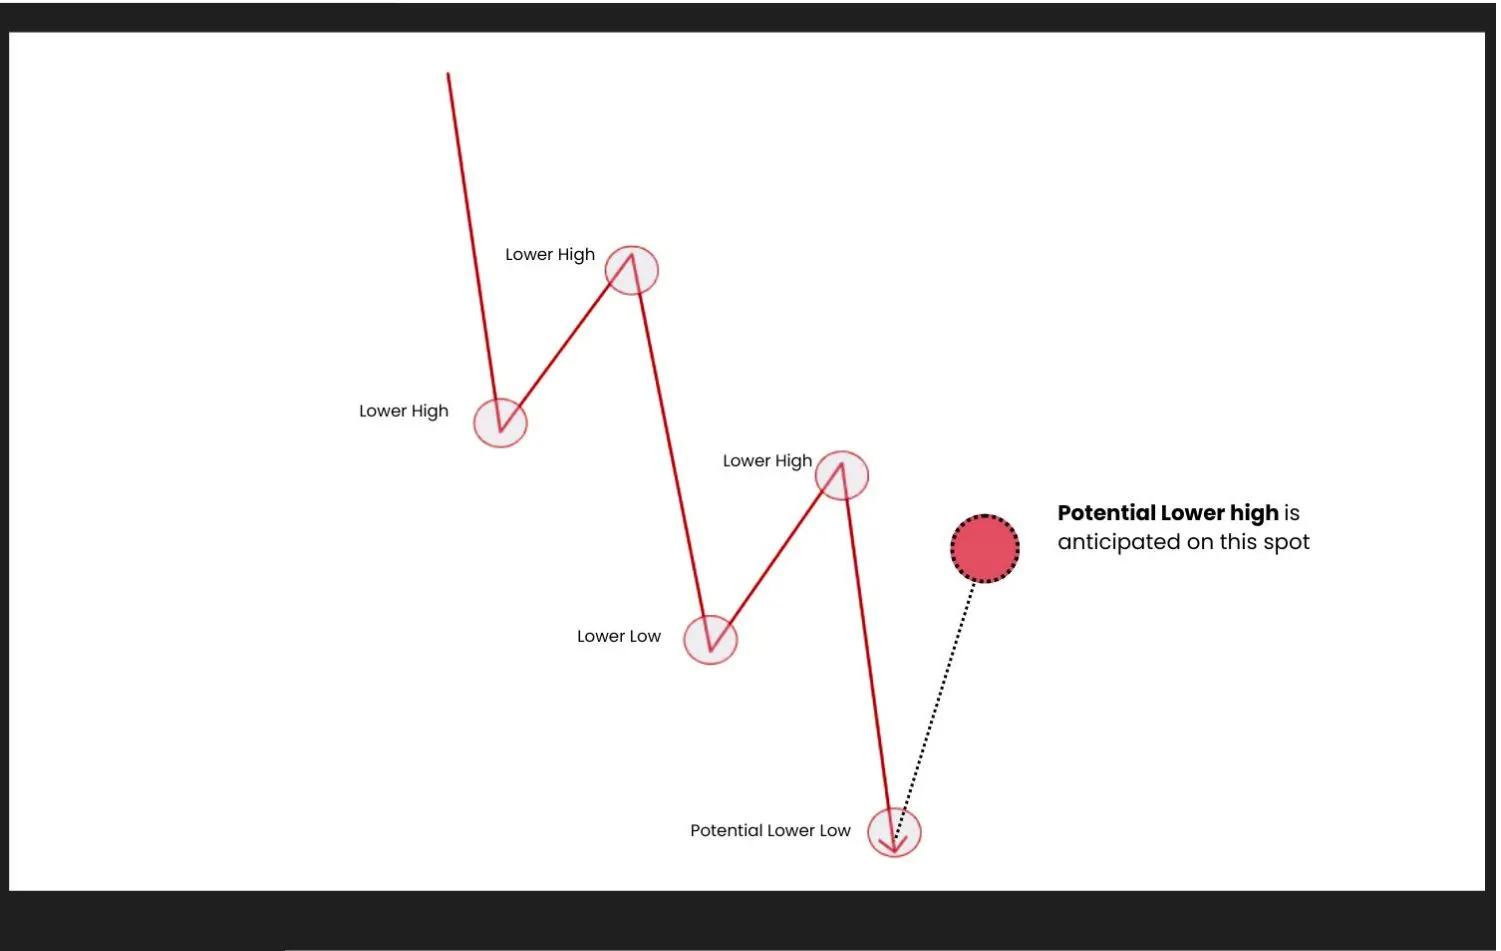
This is how a bearish trend looks on a gold chart:
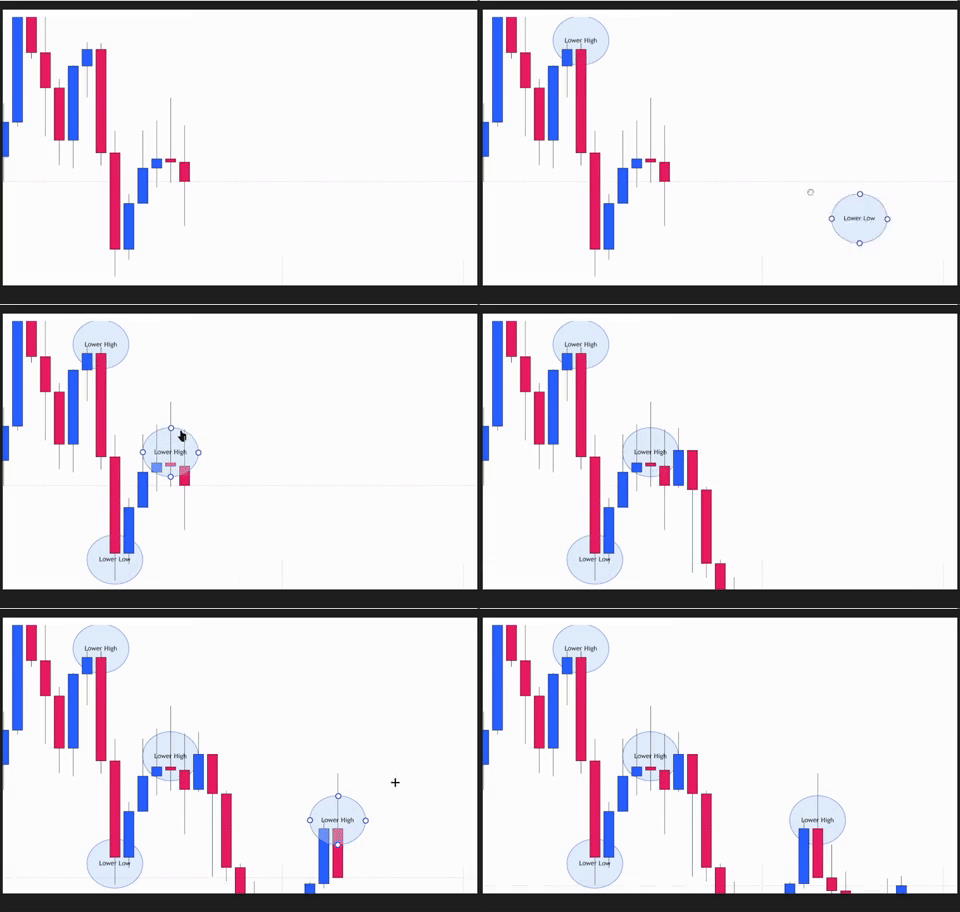
Note: Past performance is not a reliable indicator of future results.
A ranging market develops when gold moves between relatively established support and resistance levels without consistently forming higher highs and higher lows or lower highs and lower lows.
During these conditions, neither buyers nor sellers maintain clear directional control. Gold may repeatedly move toward resistance before pulling back to support, creating a sideways price pattern.
Trend-following strategies can become less effective during consolidation because price may repeatedly reverse before establishing a clear direction.
Traders can use support and resistance analysis to mark the boundaries of the range and wait for a confirmed breakout or a clear reaction at a key level instead of forcing trades in the middle of the range.
Ranging or Consolidating Market Structure
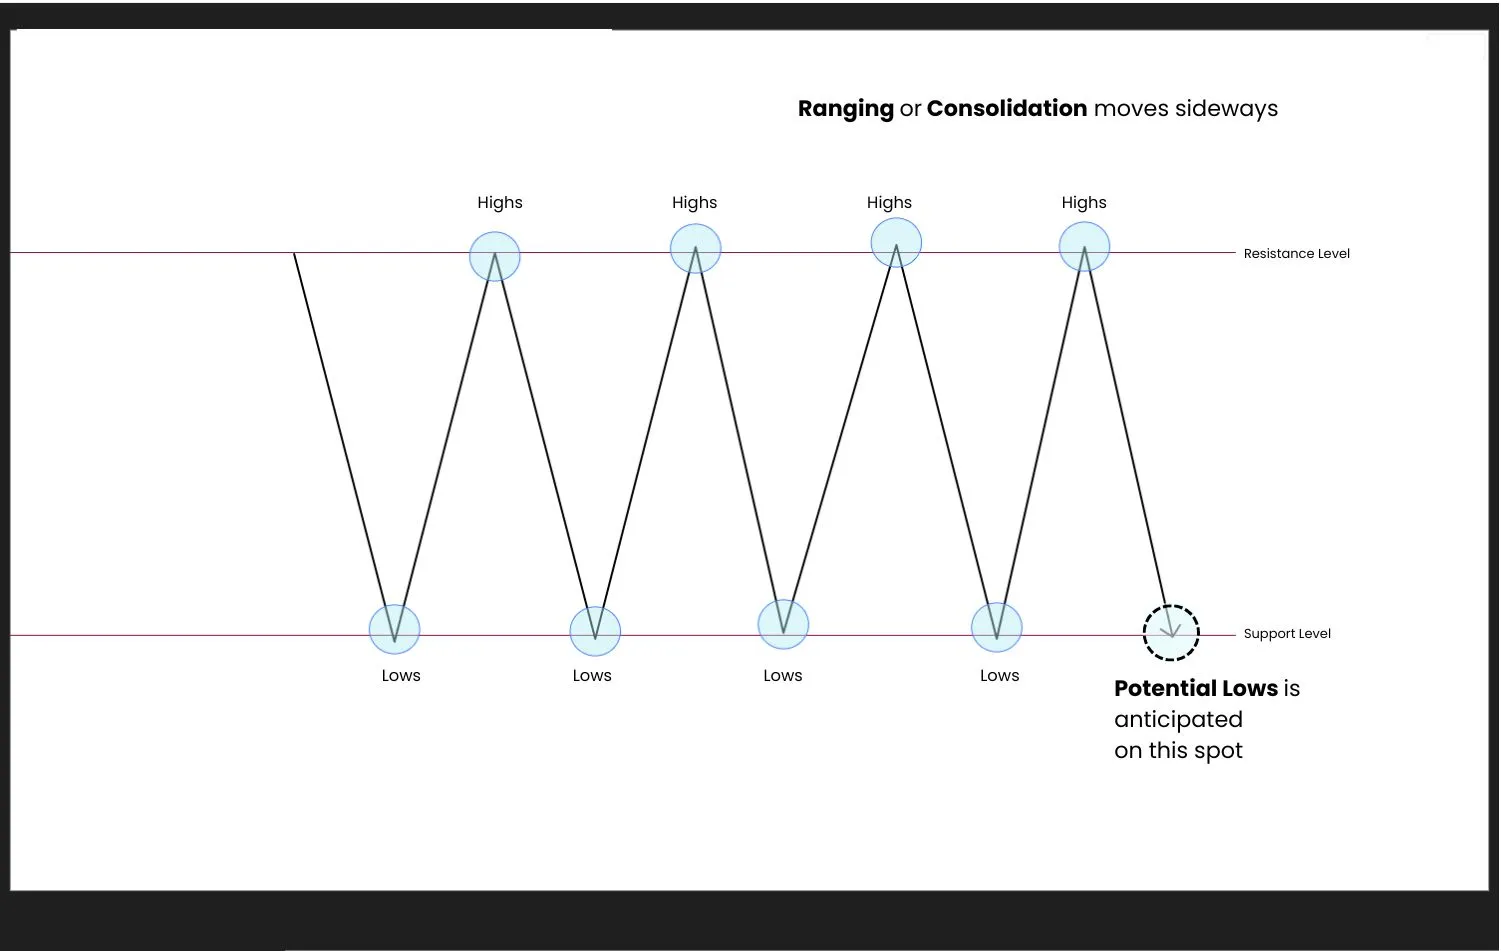
This is how consolidation looks on a gold chart:
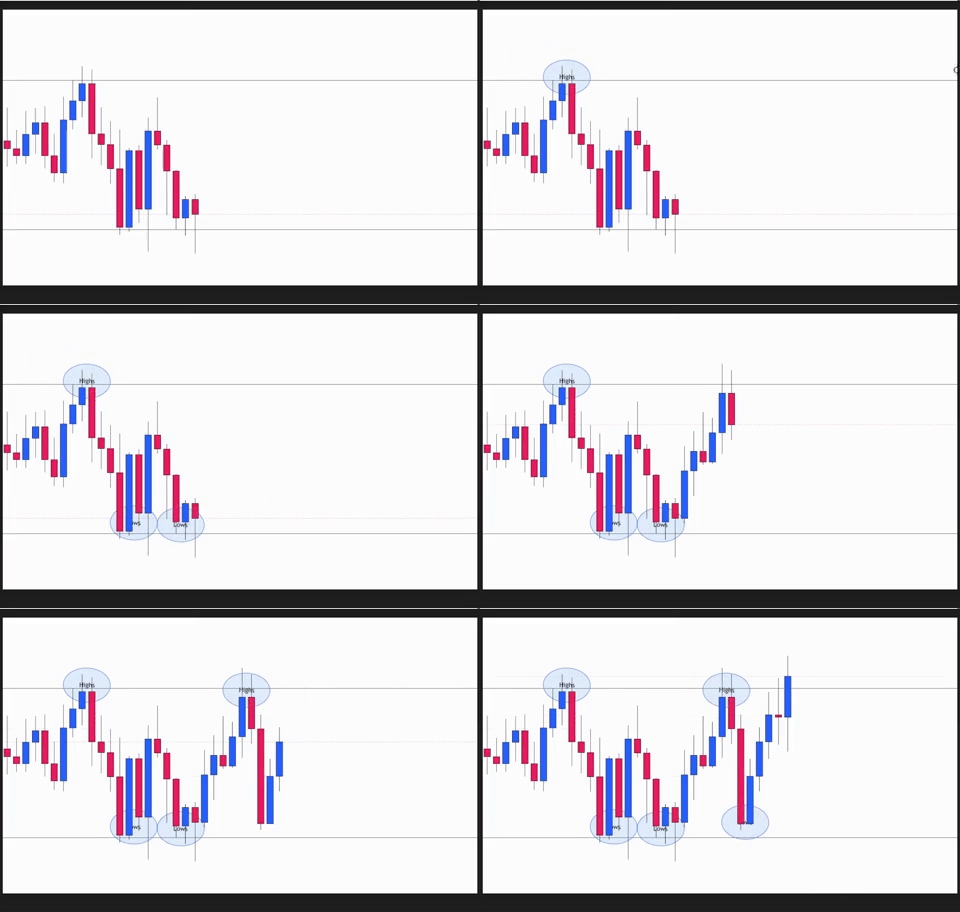
Note: Past performance is not a reliable indicator of future results.
Identifying the existing trend is only the beginning. Traders must also recognize when gold's market structure starts to change.
A trend change occurs when price begins to break the swing levels that previously maintained the trend. However, a single breakout does not guarantee a complete reversal.
For example, during a bullish trend, gold may repeatedly form higher highs and higher lows. If price eventually breaks below a significant higher low, it may signal that bullish momentum is weakening.
If gold then forms a lower high and breaks below another significant swing low, the evidence of a potential bearish trend becomes stronger.
The same principle applies in reverse when a bearish trend begins to shift toward bullish conditions. Traders can also study reversal chart patterns to understand how potential trend changes may develop.
When analyzing a potential trend change, traders should:
This approach helps traders respond to changes in gold price action instead of predicting reversals without confirmation.
Once you identify the trend, the next step is to determine where a potential trade setup may develop.
Start with the weekly or daily XAUUSD chart to understand the broader market direction. These timeframes can help you identify major swing points and important support and resistance zones.
For a more detailed approach, learn how to mark gold levels on the weekly chart to identify areas that may influence price movements.
Identify the price areas where gold has previously reacted. These zones provide context for assessing whether a pullback, breakout, or potential reversal is developing.
Traders can also study gold supply and demand zones to understand how important price areas fit into their technical analysis.
When gold reaches a key area, look for confirmation such as a bullish or bearish engulfing candlestick, a pin bar, or a break-and-retest pattern.
These signals can help you assess whether buyers or sellers are responding to the level. A breakout should not automatically be treated as confirmation of continuation, as false breakouts can occur when price moves beyond a level before returning to its previous range.
Some traders combine market structure with the exponential moving average (EMA) to assess trend direction and dynamic price reactions.
The EMA can provide additional context, but it should not replace the analysis of swing highs, swing lows, and key price levels.
Determine where the trade idea becomes invalid and calculate your position size based on your risk limits. Gold can experience sharp price movements, especially around major economic releases, so risk management remains essential.
Market structure helps traders organize their analysis, but it does not guarantee that a trade will succeed.
Market structure becomes more useful when combined with a repeatable trading process. Instead of entering immediately when gold moves, traders can wait for price to reach a relevant area and look for confirmation.
For example, a swing trader may identify a bullish trend on the daily chart, mark a weekly support zone, and then wait for bullish price action before considering an entry.
This approach combines trend direction, key levels, and entry confirmation into one process. Traders looking to connect these concepts can follow a step-by-step gold swing trading strategy using technical price action.
The objective is not to catch every move. It is to develop a consistent framework for evaluating potential setups and managing risk.

Think of a gold trend like an ocean current.
When the current moves in one direction, swimming with it generally requires less effort than swimming against it. Fighting the current can make progress more difficult.
Gold price action works in a similar way. When market structure shows a clear bullish trend, traders can focus on potential buying opportunities. When the structure is bearish, they can focus on potential selling opportunities.
This does not mean the trend will continue indefinitely. Market conditions can change, which is why traders must keep monitoring price structure.
The principle is simple: understand the direction of the market before deciding how to trade it.

Mastering XAUUSD market structure starts with understanding how gold forms higher highs, higher lows, lower highs, and lower lows.
These patterns provide a practical way to identify bullish, bearish, and ranging conditions. They also help traders recognize when the existing trend may be weakening or changing direction.
Before looking for an entry, ask yourself one simple question:
"Who's in control of gold right now, buyers or sellers?"
When you learn to read gold market structure and wait for confirmation at key price levels, you can make more structured trading decisions instead of guessing where the market will move next.
That is the foundation of price action trading: understand the trend, wait for the setup, and manage your risk.
_____________________________________________________________________________________
Move from learning price action to applying it in the real market.
Trade:
Access trading platforms and tools including ACY, MT4, MT5, and Copy Trading.
Create an Account and Start Live Trading
_____________________________________________________________________________________
Build your trading foundation with these step-by-step guides:
Learn to read price action and assess trading setups at key levels:
Learn to recognize bullish, bearish and sideways markets:
Learn to mark key levels and interpret price reactions:
Understand recurring price patterns, retests and false breakouts:
Learn to combine candlestick signals with price action analysis:
Learn to recognize patterns that may signal a change in market direction:
Explore how to combine the exponential moving average with price action:
Bring your technical analysis skills together through a gold swing trading guide:
Learn how risk management and position sizing fit into your trading plan:
Learn how to plan take-profit targets using market structure and risk-reward:
Develop discipline, emotional awareness and a more consistent trading process:
Explore the psychological habits behind a disciplined trading approach:
_____________________________________________________________________________________
Not sure where to begin? Here’s a simple roadmap to guide you:
By building step by step; from basics → real trading → mastering the craft, you’ll gain clarity, confidence, and steady progress without ever feeling overwhelmed.

_____________________________________________________________________________________
Follow Ruffy Grant B. Capacio for Gold analysis, Forex trading ideas, price action education, trading psychology, and market insights: LinkedIn
ACY Securities: Join the Discord Server
Disclaimer:
Trading Forex, Gold, CFDs, cryptocurrencies, commodities, indices, and other leveraged financial instruments involves a high degree of risk and may not be suitable for all investors or traders. Market conditions can change rapidly, and leveraged trading can result in losses that occur quickly.
Before trading, carefully consider your investment objectives, level of experience, and risk tolerance. Only trade with capital you can afford to lose and seek independent financial or professional advice where appropriate.
All market analysis, price forecasts, technical commentary, trading scenarios, educational materials, and opinions presented in this content are provided solely for general informational and educational purposes. They do not constitute financial advice, investment advice, a recommendation, solicitation, or an offer to buy or sell any financial instrument.
Past performance and historical price movements are not reliable indicators of future results. Any price levels, targets, scenarios, or market outlooks discussed should be viewed as analysis rather than guarantees of future market performance. October 15, 2026
ACY Securities is one of Australia's fastest growing multi-asset online trading providers, offering ultra-low-cost trading, rock-solid execution, technologically superior account management and premium market analysis.

Select the categories and companies you wish to follow directly to your person rss feed.
Create Custom RSS FeedSign up and join over 5,000 professional members who receive personalized news alerts, curated professional connections, and more for free!
Learn gold market structure to identify bullish, bearish and ranging XAUUSD trends using higher highs, higher lows, lower highs and lower lows, support and resistance.
Axi has launched an MCP integration connecting eligible MT5 accounts to Claude, allowing clients to access live market data, track positions, execute trades and update risk parameters through the AI assistant developed by Anthropic. Available to eligible Axi clients with an active MT5 account. Setup runs via Claude.ai.
Movantis has selected Integral to extend its FX liquidity offering for institutional clients including banks, payment networks and digital asset operators, adding an institutional trading platform, direct-to-client API trading and API connectivity into a third-party multi-dealer venue, supporting regional expansion.
Running a venue around the clock is the easy part. Pricing risk when the market underneath it is shut is not. Lars Holst, CEO of GCEX explains how to manage risk in 24/7 markets.
ATFX has released its Q4 2026 Trader Magazine, offering a closer look at the macroeconomic and market forces that could shape trading conditions in the final quarter of the year.
LSEG has announced a collaboration with NVIDIA that lets financial institutions analyse years of LSEG Tick History data in seconds using NVIDIA cuDF on GPUs, without creating another full copy of the dataset. Tick History holds 110 trillion rows across 100 million instruments and more than 580 venues and contributors.
Standard Chartered has launched a cryptocurrency trading solution letting eligible affluent clients buy and sell Bitcoin and Ether through existing bank accounts. Built with Zodia Markets and regulated by VARA, it launches first for Professional Investor clients in the UAE, with other markets to follow over time.
WTI crude oil breaks above daily resistance after rejecting weekly support. Explore key price levels, breakout confirmation, and the potential 100.305 target.
IG Prime has confirmed Investec Prime Services as a new partner for its institutional white label solution, giving institutional clients in South Africa access to IG’s multi-asset global trading platform under the Investec Prime Services brand. The offering spans equities, indices, FX, commodities and fixed income.
PLUGIT announcing a new YOONIT UX/UI experience coming across all six modules.