just now

Liquidity Finder Ltd is incorporated in England and Wales, company number 10610740, registered address 167-169 Great Portland Street, Fifth Floor, London W1W 5PF, United Kingdom.
Published: just now
Every trader has a “spot” on the chart they like - that fair value gap, previous day high, or clean range low that screams this is where price will turn.
But here’s the truth: an area of interest is only that - an interest.
It’s not a signal. It’s not a setup.
It’s a location that deserves your attention, not yet your capital.

The moment you mistake interest for confirmation, emotion takes the wheel. The moment you wait for confirmation, logic returns to the driver’s seat.
That’s what the Confirmation Matrix is for - a mechanical process that transforms curiosity into conviction.
Think of it as your trading dashboard. When the right lights turn green - structure shift, displacement, volume alignment, liquidity sweep, and return to value - you know it’s time to move. For a bigger picture of precision execution, you can also study the companion piece, Anatomy of a Perfect Execution.
Let’s break down how to build trust in your setup, one confirmation at a time.
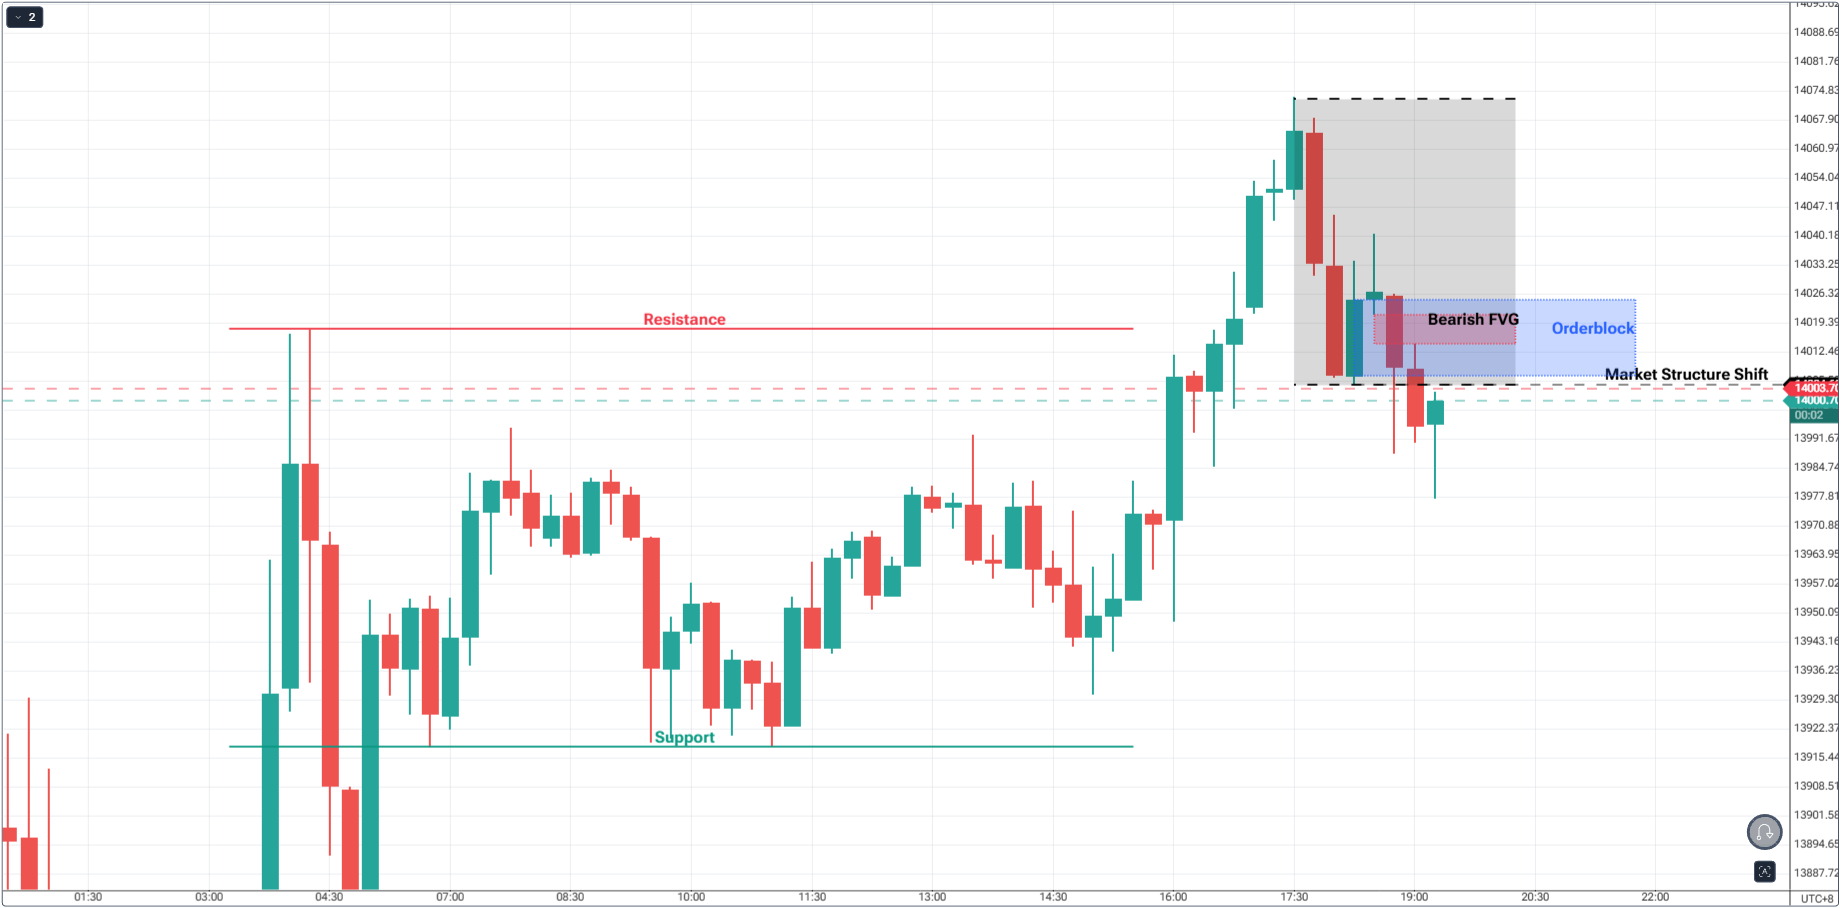
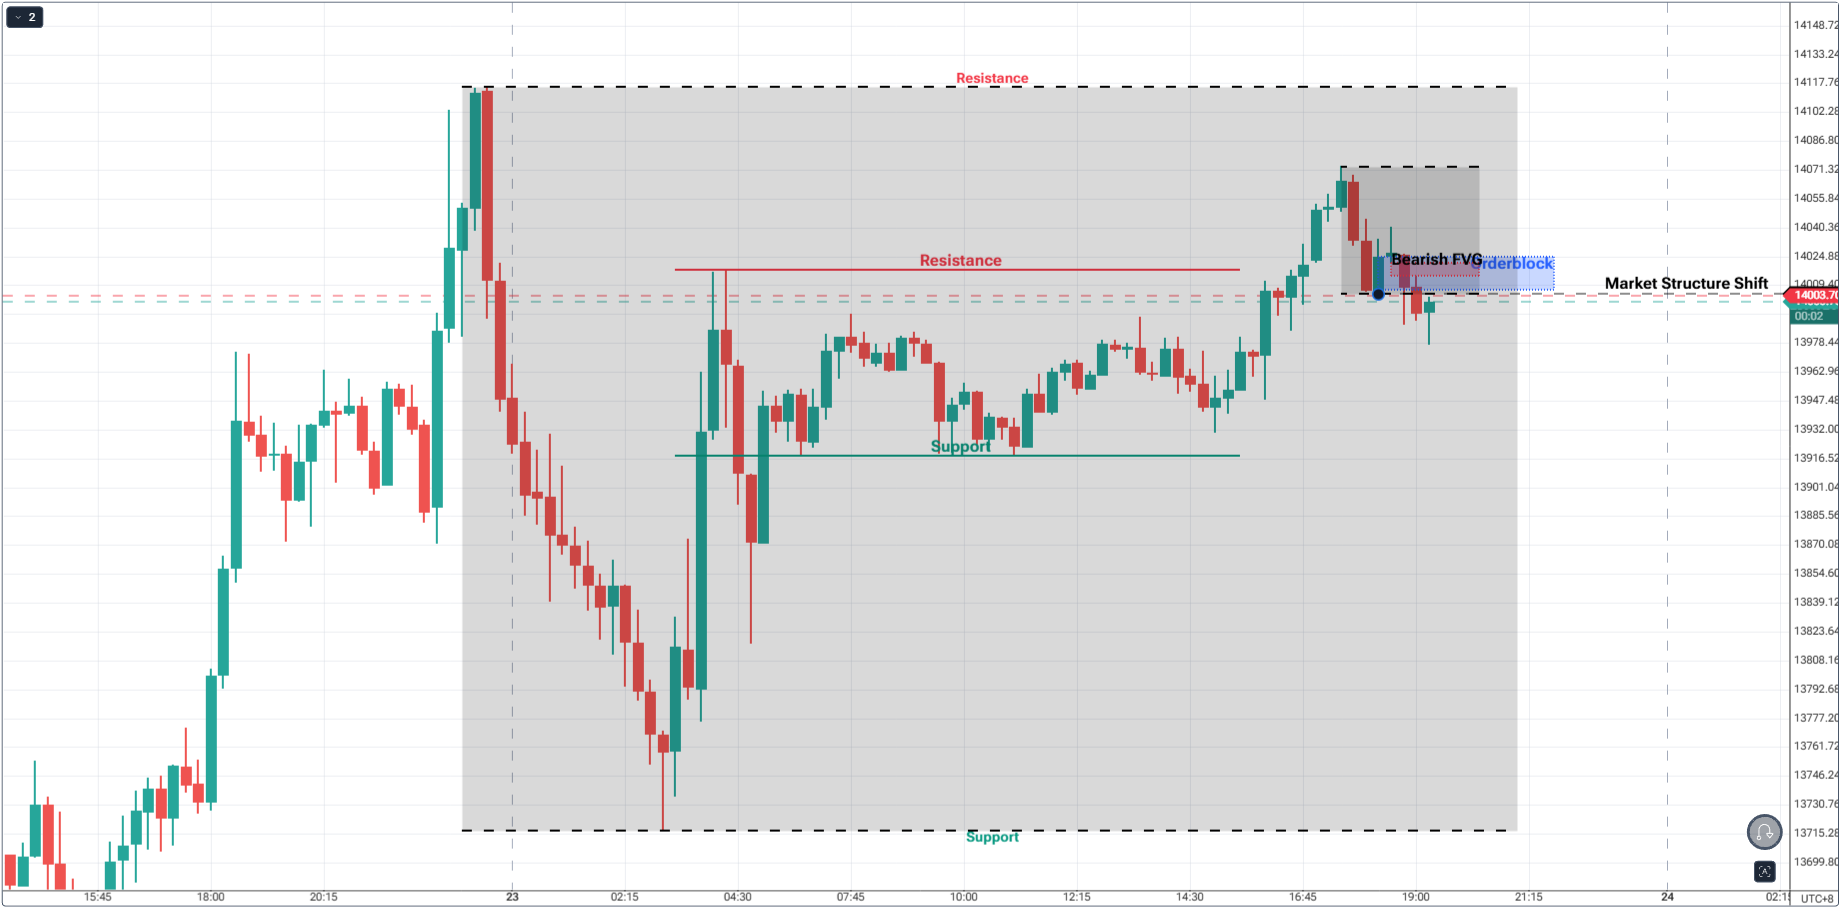
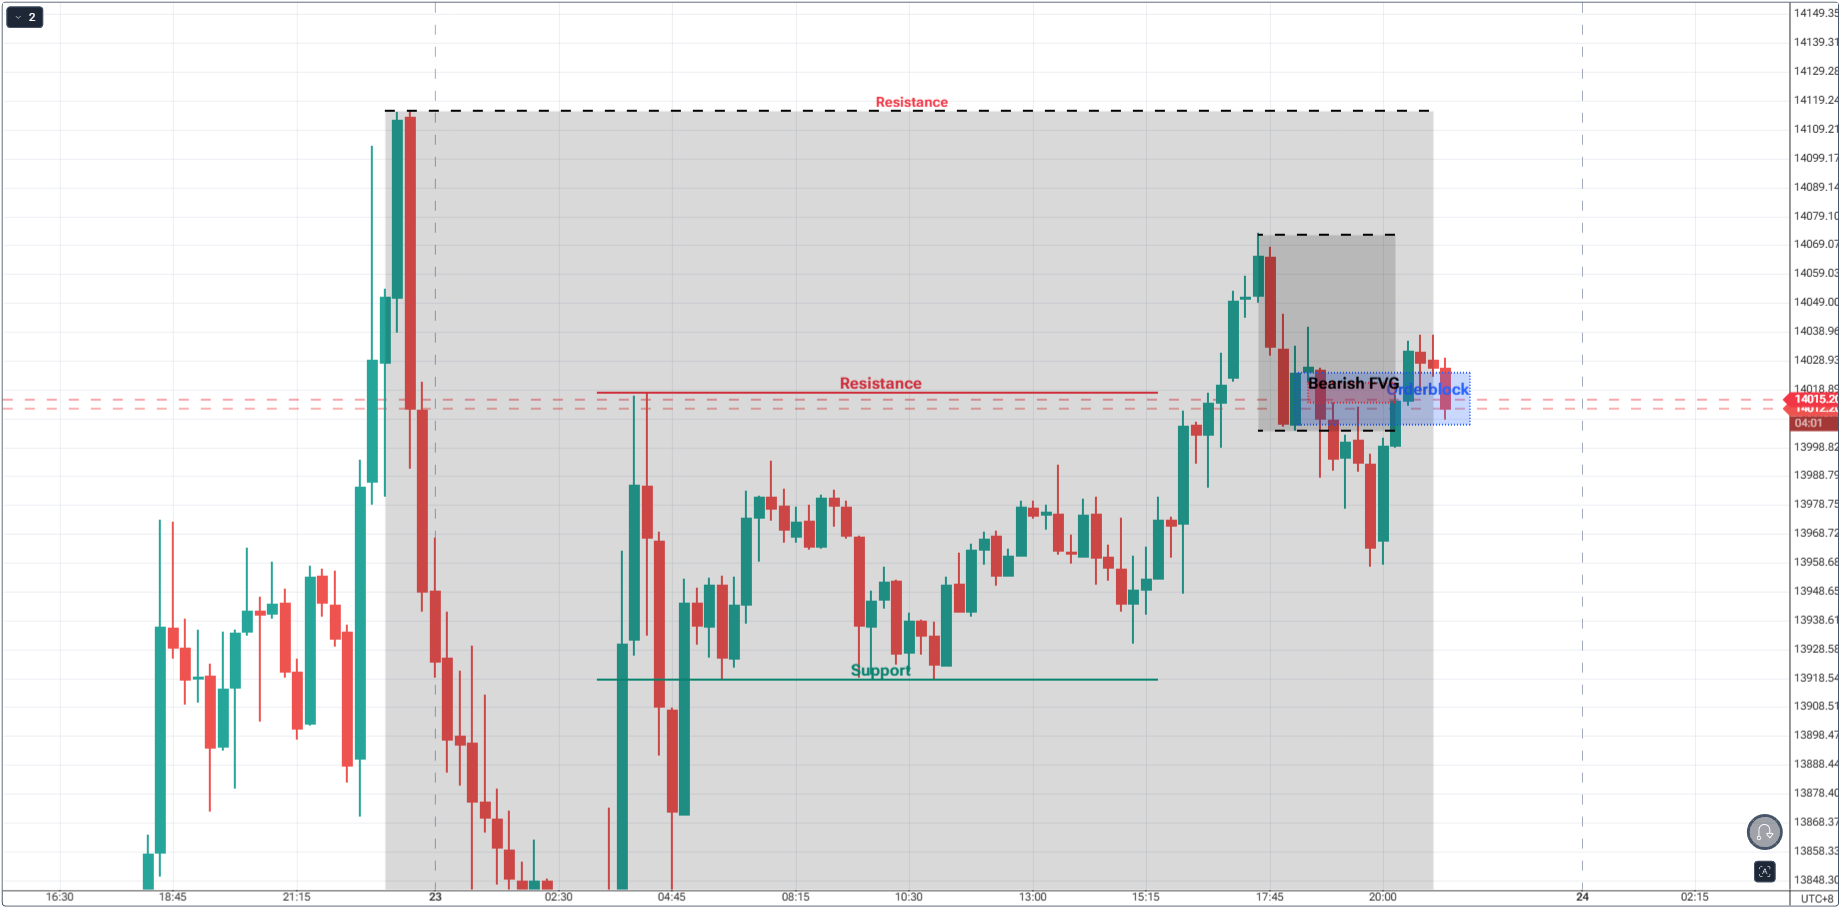
You’ve marked your chart - an imbalance, an order block, or a previous session high/low. It looks perfect.
But before you rush in, pause. This is your Point of Interest (POI) - a potential battleground, not a confirmed opportunity.
At this stage, your only job is to observe how price reacts.
In the case above, we already have a point-of-interest with confluences of:
The POI sets the stage, but confirmation reveals whether the actors - liquidity, displacement, and order flow - actually showed up. If your POI is an FVG, here’s a deeper primer on Fair Value Gaps and how they form.
A common trap for traders is mistaking a lower timeframe pullback for a full reversal.
Looking at the chart above, price has broken out of the micro-box(range inside the bigger range), but despite breaking out, there’s no strong follow-through to the upside.
This is why it’s essential that price must have a follow-through before executing.
When your H1 or Daily trend points up, but your M5 shows a sharp drop, that move could be nothing more than a fakeout - liquidity being cleared before continuation.
Your confirmation matrix starts with alignment.
Markets are like interviews. They don’t answer your first question. They test if you’ll ask the right next one.
Your Point of Interest is the first question - “Is this where price might turn?”
The confirmation process is the follow-up - “Can you prove it?”
And price always answers... with structure.
This is where logic starts to take shape.
A structure shift is your first sign that the market is responding, not reacting.
If you’re looking for a buy, wait for price to break a short-term high.
If you’re looking for a sell, wait for it to break a short-term low.
The key is intent.
A wick through the level isn’t intent - it’s noise.
A full-bodied close beyond it, especially after a liquidity sweep, is your first tick on the confirmation checklist.
Structure defines the skeleton of your trade. Without it, every other signal collapses. If you like using candlestick evidence for this step, this guide on Candlestick Pattern Analysis with SMC shows what “intent” looks like in the candles themselves.
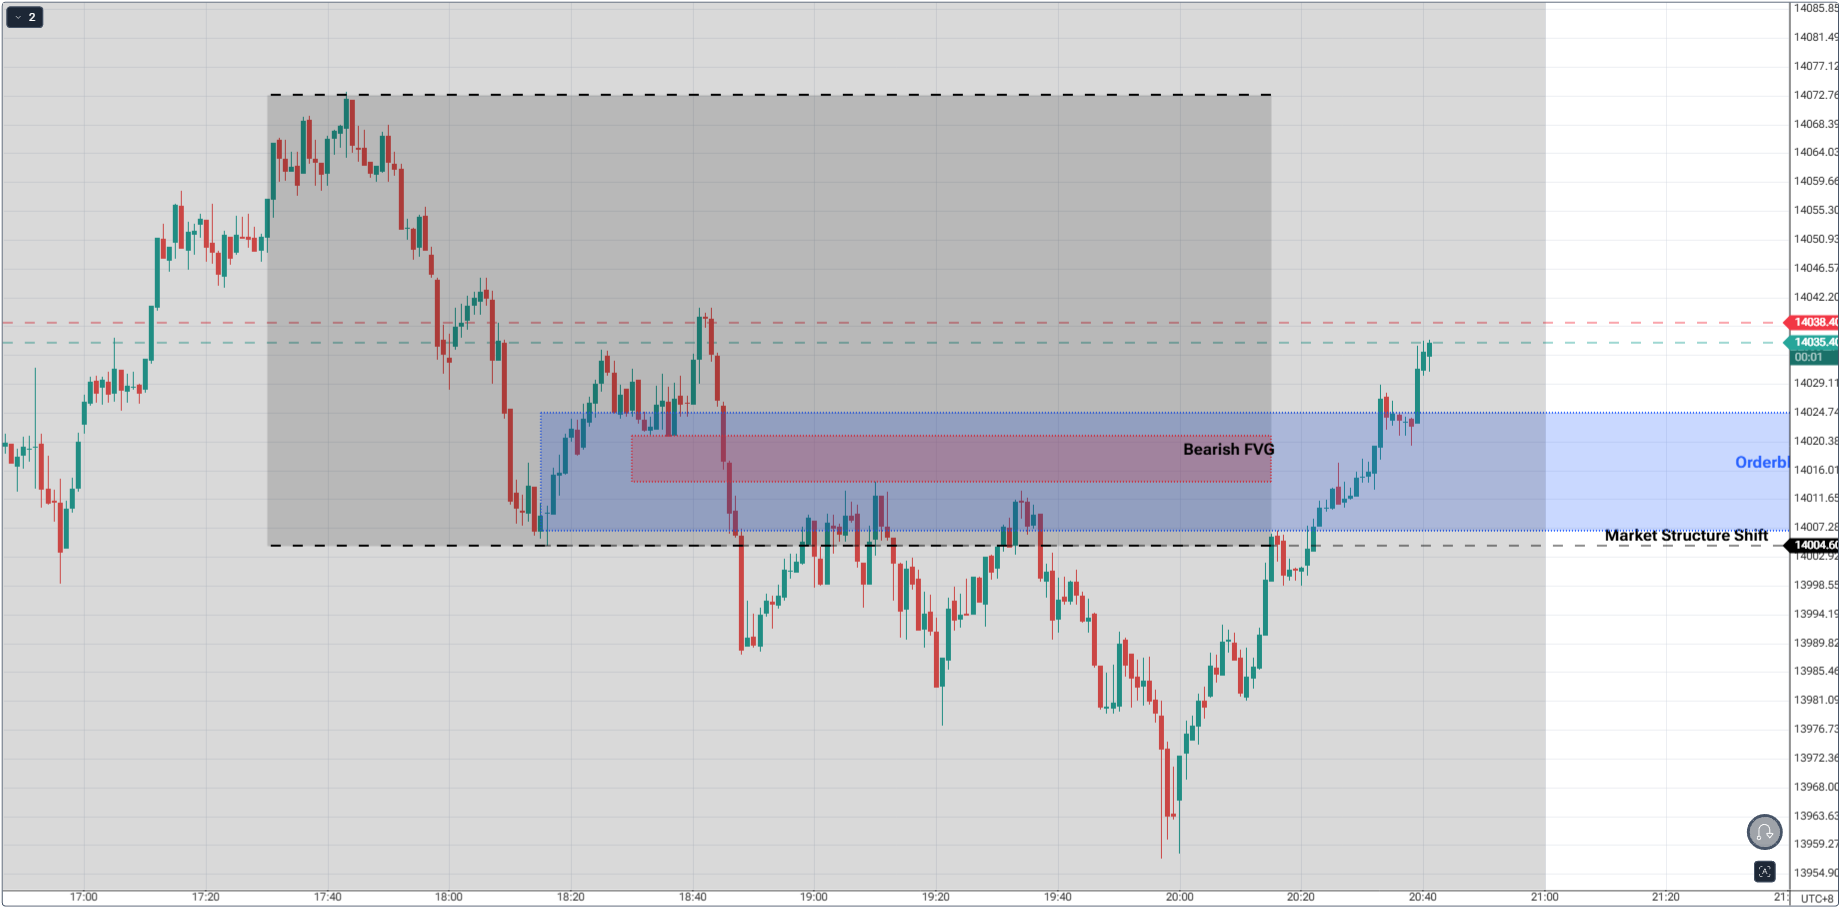
The best entries aren’t at the impulse - they’re at the retracement into the fair value gap or order block that formed during displacement.
This is where imbalance gets rebalanced, and risk gets minimized.
You’re not chasing confirmation here - you’re validating it.
When price returns to the gap or the order block, your point-of-interest, that’s your low-risk, high-probability entry zone - where logic meets timing. If you prefer a rules-based retest approach, study Retests with Confirmation After Breakouts.
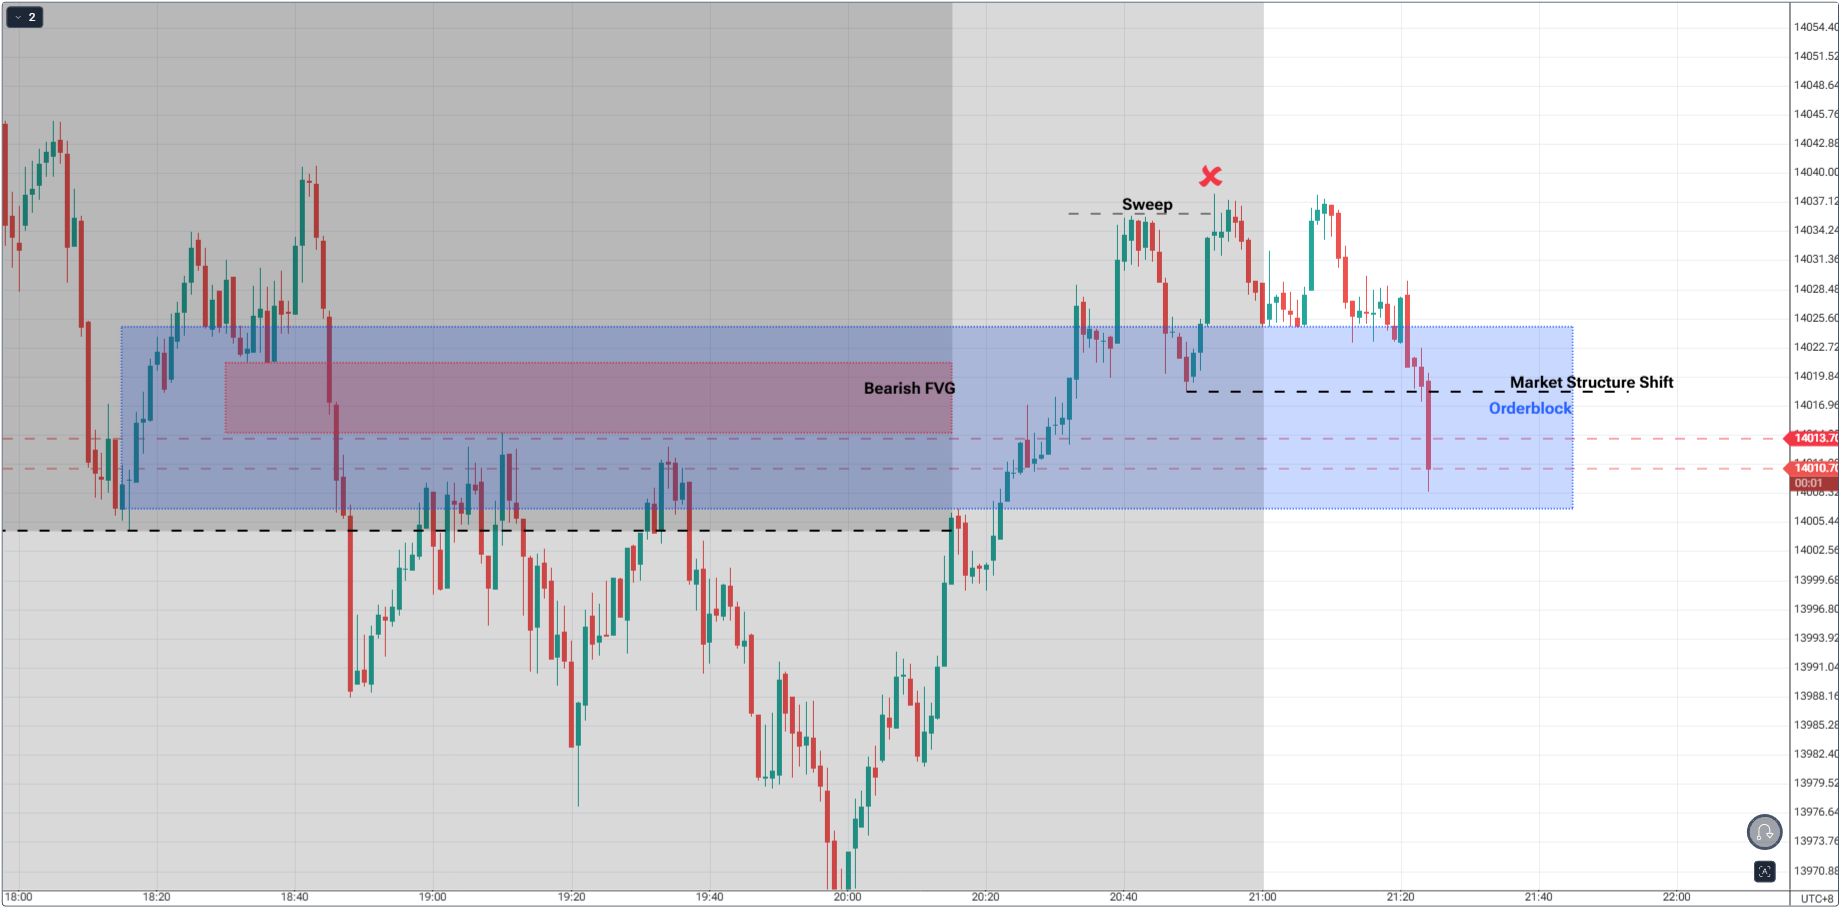
Before every strong move, there’s usually pain - someone else’s.
Liquidity sweeps are that pain made visible.
Watch for price to take out previous highs or lows, stop-hunt round numbers, or trigger obvious retail zones - then shift structure.
This is how institutional traders collect liquidity before moving the market in the real direction. For a deep dive into this footprint, see Understanding Liquidity Sweeps.
A setup without a sweep is like a storm without pressure - it might not have enough force to last.
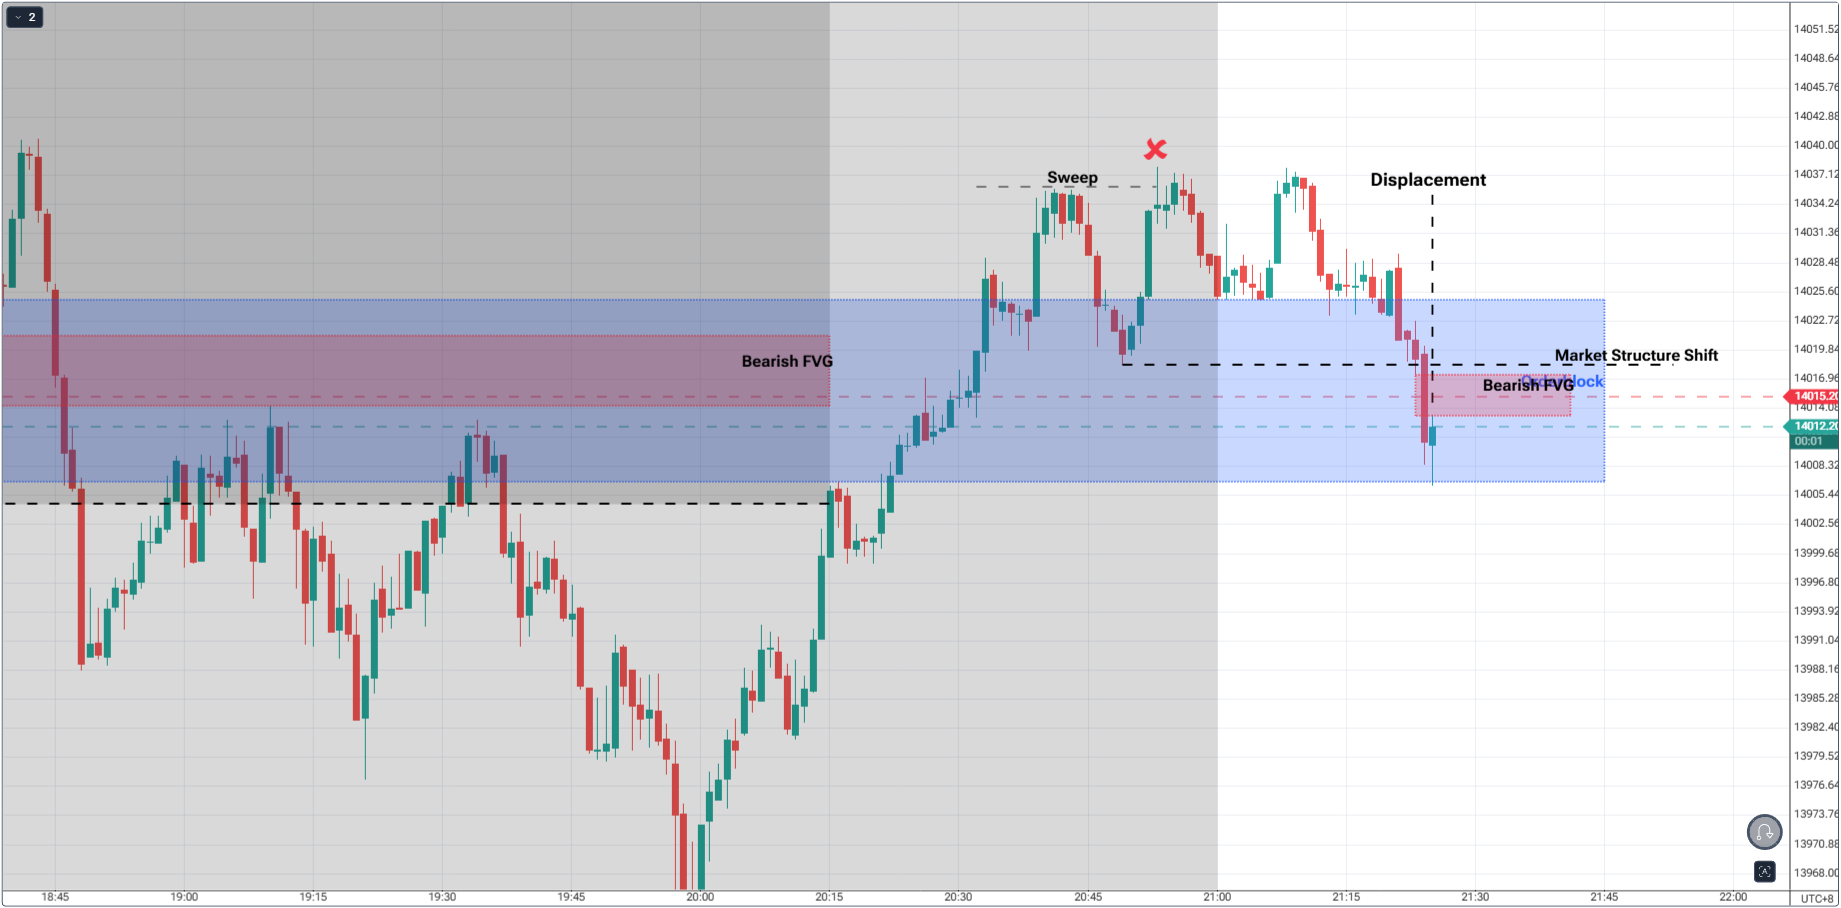
After the sweep and structure shifts on the execution timeframe, look for displacement - that clean, impulsive move that shows institutional participation.
Displacements normally have FVGs in their pattern.
You’ll recognize it instantly: wide-bodied candles, small wicks, and sudden acceleration with fair value gaps.
Displacement is the heartbeat of confirmation.
It tells you whether the shift in structure has muscle behind it.
But be careful.
If displacement forms against the higher timeframe trend, it could be a trap - a fake pulse meant to lure impatient traders.
In this case, lower timeframe is still in-synced with the higher timeframe as candles does not confirm a bullish follow-through at the premium level.
The real displacement always flows with narrative context, not against it. When this occurs around session opens, use the timing playbooks in Mastering the New York Session.
Volume doesn’t lie. It tells you who’s actually moving the market.
When price moves sharply but volume stays flat, it’s a hint that only retail is participating.
However, when you see a burst in volume during displacement, followed by a calm retracement, that’s your confirmation rhythm.
It’s effort meeting result.
High volume confirms that smart money is active.
Low volume on the pullback confirms that smart money is waiting to re-enter.
But here’s the nuance most traders miss: volume is relative.
The data you see depends on where you trade. CFD brokers aggregate prices from different liquidity providers, so each feed shows its own version of “volume” - not the entire market’s participation.
If you want a clearer picture, check the futures volume. Unlike CFD brokers, futures markets are centralized on exchanges like CME, so prints reflect consolidated participation. Use CFD volume for rhythm, but lean on futures volume when you need decisive confirmation of participation.
Always ask:
Displacement that moves against the higher timeframe is like swimming against the current - possible, but exhausting and often short-lived. If this part feels fuzzy, revisit Multi-Timeframe Analysis in SMC for a clear workflow.
For day traders, timing is a confirmation layer. Indices and many FX crosses reveal the day’s true intent when liquidity concentrates at key sessions.
If you trade indices, wait for the cash open. The first 15-30 minutes often deliver the displacement that validates your bias, or exposes your read as premature.
Use your POI, then marry it to session timing: London set the range, New York tests or breaks it.
If your matrix is at 3 of 6 before the open, let the bell be the fourth light. No session - no confirmation.
Build your playbook around this with How To Trade & Scalp Indices at the Open Using SMC and the broader session context from Mastering the New York Session.
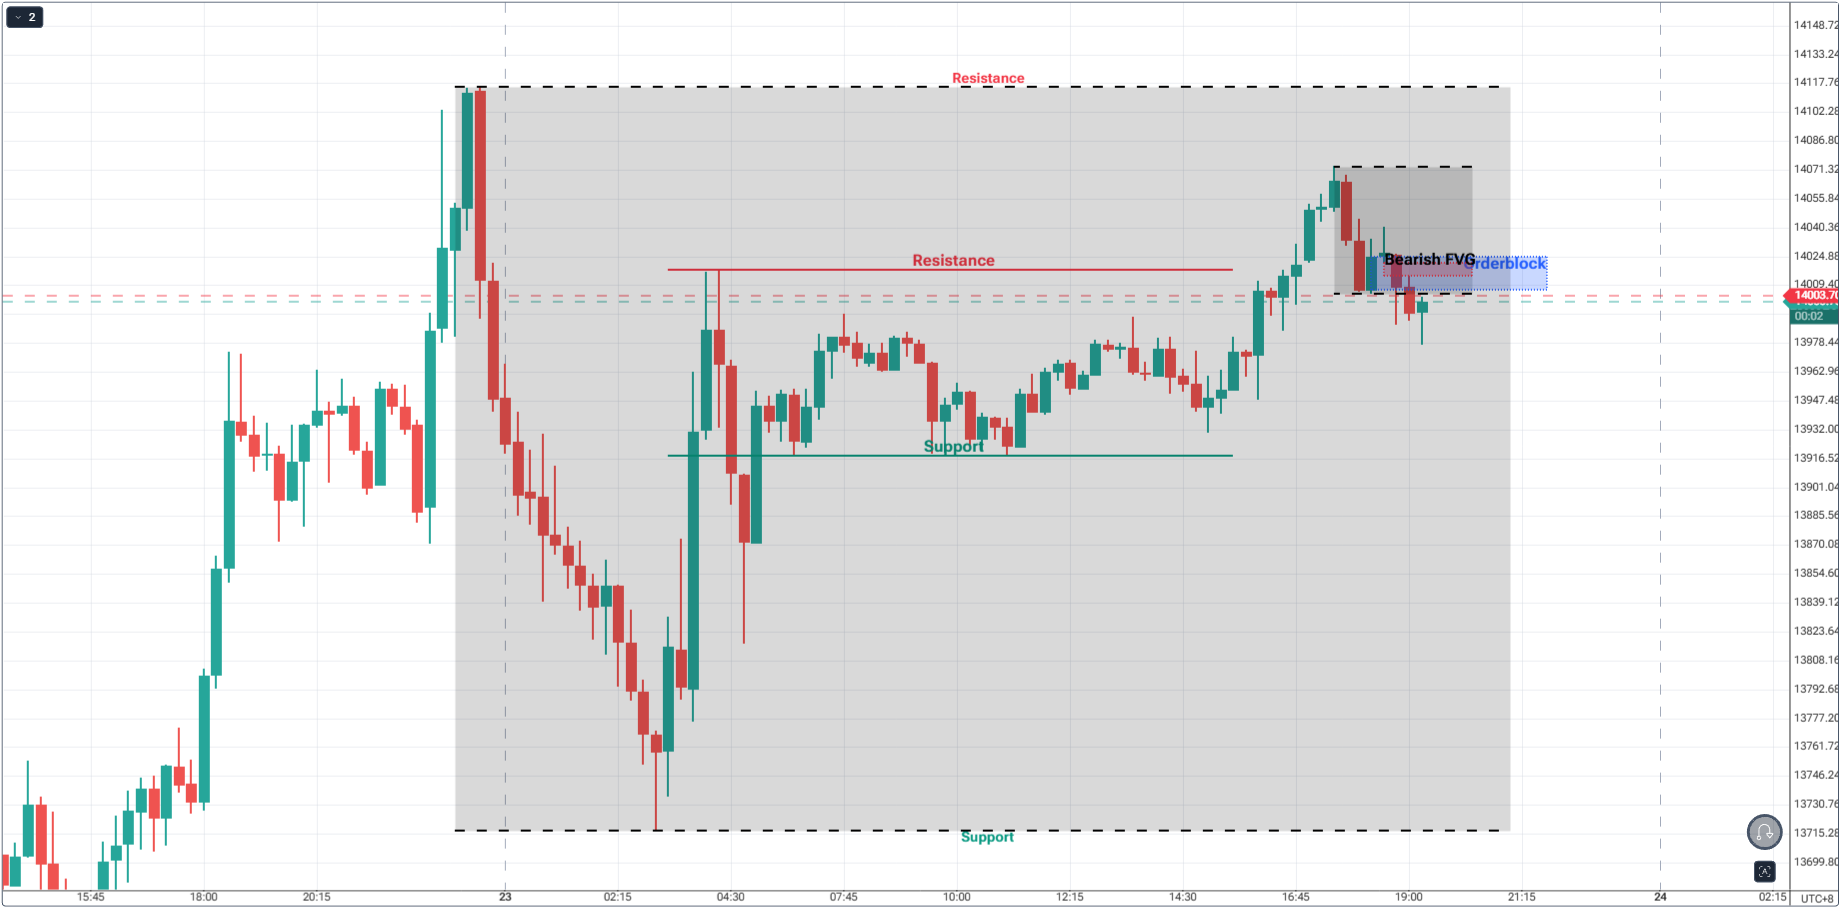
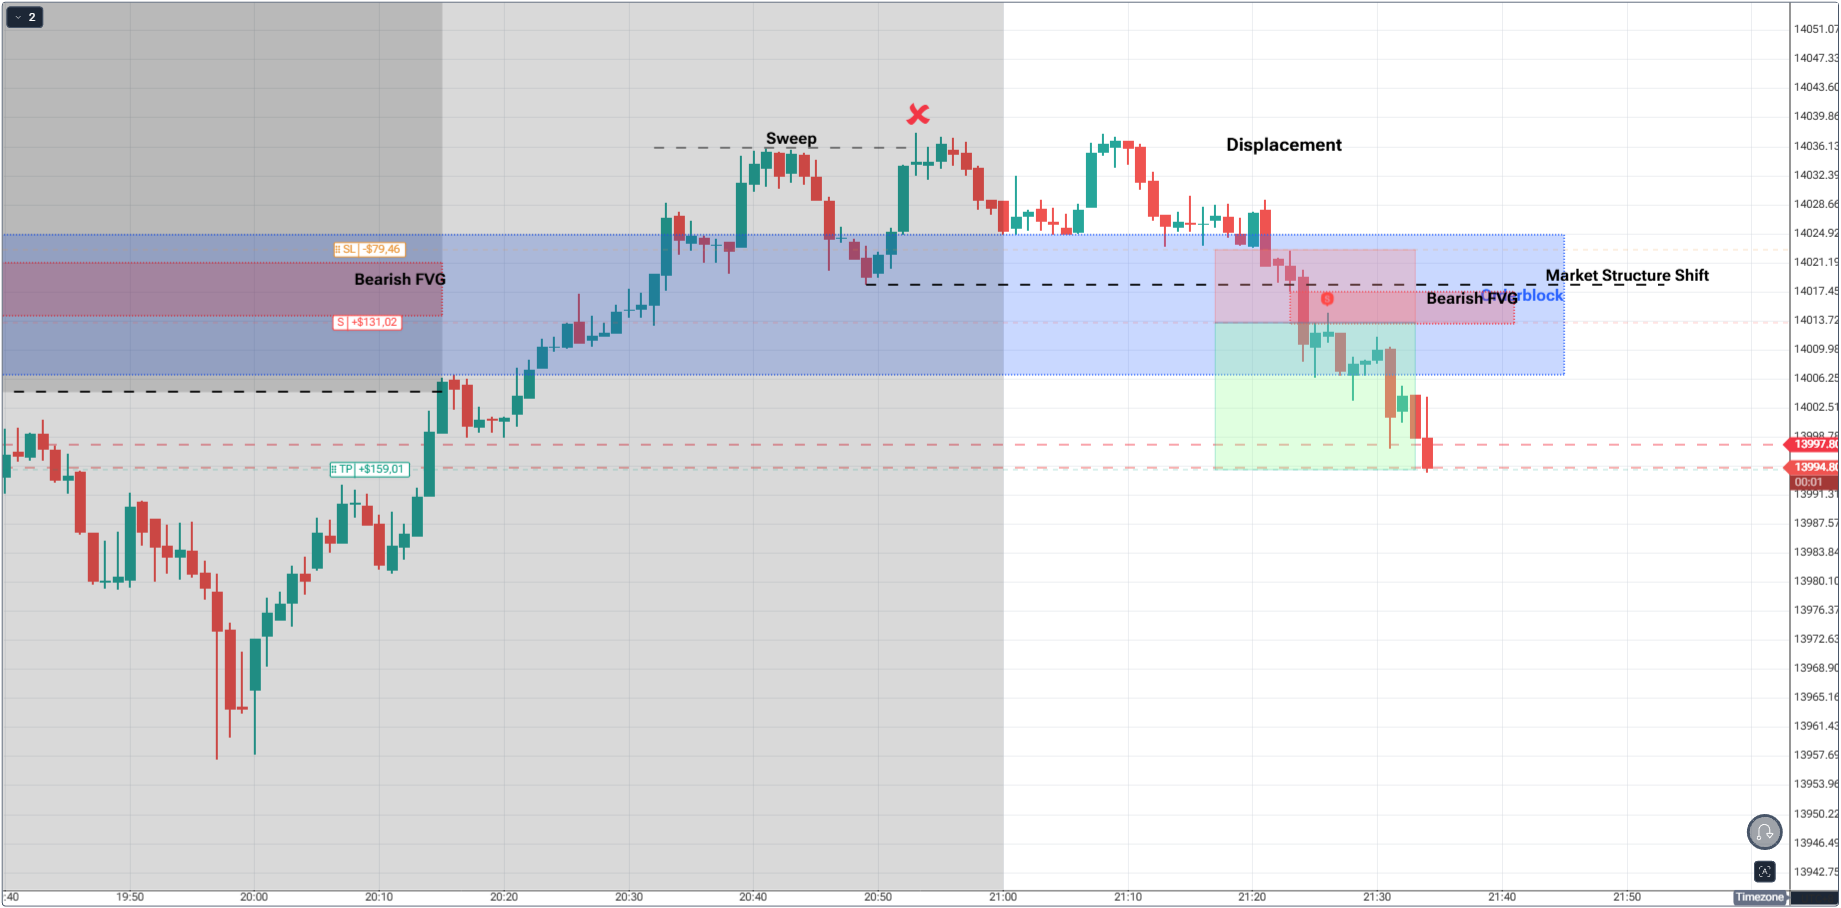
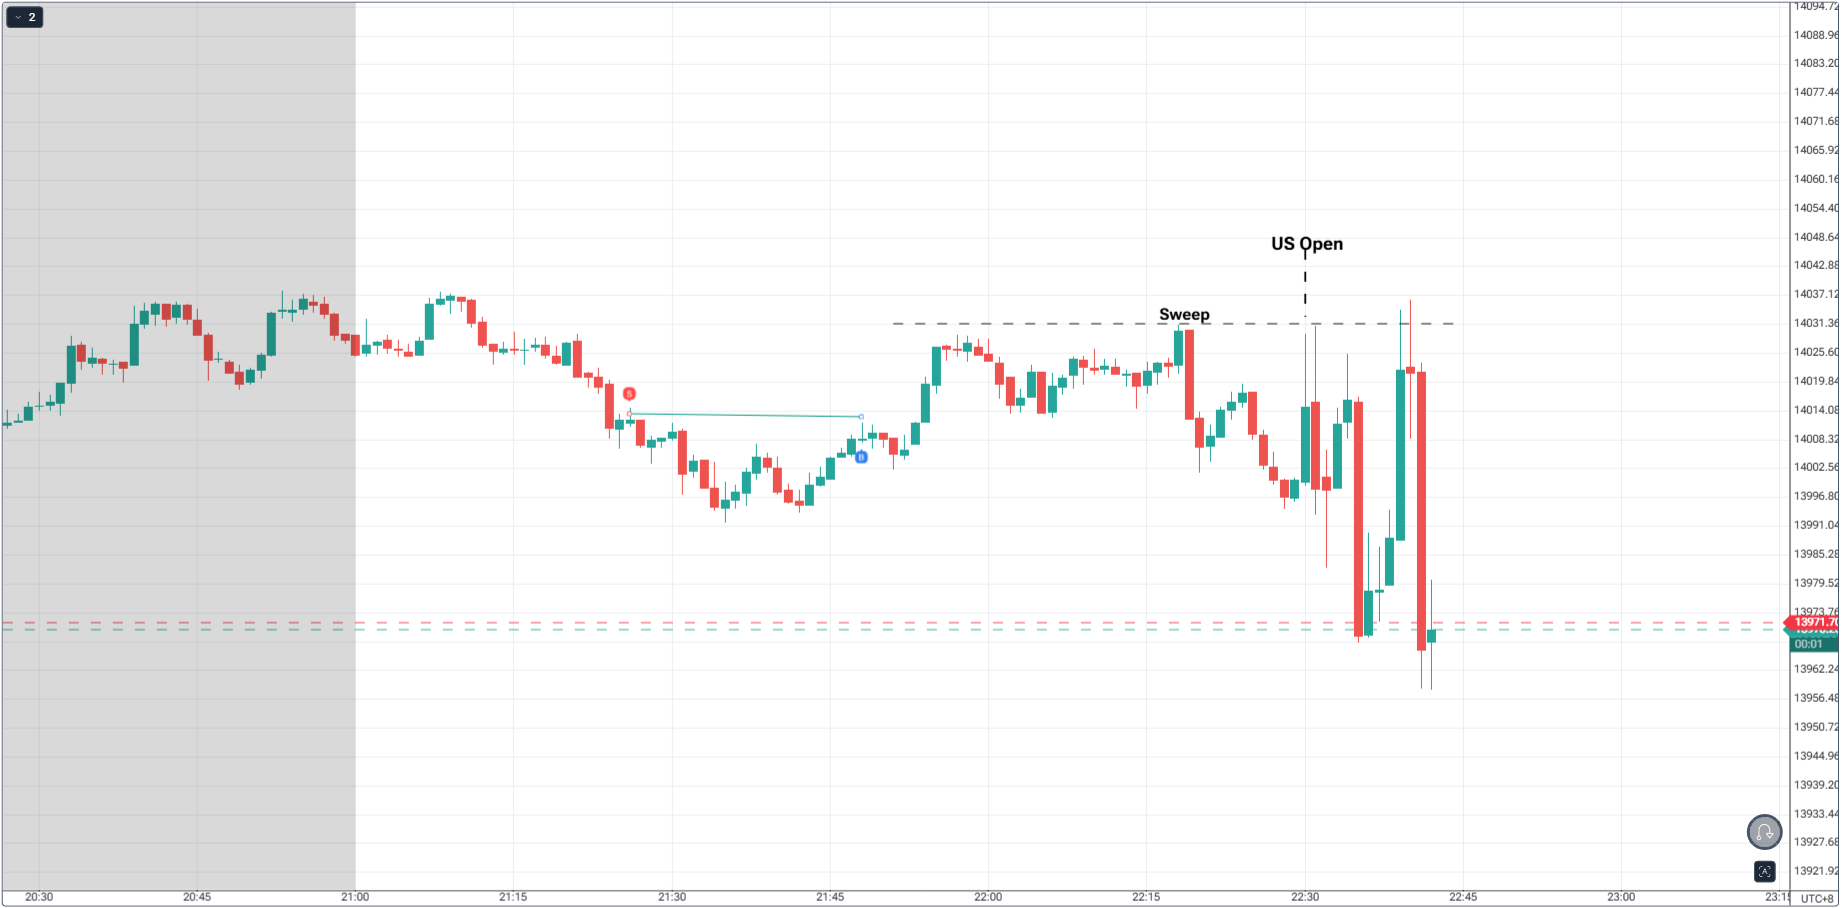
Above, we can see that despite having a good short on our point-of-interest, price wasn’t able to hit our target profit due to spread.
The reason: Nasdaq is yet to open. We entered the market pre-maturely. And spread is still too wide, meaning, liquidity is still thin.
Trade resulted to breakeven. The best approach to lessen risks like this: Wait for the Key Session. In this case, the US open.
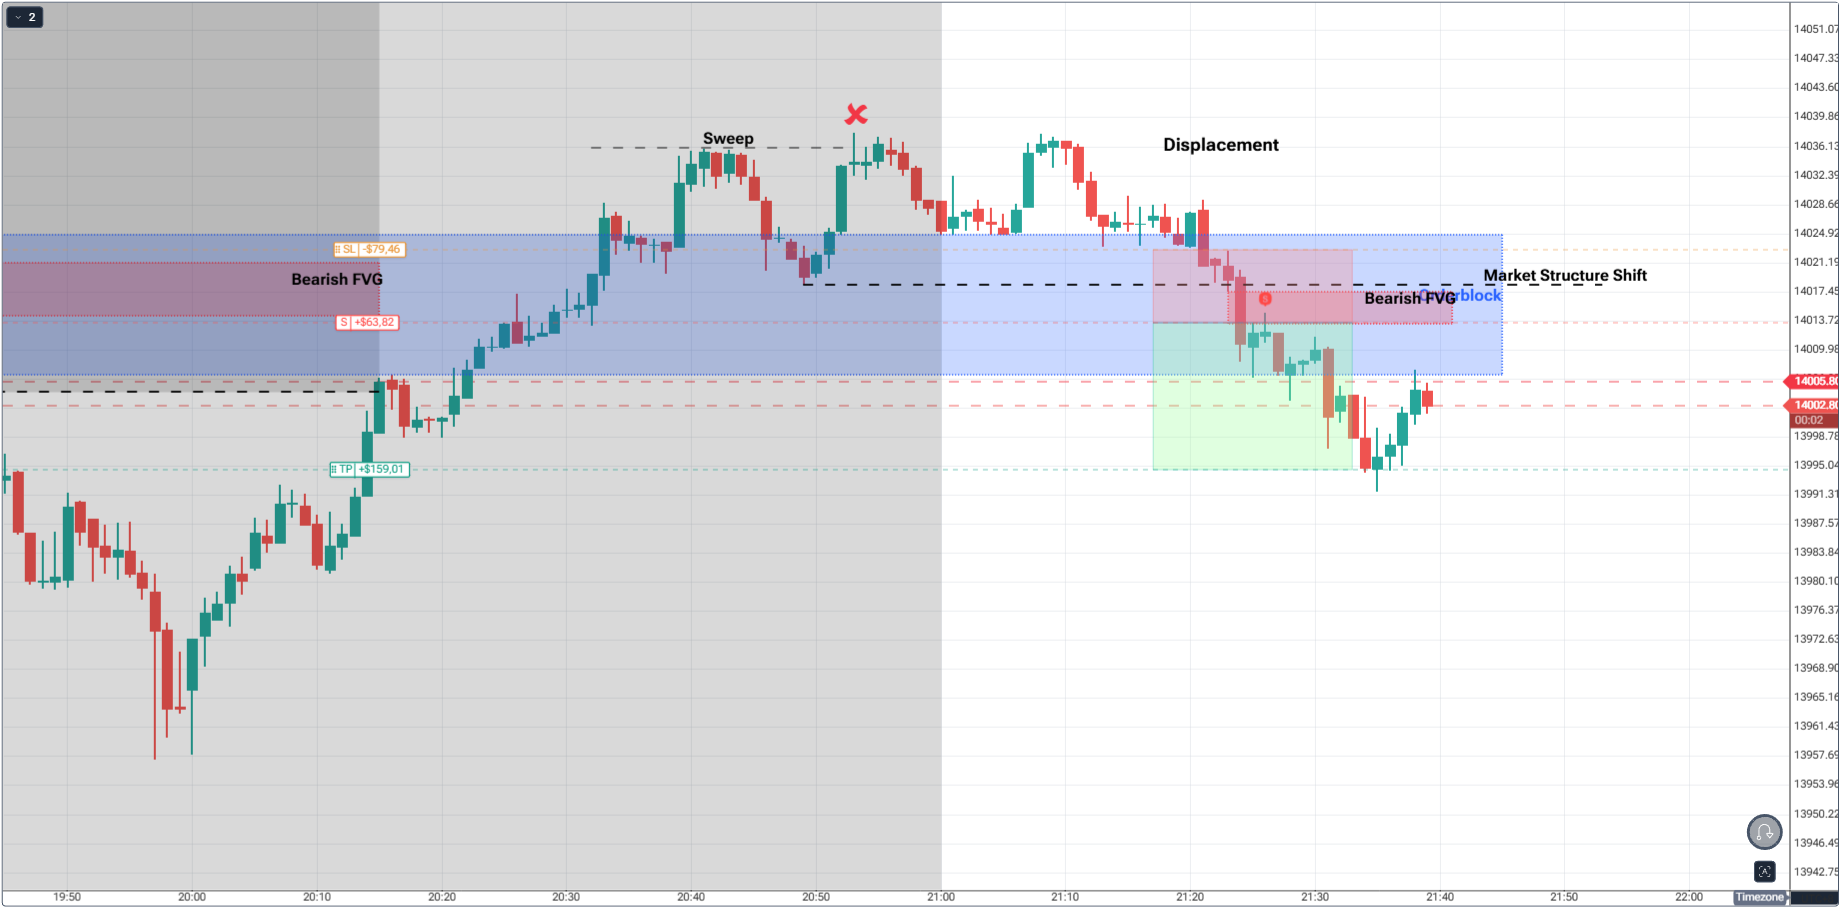
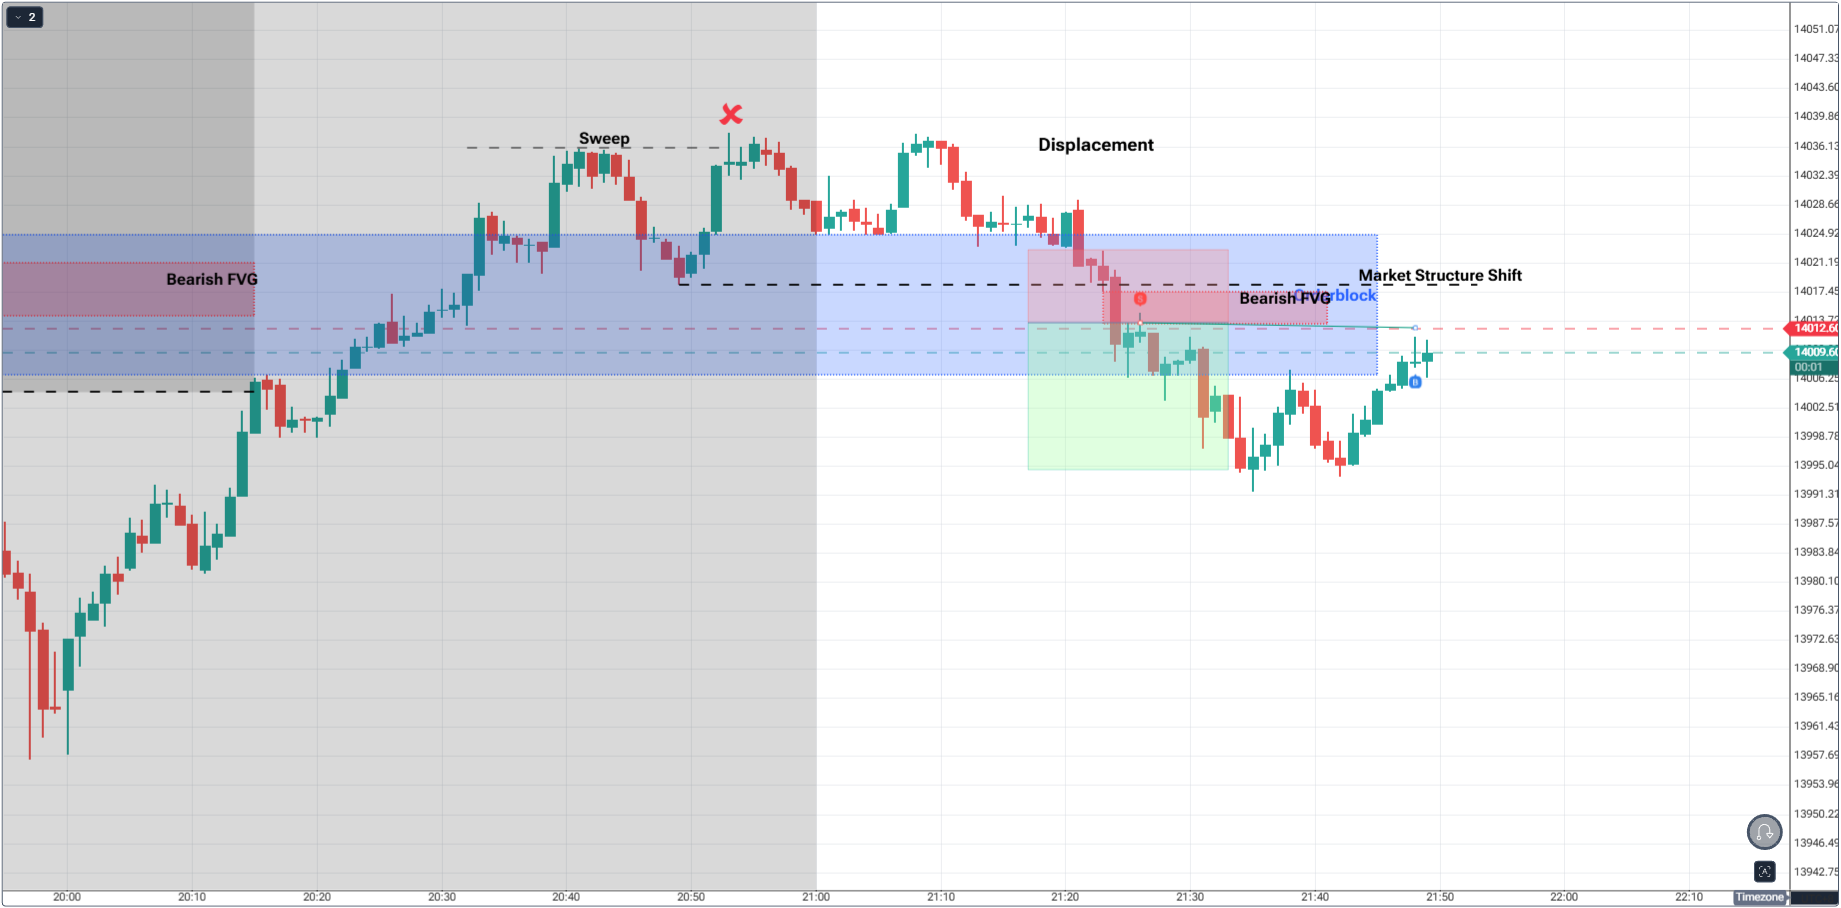
Repeat the previous steps but this time, we anticipate the sweep, market structure shift, and displacement at the open with new levels to look for a sweep.
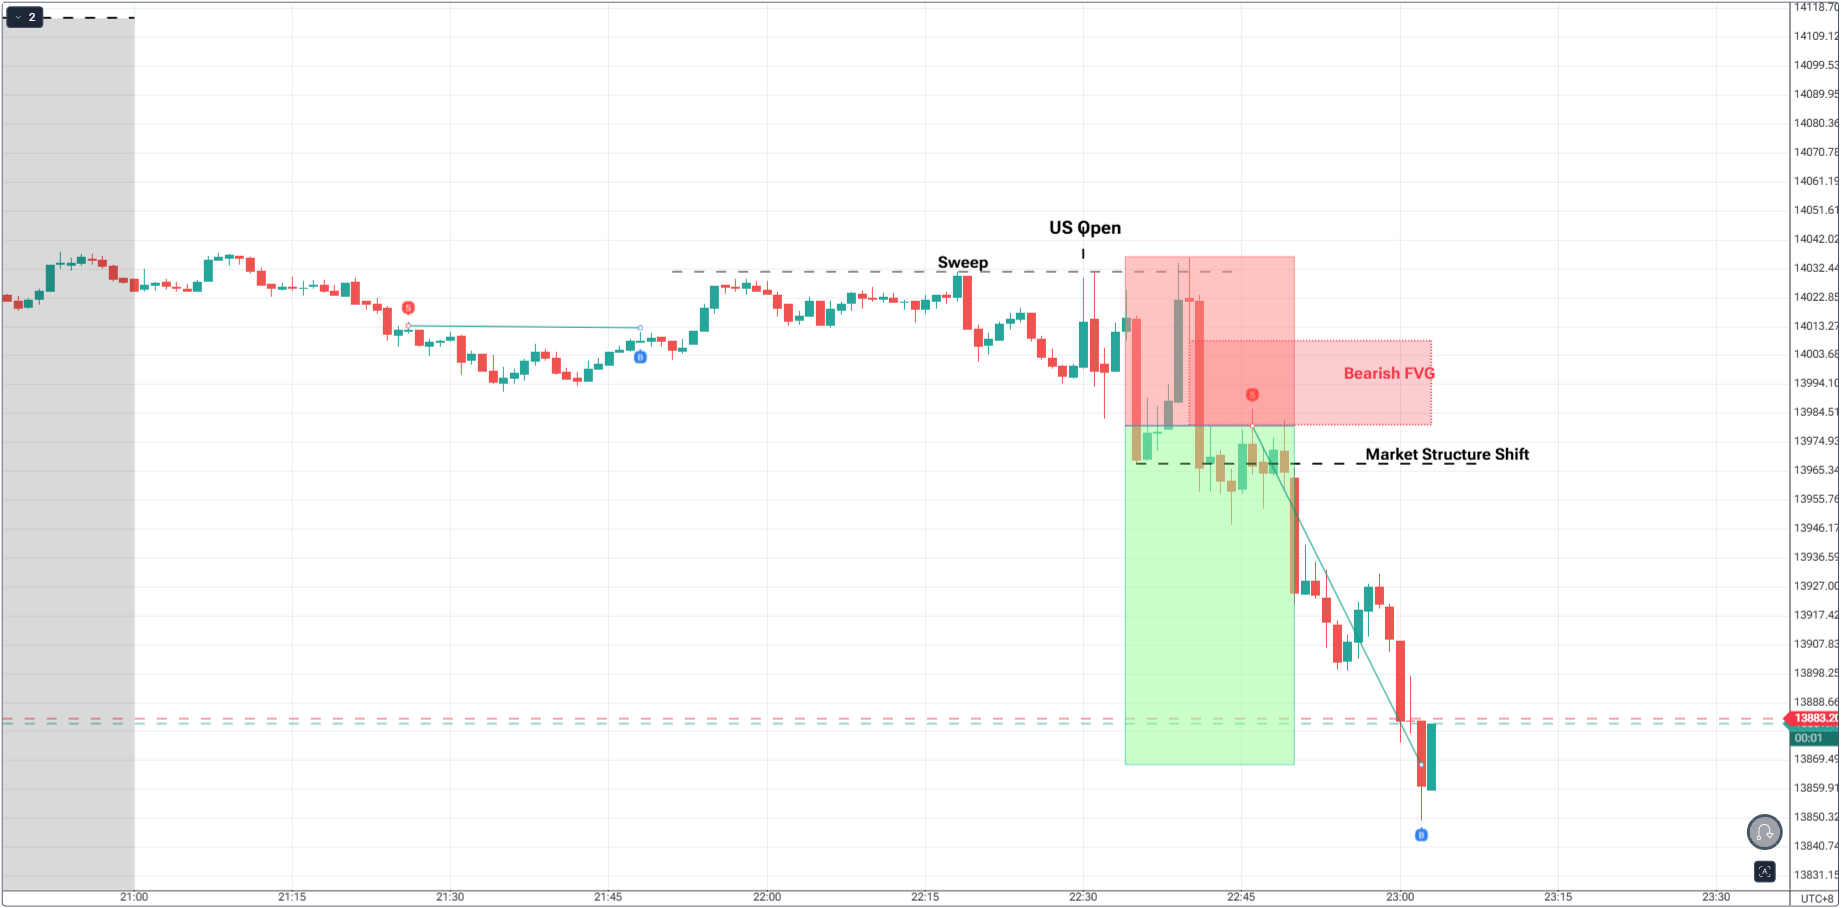
We had a better chance of trading here with liquidity as the spread here compared to our previous trade is thinner, which is a good market condition.

| Element | Question | Confirmation Signal |
|---|---|---|
| Higher TF | Is it aligned with the broader trend? | Directional confluence on H1 or Daily |
| Structure | Did the market shift intent? | Body-close break of key swing |
| Displacement | Was there power behind the move? | Impulsive candles, clean momentum |
| Volume | Did participation validate it? | Spike on impulse, lighter on pullback - cross-check futures |
| Liquidity | Was there a sweep before shift? | Obvious stops taken, then reversal intent |
| Return to Value | Did price retest the origin zone? | Entry from FVG or OB retrace |
| Session | Are you trading at a key session? | Cash open or session handoff provides confirmation |
Rule of thumb - 4 lights to act, 5 to size normally. If countertrend to Daily, demand an extra check.
Perfect setups aren’t hunted - they’re confirmed. An area of interest becomes a trade only when your matrix aligns - structure, power, participation, sweep, value, and the right session.
Let the session open be your truth serum. And when you do press the button, guard the idea with tight rules from Mastering Risk Management.
You’re not trading guesses anymore. You’re trading evidence, at the hour when the market is most honest.
It’s time to go from theory to execution - risk-free.
Create an Account. Start Your Free Demo!
Looking for step-by-step approaches you can plug straight into the charts? Start here:
Sharpen your edge with proven tools and frameworks:
News moves markets fast. Learn how to keep pace with SMC-based playbooks:
From NASDAQ opens to DAX trends, here’s how to approach indices like a pro:
Gold remains one of the most traded assets - here’s how to approach it with confidence:
Candlesticks are the building blocks of price action. Master the most powerful ones:
Ready to go intraday? Here’s how to build consistency step by step:
Markets swing between calm and chaos. Learn to read risk-on vs risk-off like a pro:
Step inside the playbook of institutional traders with SMC concepts explained:
Forex pairs aren’t created equal - some are stable, some are volatile, others tied to commodities or sessions.
If you’ve ever been stopped out right before the market reverses - this is why:
Mindset is the deciding factor between growth and blowups. Explore these essentials:
The real edge in trading isn’t strategy - it’s how you protect your capital:
If you’re not sure where to start, follow this roadmap:
This way, you’ll grow from foundation → application → mastery, instead of jumping around randomly.
Follow me for more daily market insights!
Jasper Osita - LinkedIn - FXStreet - YouTube
This content may have been written by a third party. ACY makes no representation or warranty and assumes no liability as to the accuracy or completeness of the information provided, nor any loss arising from any investment based on a recommendation, forecast or other information supplies by any third-party. This content is information only, and does not constitute financial, investment or other advice on which you can rely.
ACY Securities is one of Australia's fastest growing multi-asset online trading providers, offering ultra-low-cost trading, rock-solid execution, technologically superior account management and premium market analysis.
Select the categories and companies you wish to follow directly to your person rss feed.
Create Custom RSS FeedSign up and join over 5,000 professional members who receive personalized news alerts, curated professional connections, and more for free!
Retail futures trading leader NinjaTrader Group has appointed Mark Omens as Senior Vice President, Commercial Strategy, bringing a 25-year veteran of derivatives marketplace CME Group into a newly created role focused on exchange partnerships and enterprise growth.
Gold Price Action Forecast: Will XAU/USD Drop to $3930? Meta Description: Read our Gold price action forecast to see if XAU/USD will drop to $3930.
BitDelta Securities Financial Services LLC (“BitDelta Securities”) today announced that it has received full regulatory approval from the Capital Market Authority (“CMA”) of the United Arab Emirates under the Category 5 — Arrangement and Advice license framework (License No. 20200000439). The approval follows the firm's receipt of In-Principal Approval earlier this year and represents the successful conclusion of the CMA's full licensing process, including the satisfaction of capital requirements, governance appointments, and operational setup.
Crypto.com has received a $400 million strategic investment from Citadel Securities, valuing the firm at $20 billion. It marks the first institutional funding round in the company's history, aimed at accelerating its expansion into tokenised securities, derivatives and other asset classes.
WTI’s pullback into $79–82 is the first major test of the bullish Elliott Wave count, with buyers targeting a renewed break above $85.

BitDelta Securities has secured a full CMA Category 5 licence in the UAE and opened a regulated office in Business Bay, Dubai. The firm operates as an introducing broker, connecting investors with licensed international brokers across multiple asset classes, with CEO Dr. Demetrios Zamboglou commenting on the milestone.
Index volatility is asleep while single stocks fight it out underneath, credit refuses to confirm the equity rally, and a bare macro calendar hands next week to oil.
Digital assets and FX brokerage GC Exchange FZE (GCEX) has appointed Mohammed A. Mulla as a Board Member of its Dubai-based entity, part of the wider GCEX Group.
Learn what Blockchain-as-a-Service is, how it works, and why businesses are using BaaS to build blockchain applications without managing infrastructure.
CFDs vs stocks compared on leverage, ownership, costs, dividends, taxes, and risk. Learn the differences between stocks and CFDs and discover which suits your investing or trading goals.