just now


Liquidity Finder Ltd is incorporated in England and Wales, company number 10610740, registered address 167-169 Great Portland Street, Fifth Floor, London W1W 5PF, United Kingdom.
Published: just now
Every system works. The gaps between them are what is costing you.Ask most brokers how their technology is performing and the answer is usually positive. The trading platform is stable. The CRM manages leads. The IB portal tracks commissions. The risk dashboard shows positions. Nothing is broken.
And yet operations feel harder than they should. Reconciliation takes longer than expected. Client retention campaigns underperform. Partner commission disputes come up more often than they should. Bonus campaigns run over budget. A risk event arrives before the desk has time to respond properly. The month end finance report surfaces costs that were not visible during the month.
The systems themselves are not the problem. The gaps between them are. This article examines four specific areas where disconnected brokerage infrastructure creates compounding costs, and what it looks like when those connections are finally in place.
The Gap Between Your CRM and Your Trading Infrastructure
Your CRM knows a great deal about your clients. It knows when they registered, what documents they submitted, which campaigns they received, and what their support history looks like. What it almost certainly does not know is what they are trading right now, how their equity is performing this week, or what their risk profile looks like based on recent trading behaviour.
That information lives in your trading platform. And in most brokerages, the two systems do not communicate with each other automatically.
The commercial consequence of this is that the retention and reactivation work your team does is based on an incomplete picture. You might be sending a reactivation offer to a client who has open positions your CRM cannot see.
You might be missing the signal that a high value client is about to disengage because the trading data that would have flagged it lives somewhere your CRM team never looks.
You might be offering the same campaign to a client who is actively trading at high volume and one who has not logged in for sixty days, because the segmentation layer cannot distinguish between them without the trading data.
Client retention is one of the highest margin activities in a brokerage. The economics of keeping a good client are significantly better than the economics of acquiring a new one. A CRM that is structurally disconnected from trading reality cannot protect that margin effectively, regardless of how well the team uses it.
What Manual MAM and PAMM Operations Actually Cost
Managed account structures are operationally demanding in ways that are easy to underestimate when you are setting them up and expensive to discover once you are running them at scale.
When a portfolio manager runs a strategy across 40 sub accounts, every trade requires an allocation calculation. Lot sizes need to be split proportionally across accounts. Rounding differences create marginal discrepancies in entry prices and P&L between accounts.
Performance fees need to be calculated accurately and communicated transparently to investors. And when an investor disputes the high water mark calculation used to determine their fee, someone on your operations team needs to respond.
That response requires manually reconstructing the trade by trade P&L history for the account in question, producing documentation that demonstrates the fee calculation is correct, and managing the client relationship through what can be a weeks long process.
The direct cost in staff time is significant. The indirect cost in investor relationship damage and reputation within the money manager’s network is often larger.
This cost does not appear on your technology budget. It appears on your operational cost line, spread across staff time and occasionally direct compensation, where it is rarely attributed to the infrastructure gap that caused it. At a small scale it is manageable. At scale it becomes a structural drain on your operations team and a consistent source of investor attrition that compounds over time.
IB Commission Errors: Small Numbers, Large Consequences
Partners are acutely aware of what they are owed. An overpayment is a direct cost to the broker. An underpayment is a relationship problem, and relationship problems with your best introducing brokers tend to be disproportionately expensive relative to the actual amount involved.
A partner who believes they have been underpaid does not just raise the issue quietly. They raise it repeatedly, they raise it with other partners in their network, and they become less motivated to refer new clients while the issue is unresolved.
When IB commission structures become complex, as they always do as networks grow to include sub IBs, different rebate models for different partner tiers, and volume-based incentives that require accurate trade data to calculate correctly, manual calculation becomes unreliable.
The errors may not be large individually. But they are consistent enough that your partners notice them, and consistent enough that your finance team spends meaningful time investigating and correcting them every month.
The operational overhead of managing this manually does not scale. The work required to calculate, verify, and pay commissions accurately grows proportionally with the size of the partner network, unless the infrastructure handling those calculations is automated.
Bonus Campaign Costs That Appear After the Fact
A campaign launches on a Monday. The terms look reasonable: a deposit bonus with a minimum volume condition and a 30 day expiry. Marketing reviews registrations. Finance reviews costs at month end. In between those two data points, a great deal can go wrong without anyone noticing.
By the end of the first week, a group of accounts may already be meeting the volume condition through trades that generate minimal spread revenue for the broker.
Hedged positions. Minimum threshold activity designed to satisfy the technical condition without generating meaningful net exposure. The condition is technically met. The bonus becomes payable. The pattern repeats as more accounts follow the same approach.
Nobody identifies this during the campaign because the campaign platform knows about the registrations and the trading platform knows about the trades, but no one is watching both simultaneously with the ability to act on what they see together.
By the time the month-end finance review surfaces the cost, the campaign has been running for three or four weeks and the cumulative bonus liability has already accumulated significantly beyond what was projected.
The information needed to catch this pattern early has always been available in the trading data. It simply needs to be monitored in real time against the campaign terms, which requires the two systems to be connected in a way that prevents the gap from forming in the first place.
The Compounding Effect of Multiple Disconnections
Each of these four disconnections is manageable in isolation. A good operations team can absorb the friction of a CRM that does not connect to trading data. A careful finance function can catch commission errors before they become disputes.
An alert marketing team can review bonus campaign performance frequently enough to catch overruns early.
The problem is that these are not isolated. They compete simultaneously for the same operational capacity. The same ops team that is manually reconciling IB commissions this week is also handling the MAM dispute that arrived yesterday and trying to understand why last month’s retention campaign underperformed.
The dealing desk that is manually adjusting margin settings during a market move is also monitoring copy trade exposure and responding to risk alerts from a system that is one step behind reality.
The result is not one large, visible problem. It is many small, persistent ones that collectively limit what the team can accomplish and what the business can grow into.
Connecting the systems does not solve every operational challenge. But it removes the structural friction that makes every challenge harder to manage than it needs to be.
What Brokers Are Experiencing When They Connect These Systems
The brokers who have moved from a fragmented stack to a connected operational environment describe consistent early changes. The operations team stops spending significant time on reconciliation and starts spending it on decisions that require judgment.
Partner relationships improve because commissions are accurate, transparent, and paid on time. Retention campaigns perform better because they are informed by actual client trading behaviour rather than registration data alone. Bonus campaign costs become predictable because the monitoring is continuous rather than periodic.
Over twelve months they compound into a measurably more efficient operation, stronger margins on the same revenue base, and the operational foundation to scale the business without the overhead growing at the same rate.
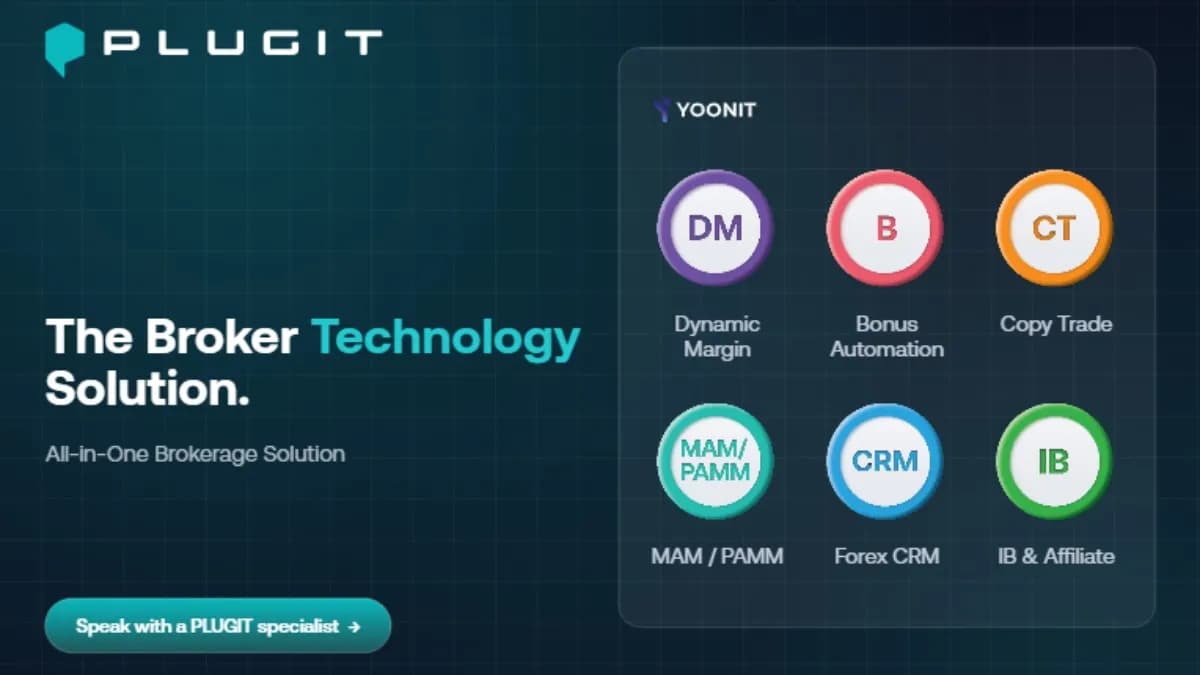
If the patterns described in this article are familiar from your own operations, the PLUGIT team would like to show you how YOONIT Trading Solution looks like for your specific setup.
We have worked with brokers of all sizes to identify the specific disconnections limiting performance and design the right operational solution. The conversation is practical, direct, and without obligation.
👉 Speak with a PLUGIT specialist.
📞 +35725025026
Select the categories and companies you wish to follow directly to your person rss feed.
Create Custom RSS FeedSign up and join over 5,000 professional members who receive personalized news alerts, curated professional connections, and more for free!
WTI crude oil price forecast: A confirmed breakout above $94.765 could open the way toward $100.305, while weekly support remains at $87.360–$90.830.
NAS100 price forecast recap: Explore the Nasdaq 100 rally to 31,401.3, with technical analysis of the breakout and key support and resistance levels.
Learn how to identify, draw and trade XAUUSD supply and demand zones using Gold market structure, price action confirmation and clear risk management.
cTrader has been named Best Trading Platform at UF Awards APAC 2026 during iFX EXPO Asia in Hong Kong.
AUD/CHF reached last week’s 0.57732 bearish target. Learn how resistance, market structure and a neckline retest shaped the original price action forecast.
Businesses eventually reach a point where basic tools are not enough basic tools.
Multi-asset trading broker AvaTrade has agreed to acquire the majority of FXCM Group’s business and brand, in a transaction that would bring a longstanding retail FX franchise into the AvaTrade Group.
LSEG and CMC Markets have signed a multi-year strategic data agreement expanding CMC's access to LSEG's real-time and delayed pricing, reference and corporate actions data, news and analytics, plus AI-ready content, to support new products, entry into new markets and the growth of CMC's institutional and B2B partnerships.
The Tel Aviv Stock Exchange is considering a bid for the Cyprus Stock Exchange, with Israeli media citing its EU licence, trading platform and clearing house. Euronext’s Athens exchange and India’s National Stock Exchange are also seen as contenders, and Cyprus aims to sign a sale agreement by the end of this year.
CME Group will launch baseball futures on 12 October, pending regulatory review, tracking CME FutureSports Performance Indexes built on Official League Data. Standard and micro contracts will start with the 2026 Postseason and the four clubs in the League Championship Series, trading around the clock.