just now
Liquidity Finder Ltd is incorporated in England and Wales, company number 10610740, registered address 167-169 Great Portland Street, Fifth Floor, London W1W 5PF, United Kingdom.
Published: just now

When you strip away the colors, tools, and fancy indicators, every chart still speaks one language: price action. Before you try to forecast the next swing, train your eyes to listen to what price already said-through swings, highs/lows, and structure. If you want a gentle step-in to this world, start with the series intro and market groundwork you’ve covered-your Introduction to Swing Trading and Market Basics for Swing Trading-so today’s lesson slots into a clean mental model.

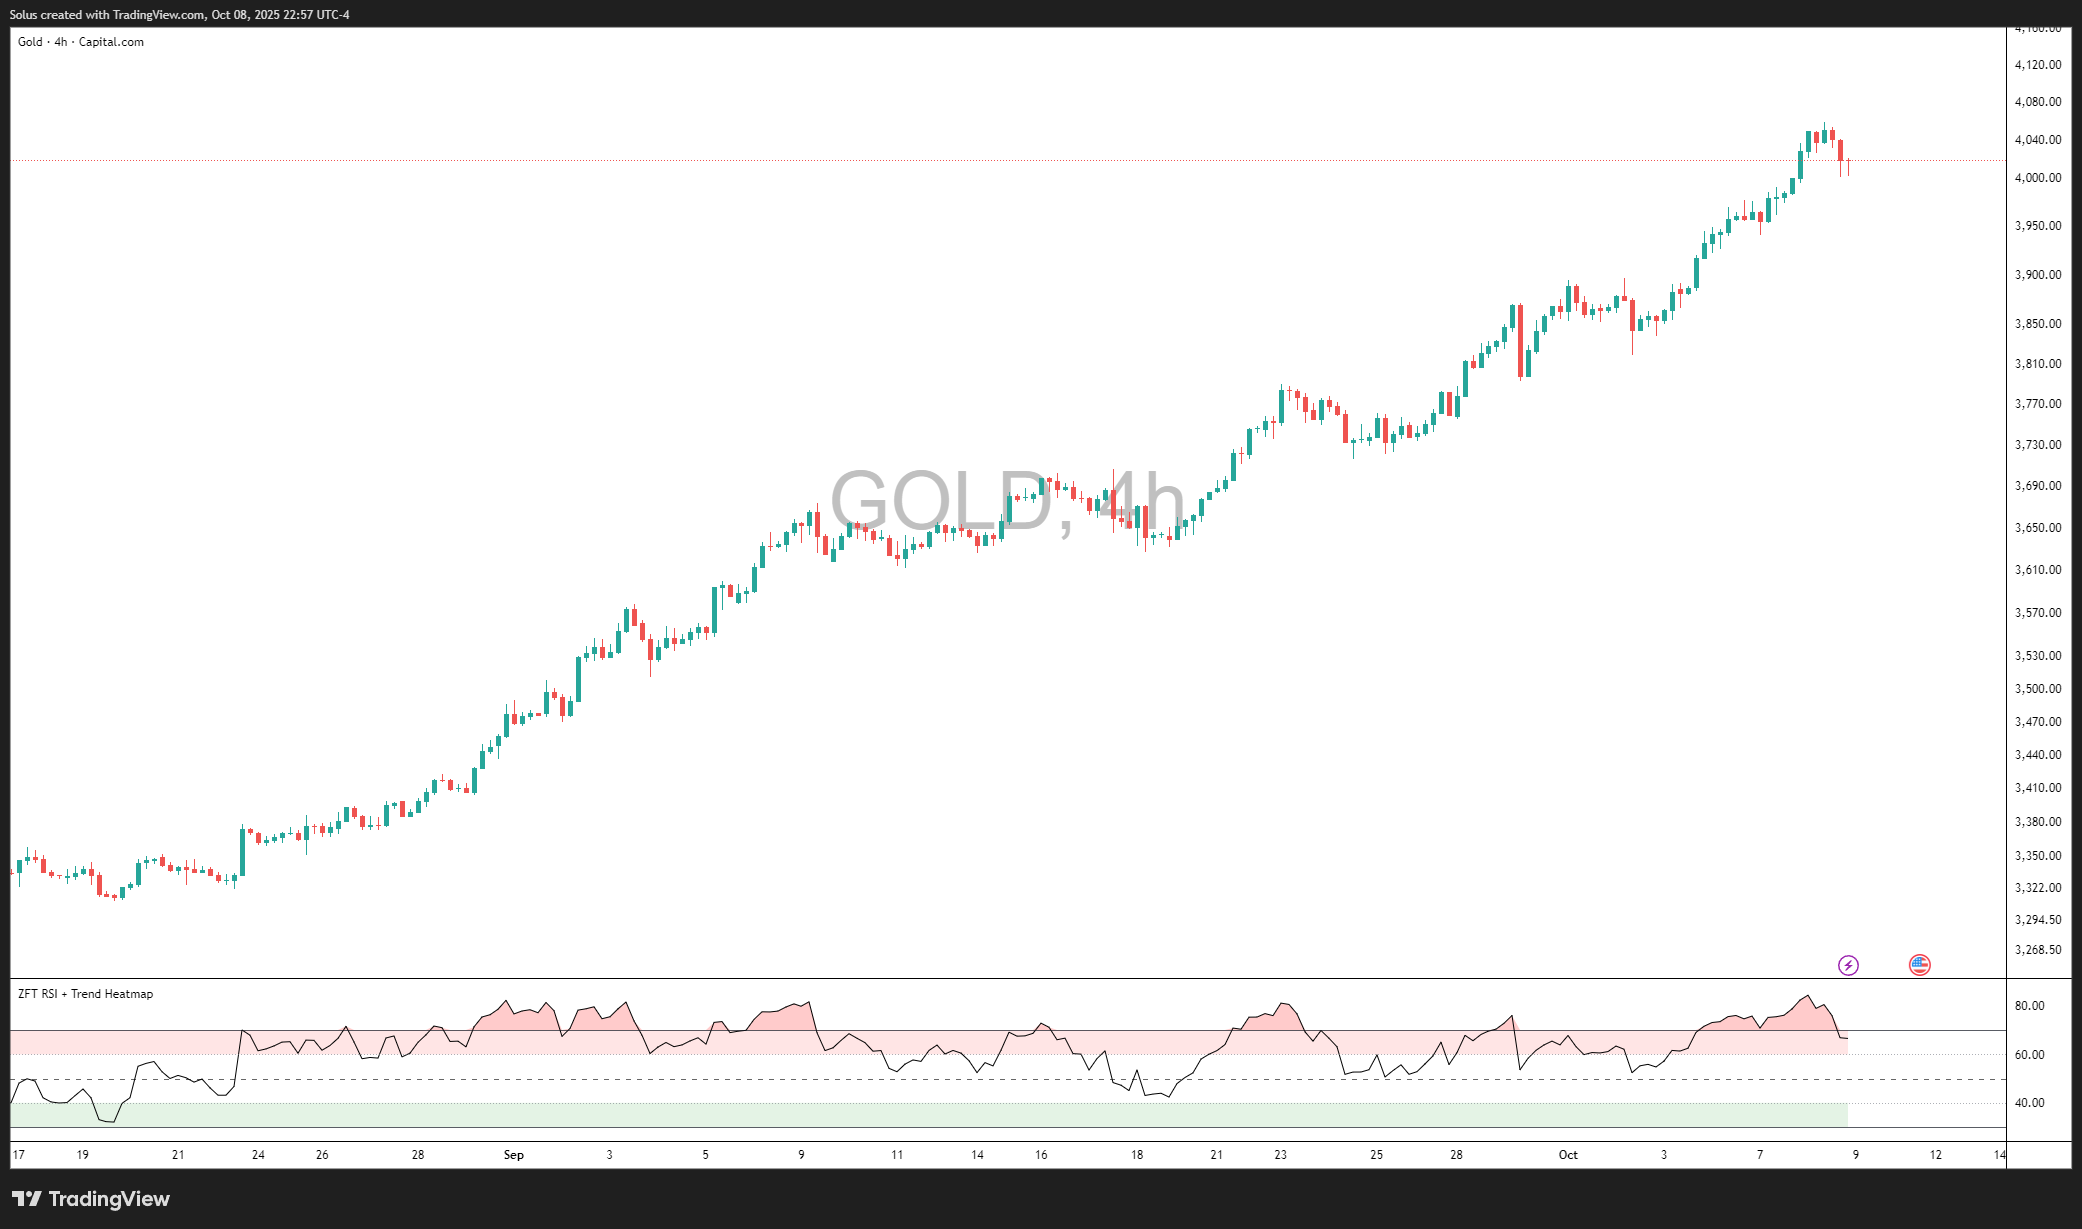
Price moves in impulses and corrections. In an uptrend, you’ll see HH/HL; in a downtrend, LH/LL-that’s your market structure. Your job isn’t to chase every wiggle; it’s to read where displacement began, where liquidity was taken, and where structure shifts. If the “why” behind these moves intrigues you, the SMC foundation pieces-like Why Smart Money Concepts Work and Fair Value Gaps Explained-help you see how institutions leave footprints you can actually trade.
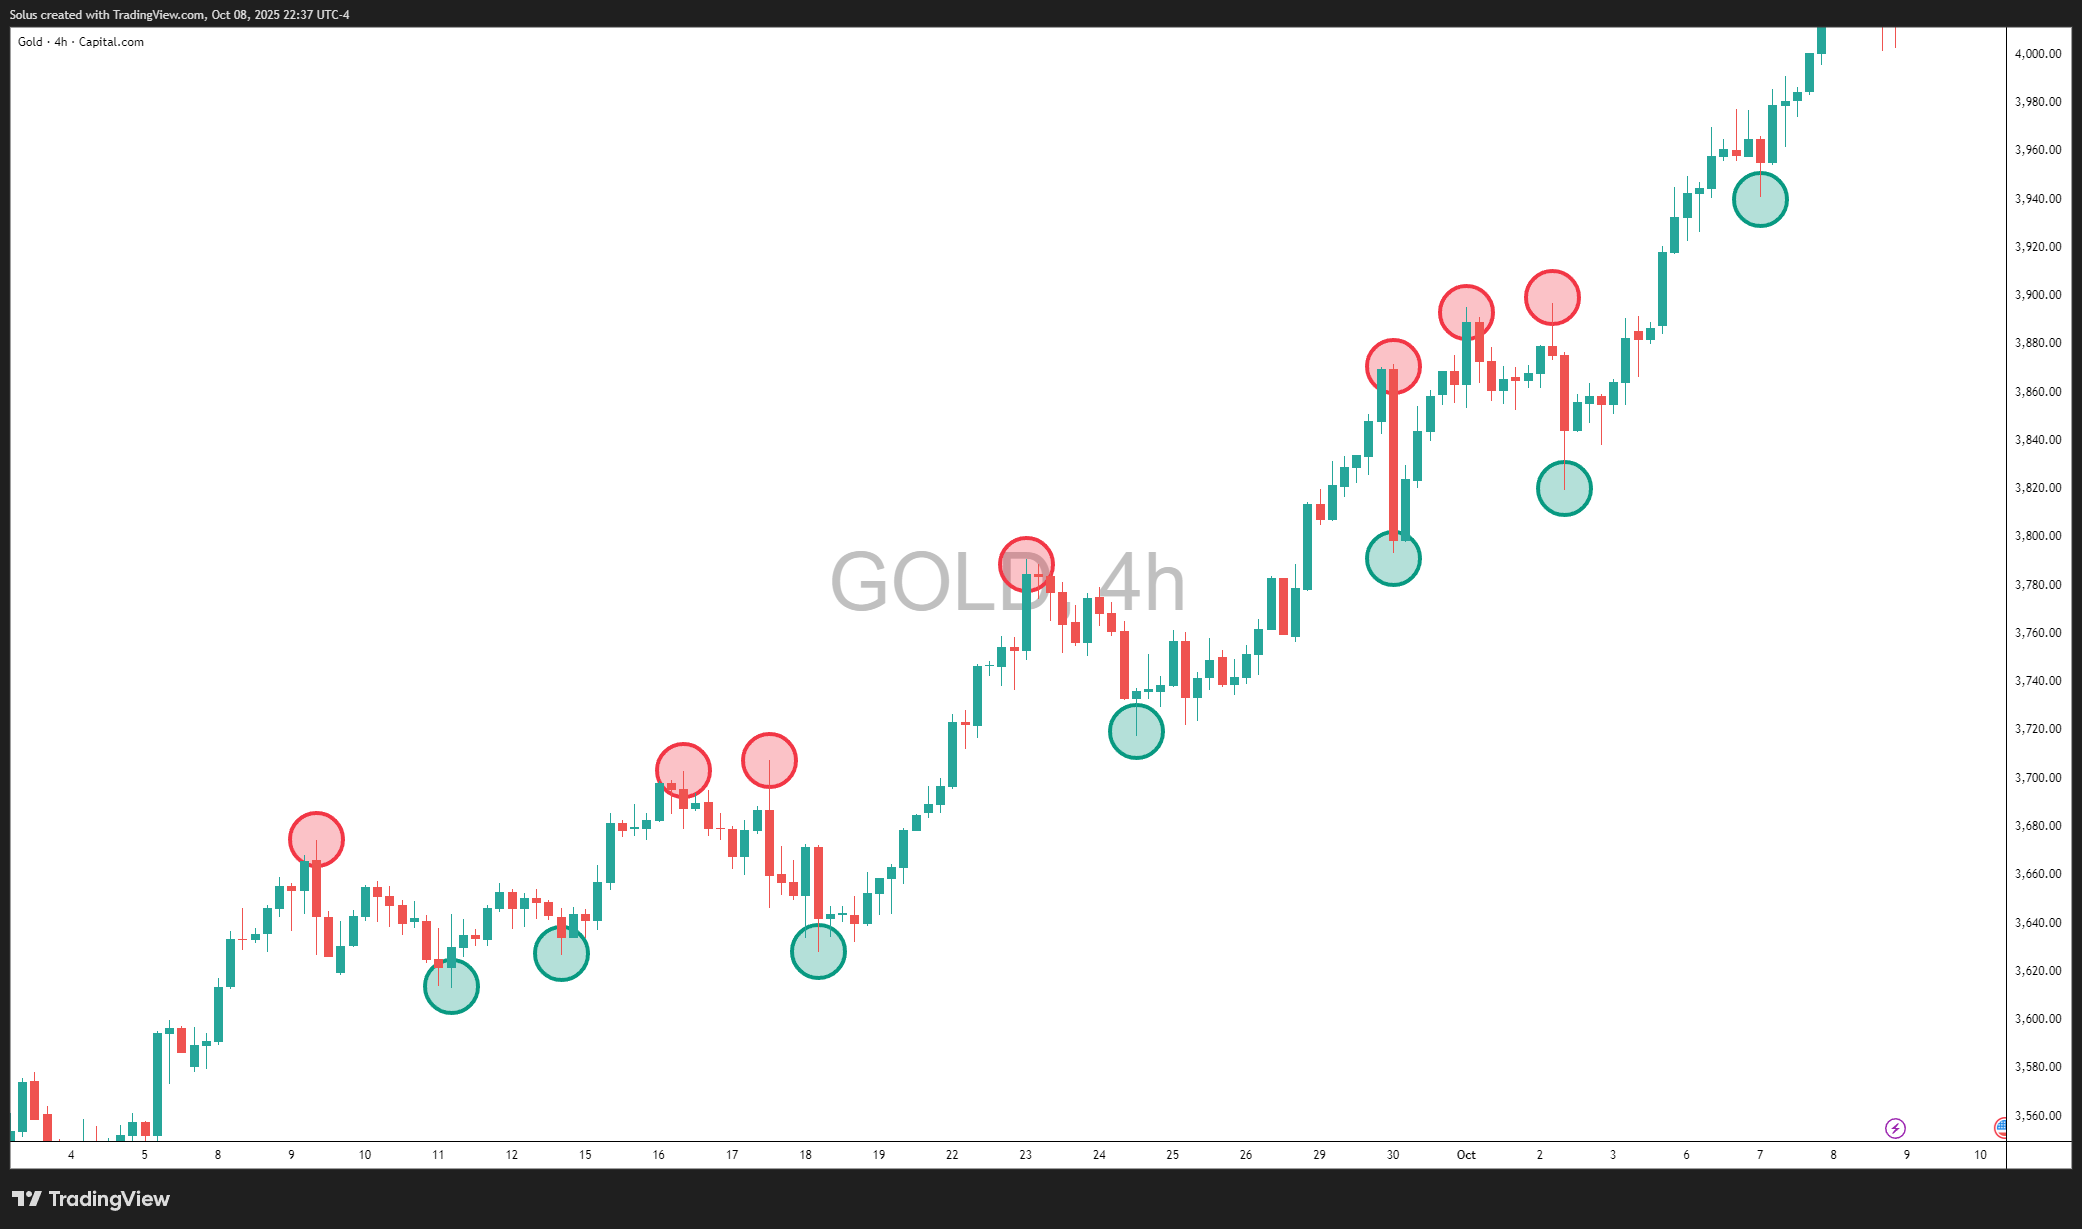
In the Gold 4H chart above, notice how each green circle marks a higher low and each red circle marks a higher high. This rhythmic pattern is what defines an uptrend - buyers consistently defending higher levels while pushing price to new peaks. When this pattern breaks (for example, a higher low fails to hold), it signals that the market may be transitioning or taking a breather.
Your job isn’t to chase every wiggle; it’s to read where displacement began, where liquidity was taken, and where structure shifts. These turning points often reveal institutional footprints - areas where smart money entered or exited positions.
If the “why” behind these moves intrigues you, the SMC foundation pieces - like Why Smart Money Concepts Work and Fair Value Gaps Explained - show how these structural shifts align with liquidity engineering.
And if you’re just starting out, reinforce this visual learning with Forex Trading Strategy for Beginners, which translates this price rhythm into clear entry, stop, and take-profit logic.
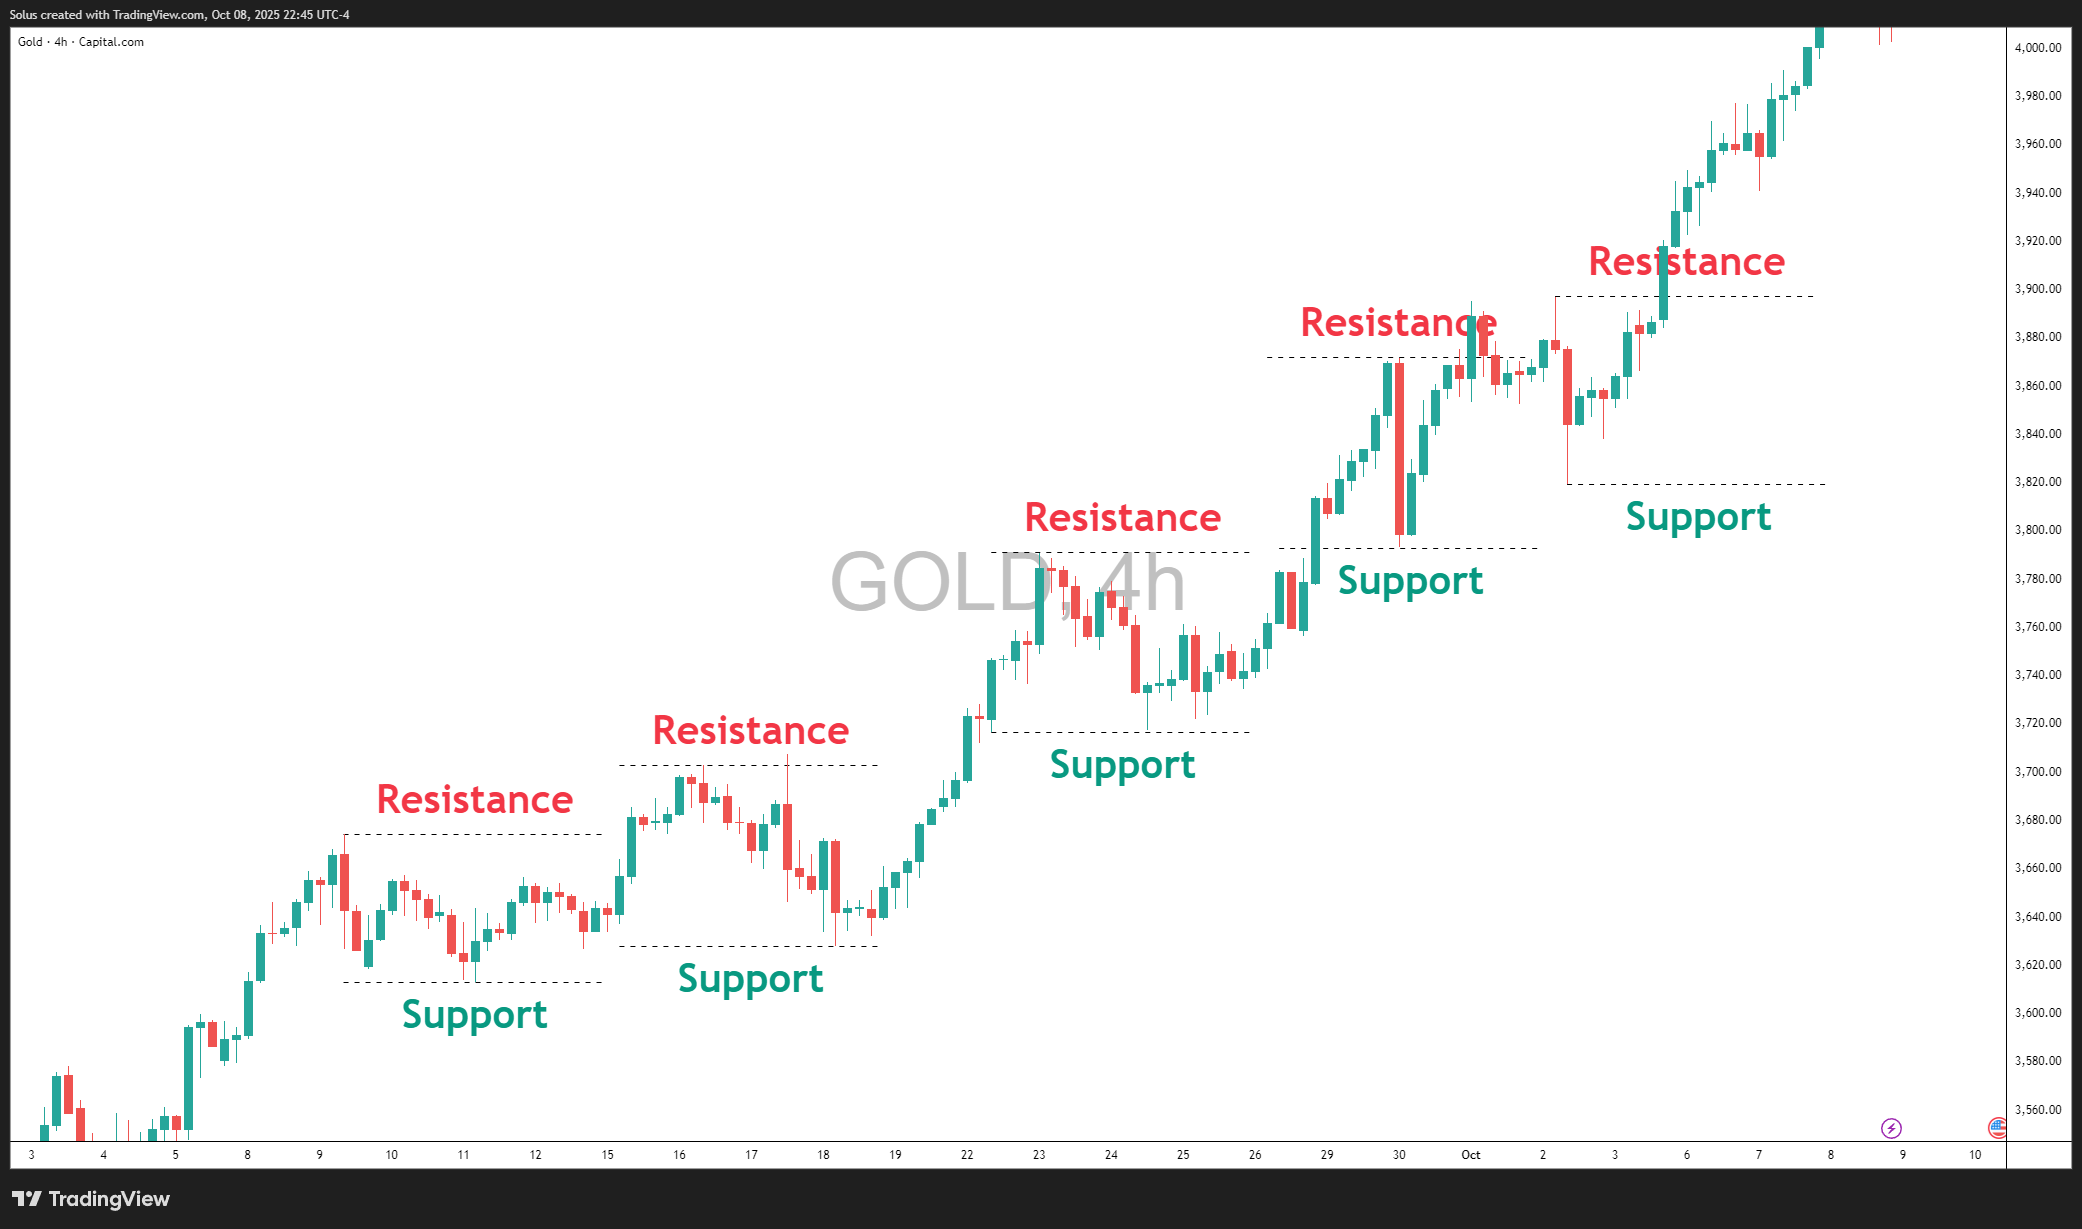
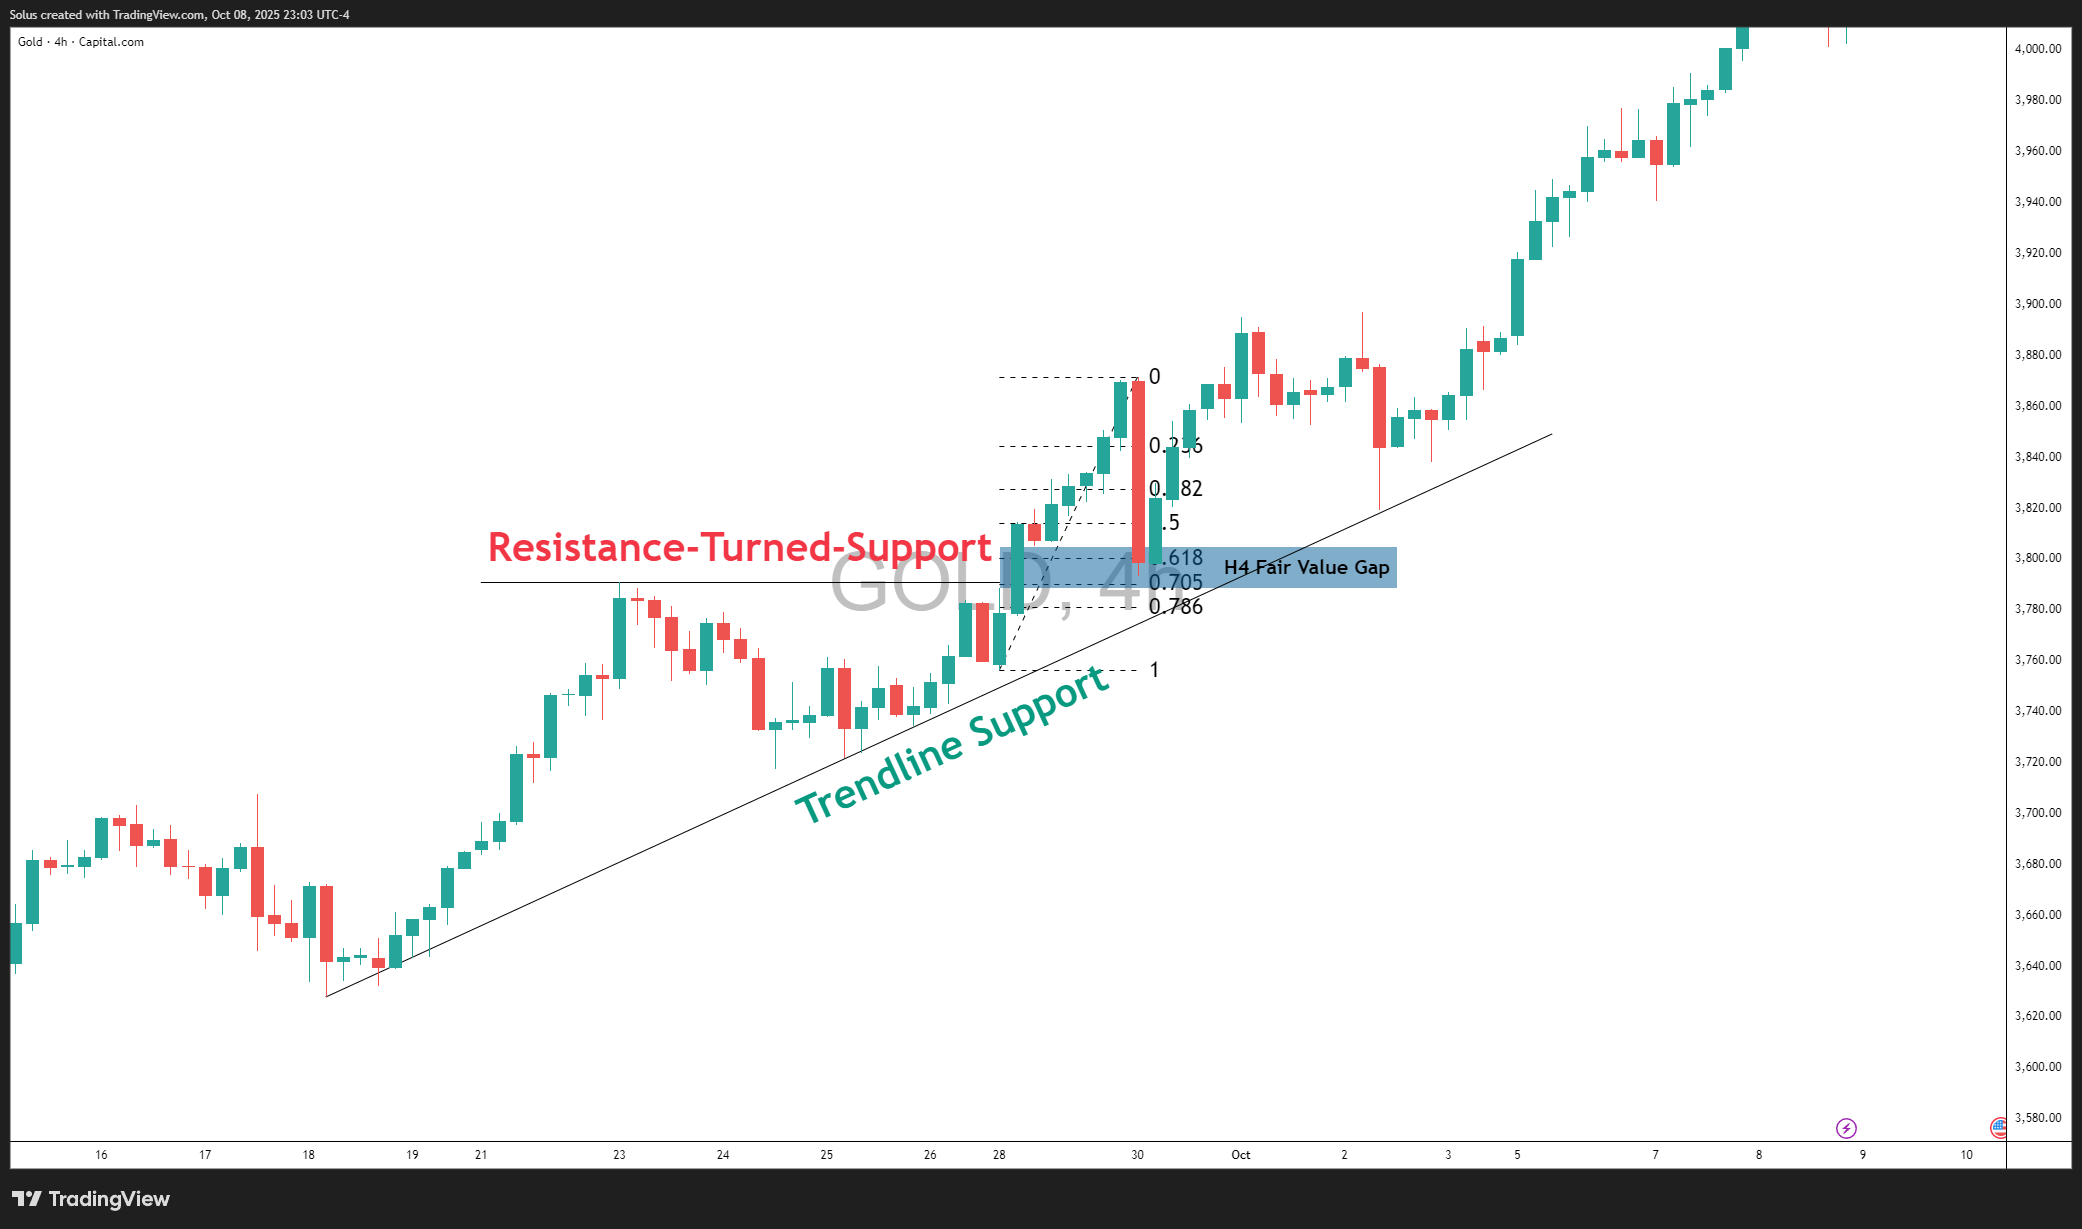
The chart above (Gold 4H) perfectly illustrates how support and resistance form the backbone of technical structure.
Each time price rallies into a ceiling and stalls, we mark that level as resistance. When price later breaks above it and retests from above, it transforms into support - a concept known as role reversal.
Notice how gold respects this rhythm. Every breakout to a new high eventually finds its footing on the previous resistance, confirming that buyers are defending prior battle zones. These recurring reactions are what we call memory zones - areas where liquidity previously exchanged hands.
For example, when price broke above the mid-$3,700 resistance, it later came back to retest that same area before launching again toward $3,900+. This behavior shows institutional footprints - where large players defend their earlier positions.
To dive deeper into setups like these, study Mastering Price Action at Key Levels - which explains how to identify high-probability zones - and Mastering Retests, which breaks down the psychology of entering after confirmation instead of impulsively chasing breakouts.
Swing traders who align these levels with key sessions often find cleaner and more predictable entries. For instance, the New York Session SMC Guide shows how liquidity tends to interact with support and resistance during high-volume windows - when smart money is most active.

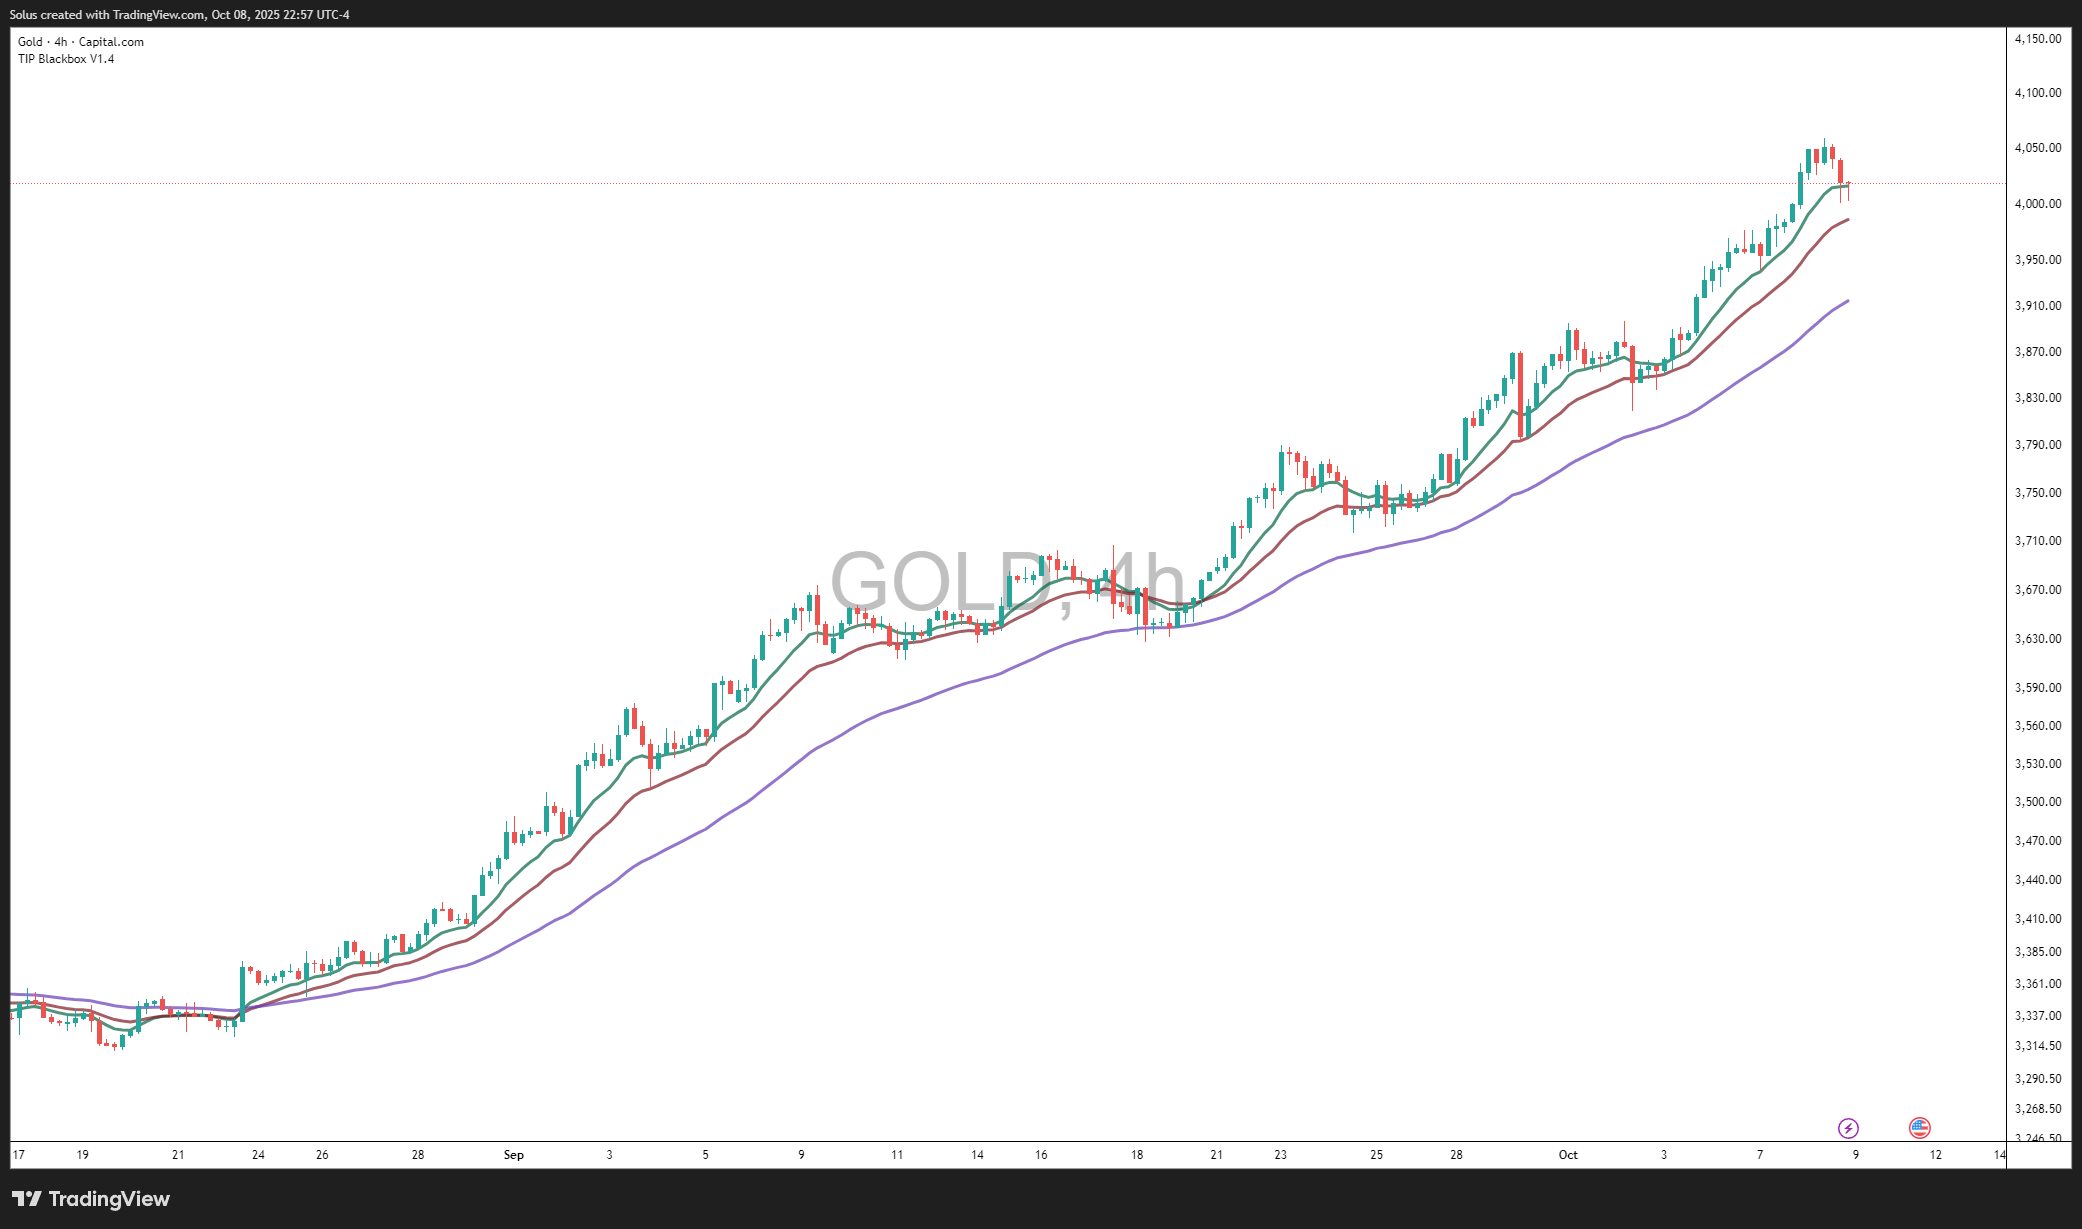
A trendline connects swing lows in uptrends (or highs in downtrends). Duplicate it to the opposite side to form a channel-your visual corridor of movement. When price accelerates outside the channel with displacement, you may be seeing a new phase unfold. If you prefer a momentum-first view of those phases, the Moving Averages Playbook shows how EMAs can frame the same structure without replacing it.
And if you trade indices where rhythm changes quickly at the open, blend channels with the Indices-at-the-open SMC guide so your line work respects the real drivers of early volatility.
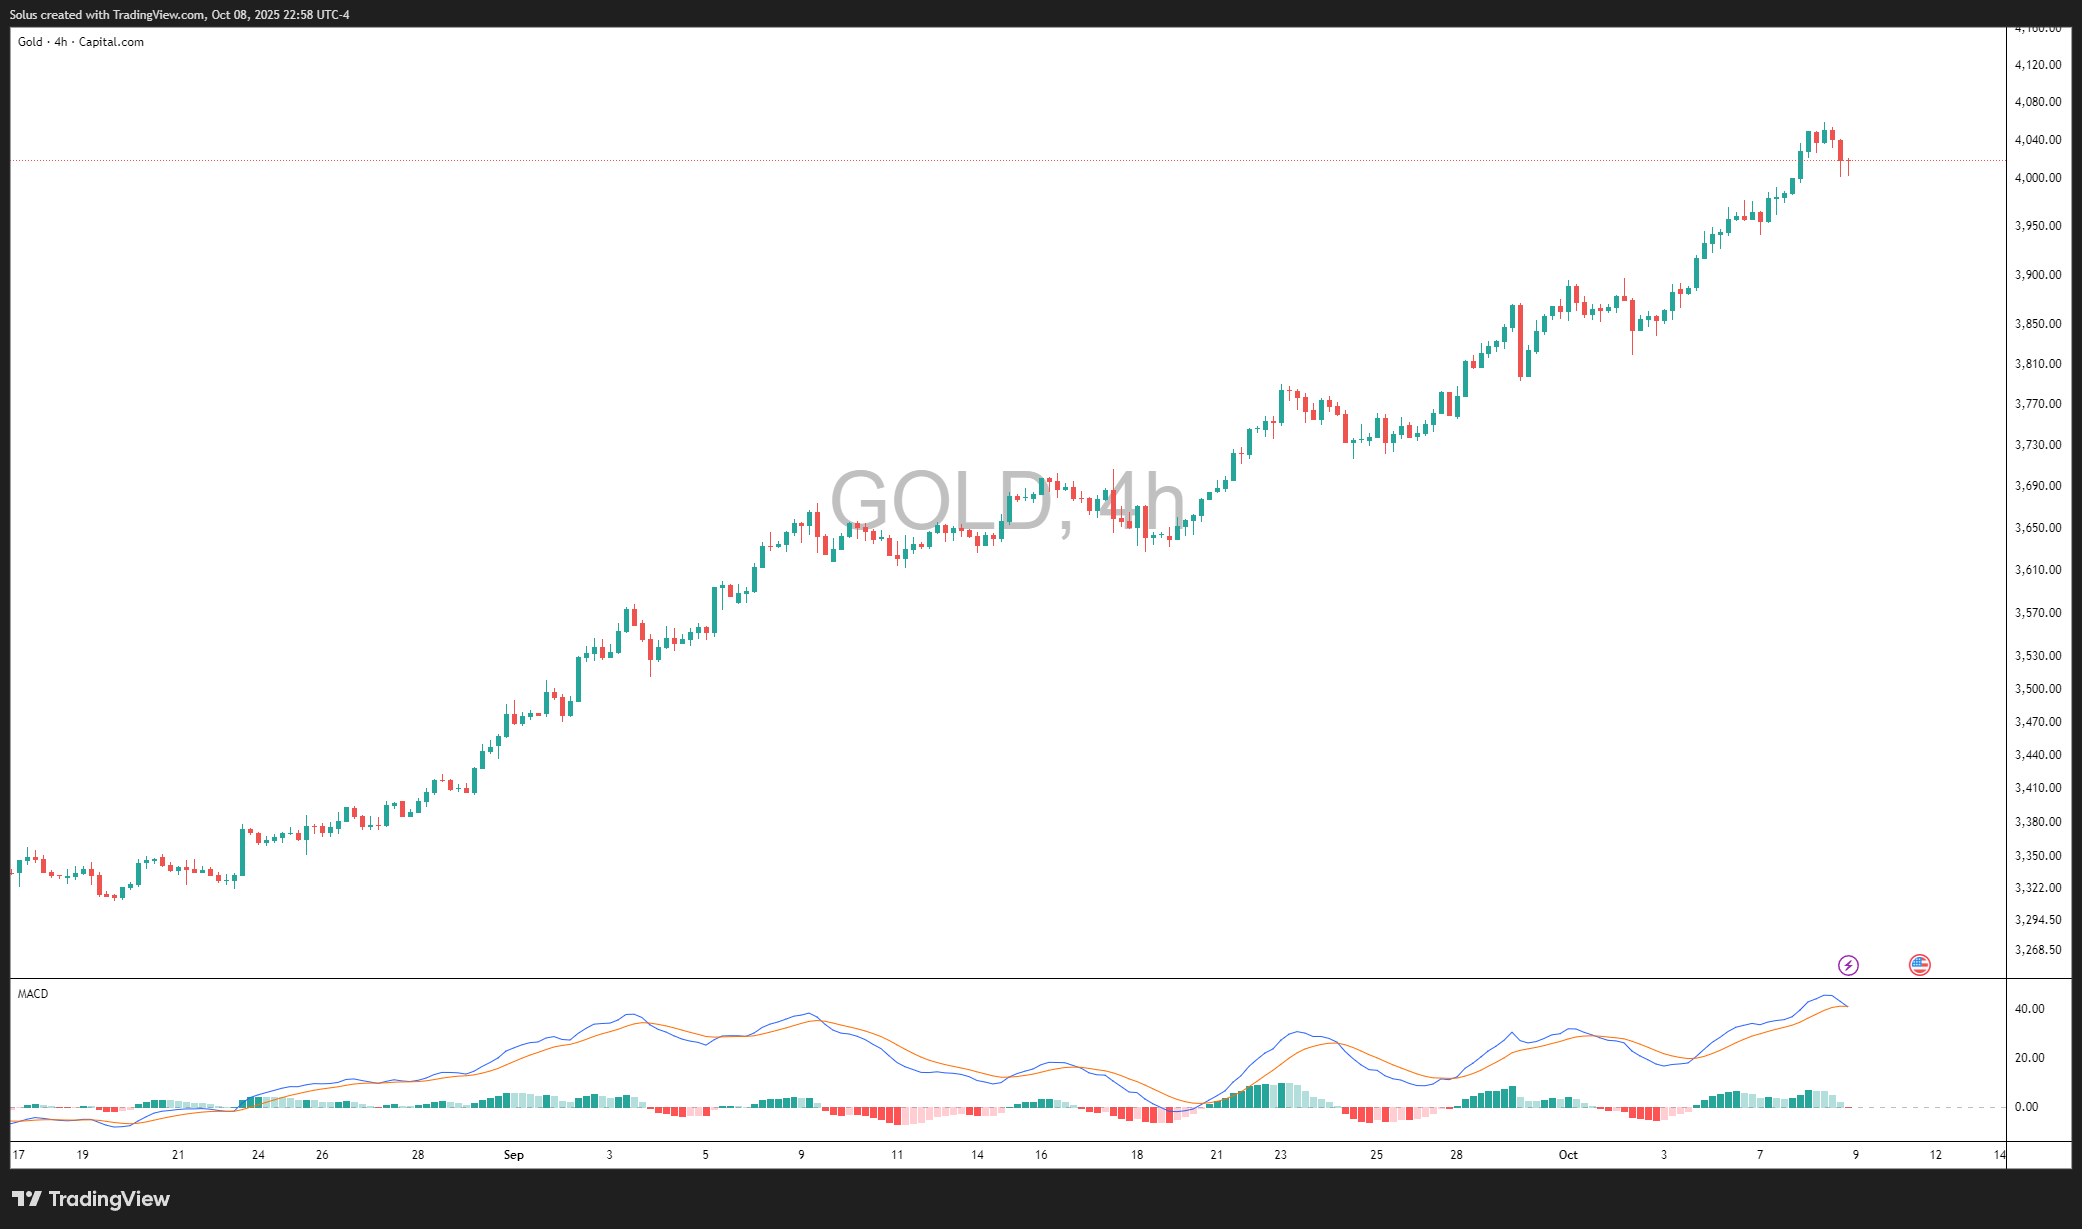
Indicators are derivatives of price. They’re best for context, not commands.
If you like confluence-heavy exits, How to Use Fibonacci to Set Targets & Stops plus EMAs/RSI gives you mechanical landmarks without losing sight of the story price tells. And when the market is news-charged, layer that with How to Trade CPI Like Smart Money to avoid false reads during data spikes.

Indicators lag. They confirm what already happened. Price-especially when read with liquidity and order-flow context-shows what’s happening now. If you’ve ever been wicked out before a move you “knew” was coming, study Stop Hunting 101 and the follow-ups on lessening stop-hunt risk and the psychology behind traps-you’ll start seeing why “naked” charts often feel more honest.
If you want a structured mental model for this thinking style, read How to Think Like a Price Action Trader so your decisions anchor to narrative first, tools second.
Great trades cluster around agreement: higher-timeframe bias, key level, trendline/channel touch, plus momentum context. One practical recipe: align MTF bias with Power of Multi-Timeframe Analysis in SMC, build your level plan with Price Action at Key Levels, then time confirmation with Retests or RSI divergence. If you’re trading Gold, wire that plan to the asset’s character with How to Swing Trade Gold Using SMC or the Complete Day Trading Gold Guide.

Indicators are sheet music-they give rhythm and timing-but the performance lives in the feel. A seasoned trader, like a pianist, senses when to pause, emphasize, or let a phrase breathe. If you relate to this, the mindset layer in Mastering Fibonacci Trading Psychology pairs beautifully with the technicals so your execution stays composed when price “changes tempo.”
No technical foundation survives poor risk. Keep your sizing, stops, and daily loss limits in check with Mastering Risk Management, then build a durable plan via Why Risk Management Is the Only Edge That Lasts and How Much Should You Risk per Trade?. When volatility spikes around macro events, stay systematic with Why SMC Works in News-Driven Markets and the NFP/CPI playbooks.
Indicators help you see. Price action helps you understand.
Support/resistance are landmarks; trendlines and EMAs are roads; market structure is the map. When you learn to read liquidity, timing, and context, you stop chasing signals and start letting high-quality setups come to you.
If you want to practice this without overcomplicating, try a focused path: review Core Principles of Swing Trading, then drill entries with How to Trade Breakouts Effectively and Mastering Retests-you’ll feel the edge compound.
It’s time to go from theory to execution - risk-free.
Create an Account. Start Your Free Demo!
Looking for step-by-step approaches you can plug straight into the charts? Start here:
Sharpen your edge with proven tools and frameworks:
News moves markets fast. Learn how to keep pace with SMC-based playbooks:
From NASDAQ opens to DAX trends, here’s how to approach indices like a pro:
Gold remains one of the most traded assets - - here’s how to approach it with confidence:
Candlesticks are the building blocks of price action. Master the most powerful ones:
Ready to go intraday? Here’s how to build consistency step by step:
Markets swing between calm and chaos. Learn to read risk-on vs risk-off like a pro:
Step inside the playbook of institutional traders with SMC concepts explained:
Forex pairs aren’t created equal - - some are stable, some are volatile, others tied to commodities or sessions.
If you’ve ever been stopped out right before the market reverses - - this is why:
Mindset is the deciding factor between growth and blowups. Explore these essentials:
The real edge in trading isn’t strategy - it’s how you protect your capital:
If you’re not sure where to start, follow this roadmap:
This way, you’ll grow from foundation → application → mastery, instead of jumping around randomly.
Follow me for more daily market insights!
Jasper Osita - LinkedIn - FXStreet - YouTube
This content may have been written by a third party. ACY makes no representation or warranty and assumes no liability as to the accuracy or completeness of the information provided, nor any loss arising from any investment based on a recommendation, forecast or other information supplies by any third-party. This content is information only, and does not constitute financial, investment or other advice on which you can rely.
ACY Securities is one of Australia's fastest growing multi-asset online trading providers, offering ultra-low-cost trading, rock-solid execution, technologically superior account management and premium market analysis.
Select the categories and companies you wish to follow directly to your person rss feed.
Create Custom RSS FeedSign up and join over 5,000 professional members who receive personalized news alerts, curated professional connections, and more for free!
Sterling steadies after political uncertainty rattled gilt markets, while EUR/USD and EUR/GBP approach key technical levels ahead of today's European session.
GBP/AUD remains trapped in a well-defined bearish trend on both the weekly and daily timeframes.
Discover the key drivers, technical levels, and central bank expectations shaping the EUR/USD trend as the ECB prepares to hold rates and markets watch for a potential breakout.
Sydney-based multi-asset broker ACY Securities has introduced PAXGUSD, a new CFD instrument that allows clients to trade tokenised gold against the US Dollar 24 hours a day, seven days a week. The instrument is available across MetaTrader 4, MetaTrader 5, and the ACY Trading Platform.
Binance has lowered its VIP 3 Wallet Assets threshold from $3 million to $1 million and will now count OTC Spot Trading Volume at a 4x multiplier toward VIP qualification, removing the previous VIP 4 cap and allowing eligible users to progress through the full tier framework up to VIP 9.
Retail futures trading leader NinjaTrader Group has appointed Mark Omens as Senior Vice President, Commercial Strategy, bringing a 25-year veteran of derivatives marketplace CME Group into a newly created role focused on exchange partnerships and enterprise growth.
Gold Price Action Forecast: Will XAU/USD Drop to $3930? Meta Description: Read our Gold price action forecast to see if XAU/USD will drop to $3930.
BitDelta Securities Financial Services LLC (“BitDelta Securities”) today announced that it has received full regulatory approval from the Capital Market Authority (“CMA”) of the United Arab Emirates under the Category 5 — Arrangement and Advice license framework (License No. 20200000439). The approval follows the firm's receipt of In-Principal Approval earlier this year and represents the successful conclusion of the CMA's full licensing process, including the satisfaction of capital requirements, governance appointments, and operational setup.
Crypto.com has received a $400 million strategic investment from Citadel Securities, valuing the firm at $20 billion. It marks the first institutional funding round in the company's history, aimed at accelerating its expansion into tokenised securities, derivatives and other asset classes.
WTI’s pullback into $79–82 is the first major test of the bullish Elliott Wave count, with buyers targeting a renewed break above $85.


