just now


Liquidity Finder Ltd is incorporated in England and Wales, company number 10610740, registered address 167-169 Great Portland Street, Fifth Floor, London W1W 5PF, United Kingdom.
Published: just now
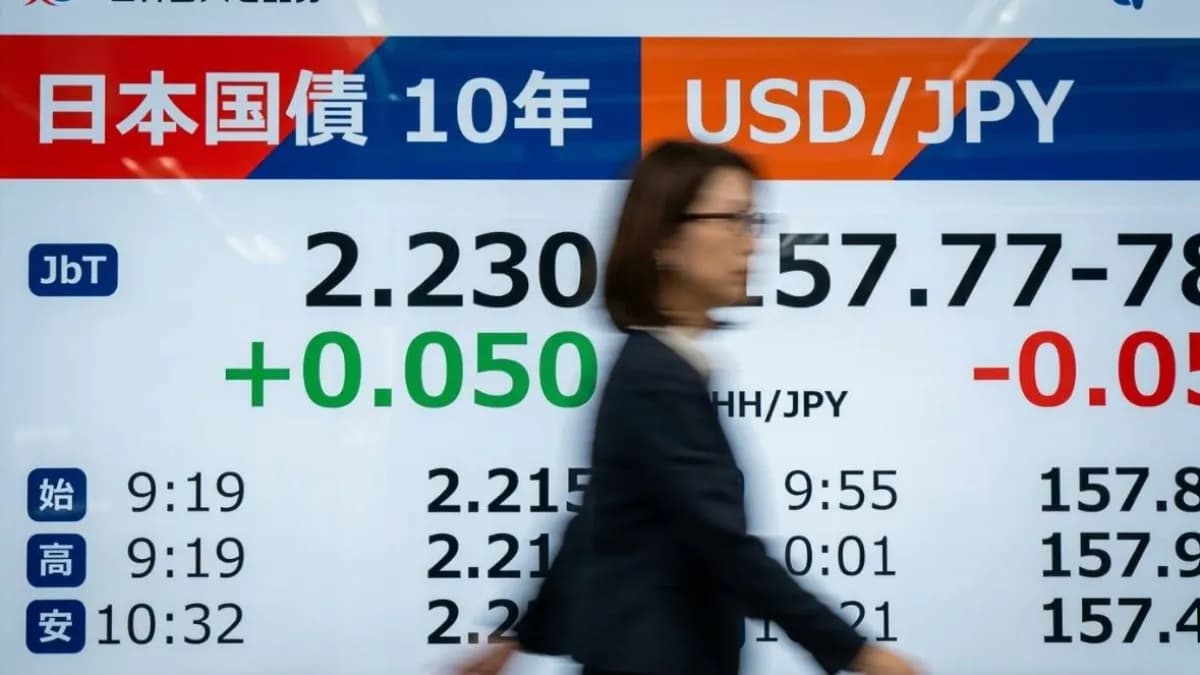

USD/JPY’s price forecast carries a near-term bearish bias as the weekly chart remains in a bearish market structure, with price retesting a major weekly resistance zone.
The 157.724–158.110 weekly resistance zone, bearish candlestick rejection at a potential lower high, and the daily bearish structure keep sellers in focus. Price is also trading below the 50 EMA, adding further bearish confluence.
This USD/JPY technical analysis examines the weekly and daily market structure, key resistance levels, and the confirmation needed for both bullish and bearish scenarios.
Will USD/JPY reject the 157.724–158.110 resistance zone and continue lower, or will a confirmed breakout open the way towards 160.155?
Key U.S. economic data and Federal Reserve updates can increase volatility in USD/JPY, especially inflation, employment, interest rates, and economic growth data.
These releases can trigger breakouts or false breakouts around the 157.724–158.110 weekly resistance zone.
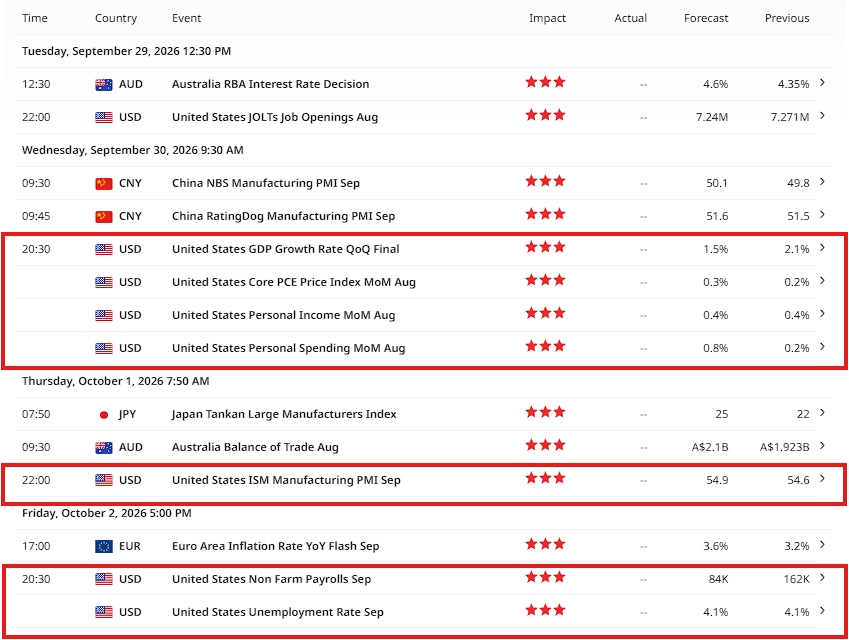
High-Impact News. Source: Finlogix
For USD/JPY technical analysis, news should be treated as a catalyst, not a trade signal. Traders should wait for price action confirmation after the initial volatility.
Watch for:
News creates volatility, but price action confirms the trade setup. Wait for the market to show its hand.

Weekly Timeframe Price Action Analysis. Price retesting Weekly Level
USD/JPY remains in a bearish market structure on the weekly chart, with price continuing to form a sequence of lower highs and lower lows.
Understanding these market structure formations is essential when assessing whether a trend is continuing or beginning to change.
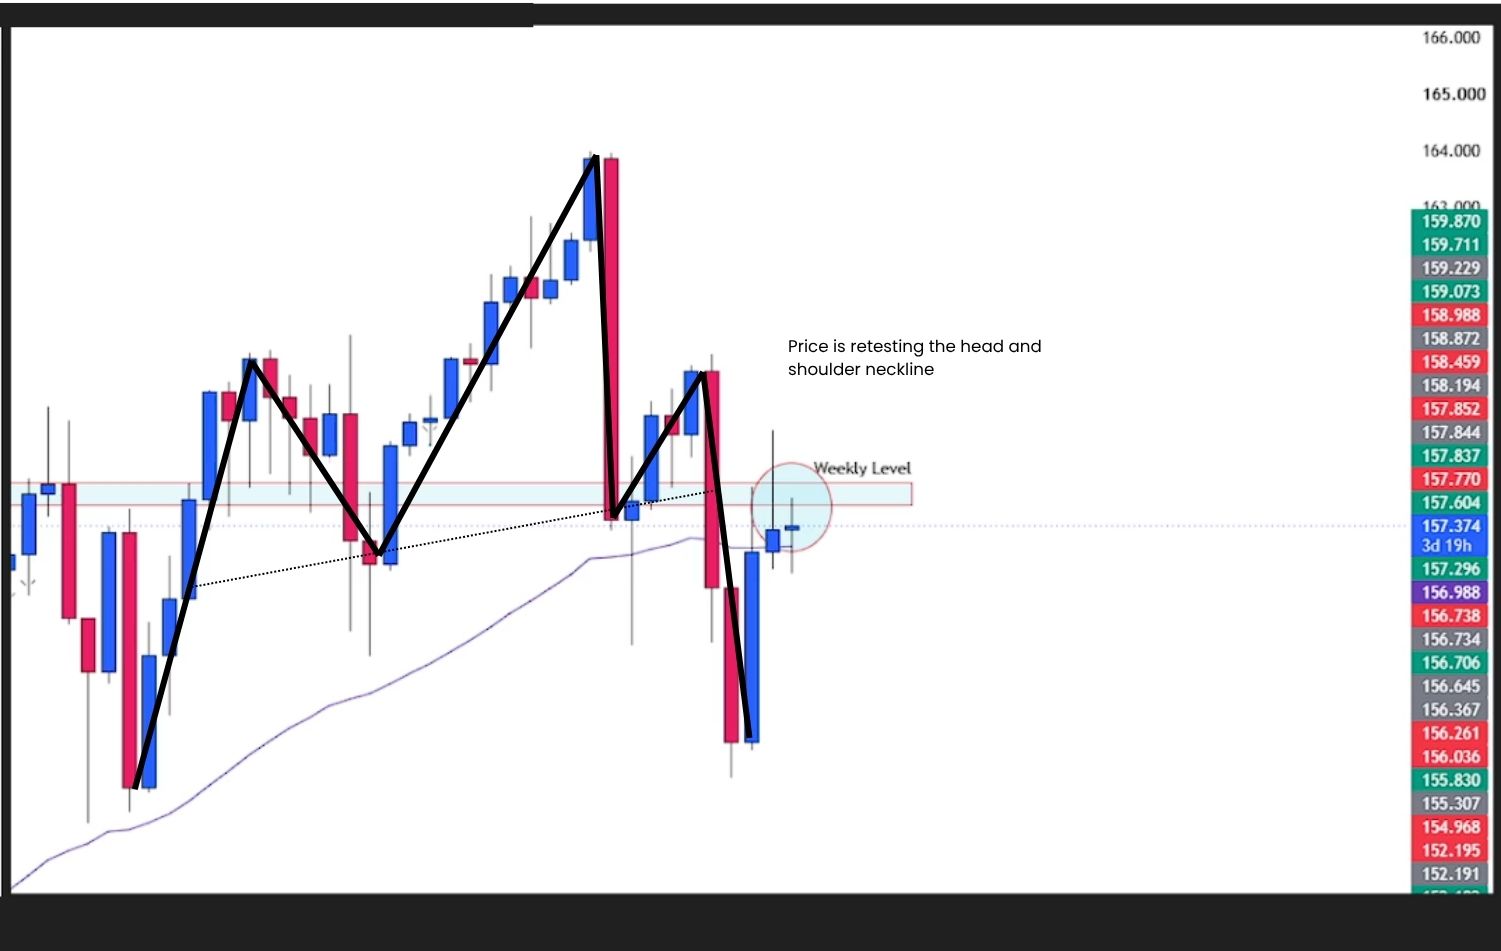
Weekly Timeframe Price Action Analysis. Price Retesting Weekly Head and Shoulder Neckline
Price has now returned to the 157.724–158.110 weekly resistance zone, which also aligns with the neckline of a potential Head and Shoulders pattern. This makes the area an important decision zone for determining whether the broader bearish structure can continue.
The current weekly setup includes:
The Head and Shoulders neckline retest adds further confluence to the bearish setup. However, the pattern and resistance rejection should not be treated as confirmation on their own.
For the bearish scenario to strengthen, sellers need to defend the 157.724–158.110 resistance and neckline zone and generate follow-through on the lower timeframes.
This makes price action at key levels particularly important, as the reaction around the neckline and resistance can provide confirmation of whether sellers or buyers are gaining control.
Conversely, a sustained weekly breakout above the 157.724–158.110 resistance and Head and Shoulders neckline would weaken the immediate bearish structure and shift attention towards the bullish scenario.

Daily Timeframe Price Action Analysis. Price Broke Weekly Level and Retesting it as Resistance
The daily chart also maintains a bearish market structure, with price trading below the 157.724–158.110 weekly resistance zone.
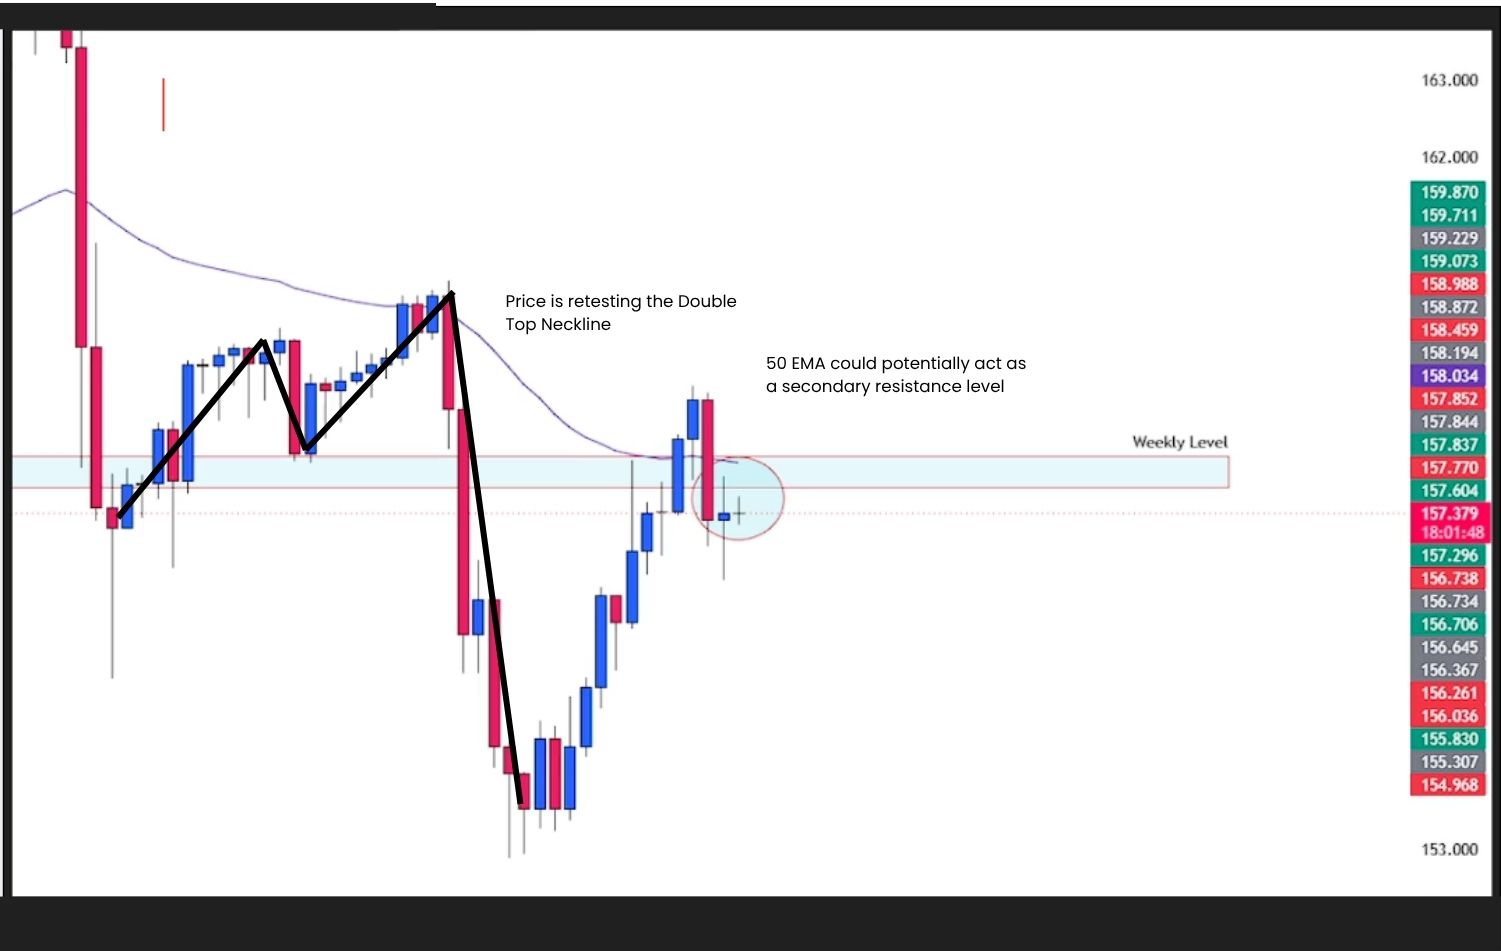
Daily Timeframe Price Action Analysis. Price Retesting Both Double Top Neckline and 50 EMA
Price is also retesting the double-top neckline, creating another important decision area. A rejection from this level would provide additional confluence for the bearish setup.
The daily chart shows:
The combination of market structure with support and resistance helps establish the broader context for the setup.
The 50 EMA provides additional context because price remains below the indicator while the broader daily structure is bearish.
Traders can also use EMA price action analysis to assess whether the moving average is acting as dynamic support or resistance.
However, the EMA should be treated as supporting evidence rather than confirmation by itself. The key confirmation remains how price reacts around the resistance and neckline area.
Identifying support and resistance levels helps define where traders can monitor potential breakouts, retests and reversals.
| USD/JPY Level | Role |
| 160.155 | Potential bullish target after confirmed breakout |
| 158.110 | Upper boundary of weekly resistance |
| 157.724–158.110 | Key weekly resistance and decision zone |
| 157.724 | Lower boundary of weekly resistance |
| 154.470 | Potential bearish target if resistance holds |
The central question is whether 157.724–158.110 remains resistance or becomes support.
The target levels are conditional objectives rather than guaranteed outcomes. Confirmation should come from completed price action and a successful retest rather than an intraday move alone.

Daily Timeframe Price Action Analysis. Bullish Bias Anticipation
For the bullish scenario, USD/JPY needs to break and close above the 157.724–158.110 weekly resistance zone.
A breakout alone would not provide the strongest confirmation. Ideally, price should return to the broken resistance and successfully hold the area as support.
A successful break-and-retest would indicate that the former resistance zone is transitioning into support.

Daily Timeframe Price Action Analysis. Bullish Take Profit and Stop-loss Placement
An intraday spike above 158.110 would not be sufficient on its own. Waiting for a candle close and subsequent retest can help distinguish a genuine breakout from a false breakout.
A bullish engulfing candle or similar confirmation can also provide additional evidence during the support retest. Learn more about engulfing candlestick entry signals and how candlestick confirmation can be combined with price action.
Invalidation: A failed breakout followed by a sustained move back below 157.724, particularly if the resistance zone is reclaimed by sellers, would undermine the bullish breakout-and-retest setup.

Daily Timeframe Price Action Analysis. Bearish Bias Anticipation
For the bearish scenario, USD/JPY needs to retest 157.724–158.110 and reject the zone as resistance.
This scenario is supported by the existing bearish weekly structure, the potential lower-high formation, and the bearish daily market structure.
The daily double-top neckline retest and the 50 EMA provide additional areas to monitor for secondary resistance.

Daily Timeframe Price Action Analysis. Bearish Take Profit and Stop-loss Placement
The strongest bearish confirmation would come from a combination of resistance rejection, bearish candlestick confirmation and downside follow-through.
For traders looking to understand how candlestick signals can support a price-action setup, bullish and bearish pin bars and Japanese candlestick confirmation can provide useful additional context.
The 50 EMA can provide additional confluence, but price action remains the primary confirmation.
Invalidation: A sustained break above 158.110, followed by a successful retest of 157.724–158.110 as support, would undermine the bearish resistance-rejection setup.
USD/JPY’s near-term outlook remains bearish while price stays below the 157.724–158.110 weekly resistance zone.
The bearish setup is supported by the weekly bearish market structure, potential lower-high formation, daily bearish structure, double-top neckline retest and price trading below the 50 EMA.
A confirmed rejection and downside follow-through would keep 154.470 in focus.
On the other hand, a confirmed breakout above 157.724–158.110, followed by a successful support retest and bullish continuation, would shift attention towards 160.155.
The key is to wait for price action confirmation rather than anticipating the move before the market confirms the setup.
Watch the weekly resistance reaction. Wait for the candle to close. Let price action confirm the next move.
_____________________________________________________________________________________
Move from learning price action to applying it in the real market.
Trade:
Access trading platforms and tools including ACY, MT4, MT5, and Copy Trading.
Create an Account and Start Live Trading
_____________________________________________________________________________________
Build your trading foundation with these step-by-step guides:
Learn to read price action and assess trading setups at key levels:
Learn to recognize bullish, bearish and sideways markets:
Learn to mark key levels and interpret price reactions:
Understand recurring price patterns, retests and false breakouts:
Learn to combine candlestick signals with price action analysis:
Learn to recognize patterns that may signal a change in market direction:
Explore how to combine the exponential moving average with price action:
Bring your technical analysis skills together through a gold swing trading guide:
Learn how risk management and position sizing fit into your trading plan:
Learn how to plan take-profit targets using market structure and risk-reward:
Develop discipline, emotional awareness and a more consistent trading process:
Explore the psychological habits behind a disciplined trading approach:
_____________________________________________________________________________________
Not sure where to begin? Here’s a simple roadmap to guide you:
By building step by step; from basics → real trading → mastering the craft, you’ll gain clarity, confidence, and steady progress without ever feeling overwhelmed.
_____________________________________________________________________________________
Follow Ruffy Grant B. Capacio for Gold analysis, Forex trading ideas, price action education, trading psychology, and market insights: LinkedIn
ACY Securities: Join the Discord Server
Disclaimer:
Trading Forex, Gold, CFDs, cryptocurrencies, commodities, indices, and other leveraged financial instruments involves a high degree of risk and may not be suitable for all investors or traders. Market conditions can change rapidly, and leveraged trading can result in losses that occur quickly.
Before trading, carefully consider your investment objectives, level of experience, and risk tolerance. Only trade with capital you can afford to lose and seek independent financial or professional advice where appropriate.
All market analysis, price forecasts, technical commentary, trading scenarios, educational materials, and opinions presented in this content are provided solely for general informational and educational purposes. They do not constitute financial advice, investment advice, a recommendation, solicitation, or an offer to buy or sell any financial instrument.
Past performance and historical price movements are not reliable indicators of future results. Any price levels, targets, scenarios, or market outlooks discussed should be viewed as analysis rather than guarantees of future market performance. September 29, 2026
ACY Securities is one of Australia's fastest growing multi-asset online trading providers, offering ultra-low-cost trading, rock-solid execution, technologically superior account management and premium market analysis.

Select the categories and companies you wish to follow directly to your person rss feed.
Create Custom RSS FeedSign up and join over 5,000 professional members who receive personalized news alerts, curated professional connections, and more for free!
Standard Chartered has signed definitive agreements to acquire 100% of Zodia Custody UK Limited, folding its regulated digital asset custody business into Securities Services. Zodia Solutions will be set up under SC Ventures with bank investors including Northern Trust, NAB Ventures, Emirates NBD and Investcorp.
Bybit Fintech FZE has secured a Virtual Asset Service Provider licence from Dubai’s Virtual Assets Regulatory Authority for Exchange Services, covering spot trading. Bybit’s Peter Loo said the firm hopes to add derivatives, subject to regulatory approvals. Its international Dubai headquarters opened in 2022.
ATFX Connect has released its Q4 2026 Institutional Edge, examining the geopolitical, monetary policy and fiscal pressures shaping global financial markets in the final quarter of the year.
The Nasdaq 100 is trading at 29,382. After reaching a recent high of 29,957, the index reversed sharply and has been recording a series of lower highs and lower lows.
propfunding.com's free-entry instant funding changes the order of prop funding. Start trading first. Its free-entry instant funding model offers two qualification attempts without an upfront activation fee.
FM Summit London returns to Old Billingsgate on 24 November 2026 for its 15th edition, with a curated one-day format aimed at senior executives. LMAX Group, Plus500, oneZero and MetaQuotes are among confirmed exhibitors, with Business Connect meetings, roundtables and an opening event at The Folly on 23 November.
GCEX has launched European-style, fiat-settled options on Bitcoin and Ethereum with monthly expiries for eligible professional and institutional clients. The service runs through the GCEX OTC desk, with pricing from Tier 1 liquidity providers and reporting on XplorPortal. GC Exchange Limited is authorised by the UK FCA
Wall Street closed mostly higher on Tuesday, led by a nearly 1% gain in the Dow. In Asia, South Korea’s Kospi rebounded 2.7% and Japan’s Nikkei gained 0.8%.
Brent crude is trading at $111.70. The latest price action show the recovery continuing toward $111.70, suggesting that demand has returned after the sharp correction.
FOREX.com has introduced weekend trading for US SP 500 and US Tech 100 CFDs in Japan, operated by StoneX Securities Co., Ltd., a StoneX Group Inc. subsidiary. Investors can manage positions seven days a week, including Saturday and Sunday sessions, without waiting for underlying markets to reopen on Monday.