just now


Liquidity Finder Ltd is incorporated in England and Wales, company number 10610740, registered address 167-169 Great Portland Street, Fifth Floor, London W1W 5PF, United Kingdom.
Published: just now
U.S. stock indices closed higher on September 25, 2026, as declining crude oil prices and stabilizing U.S. Treasury yields provided a steady backdrop for equity markets. For market participants looking to understand market fundamentals, this report examines the core economic drivers, upcoming calendar events, and key technical levels shaping the S&P 500 index.
Key Takeaways
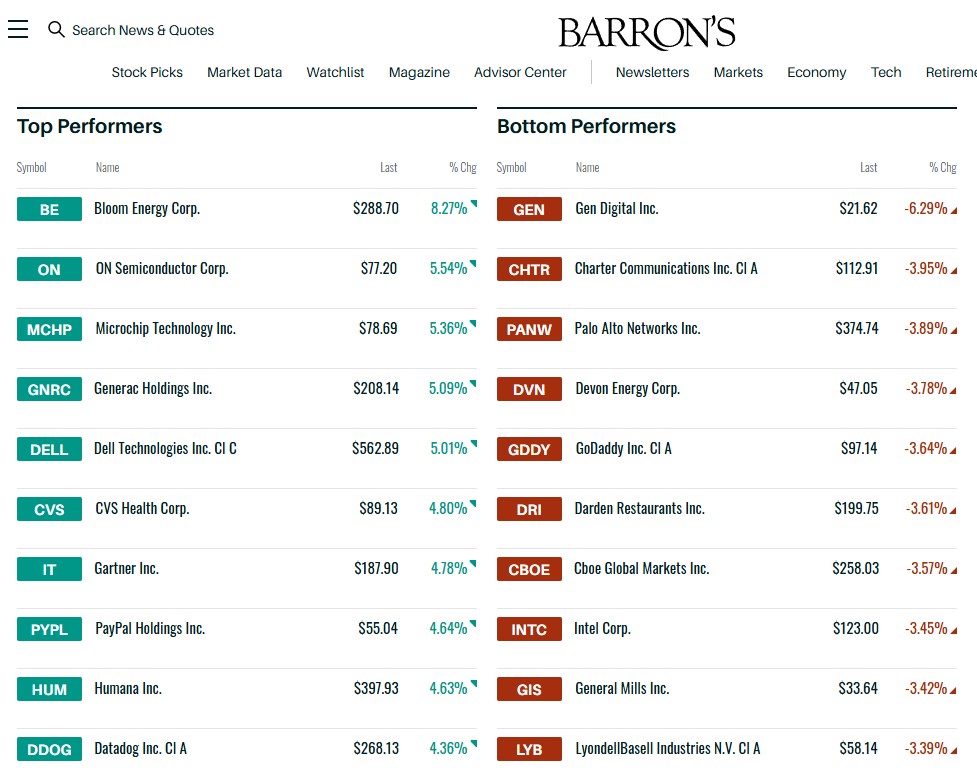
Source: Barron's
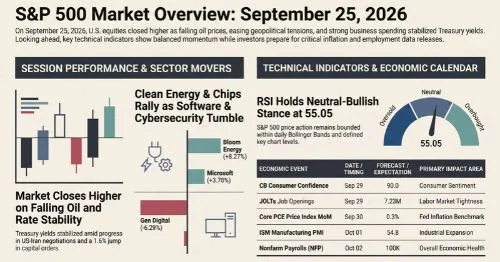
During the September 25 session, lower crude oil prices offered relief to broad market valuations, helping offset concerns regarding elevated living costs and consumer sentiment headwinds.
To evaluate potential market direction as new economic information arrives, market analysts evaluate balanced hypothetical scenarios:
Economic Calendar
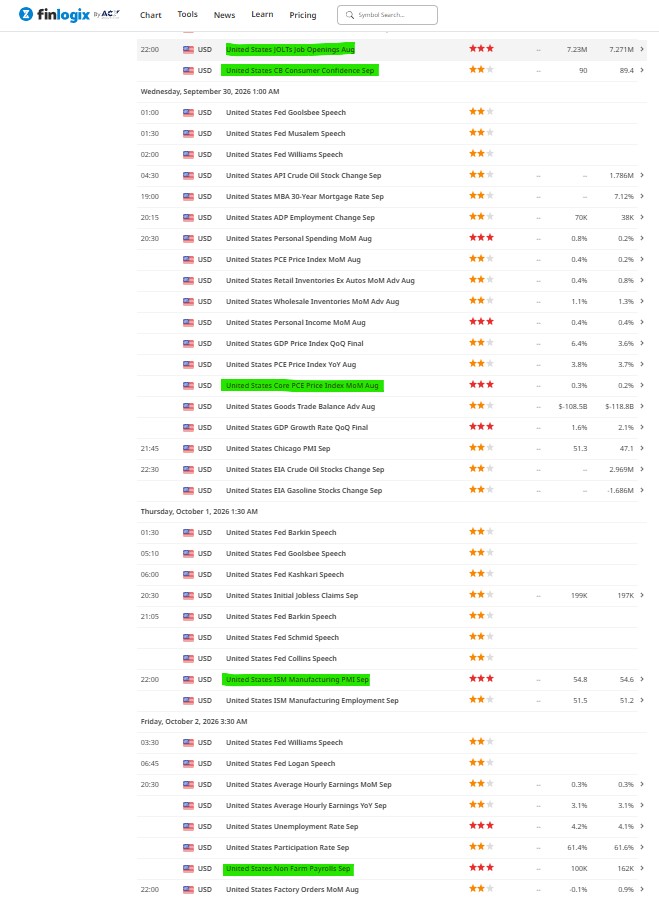
Source: Finlogix
Economic calendar tracking data, such as indicators sourced from the Finlogix economic calendar, highlight five key macroeconomic releases that significantly influence investor sentiment and equity market liquidity:
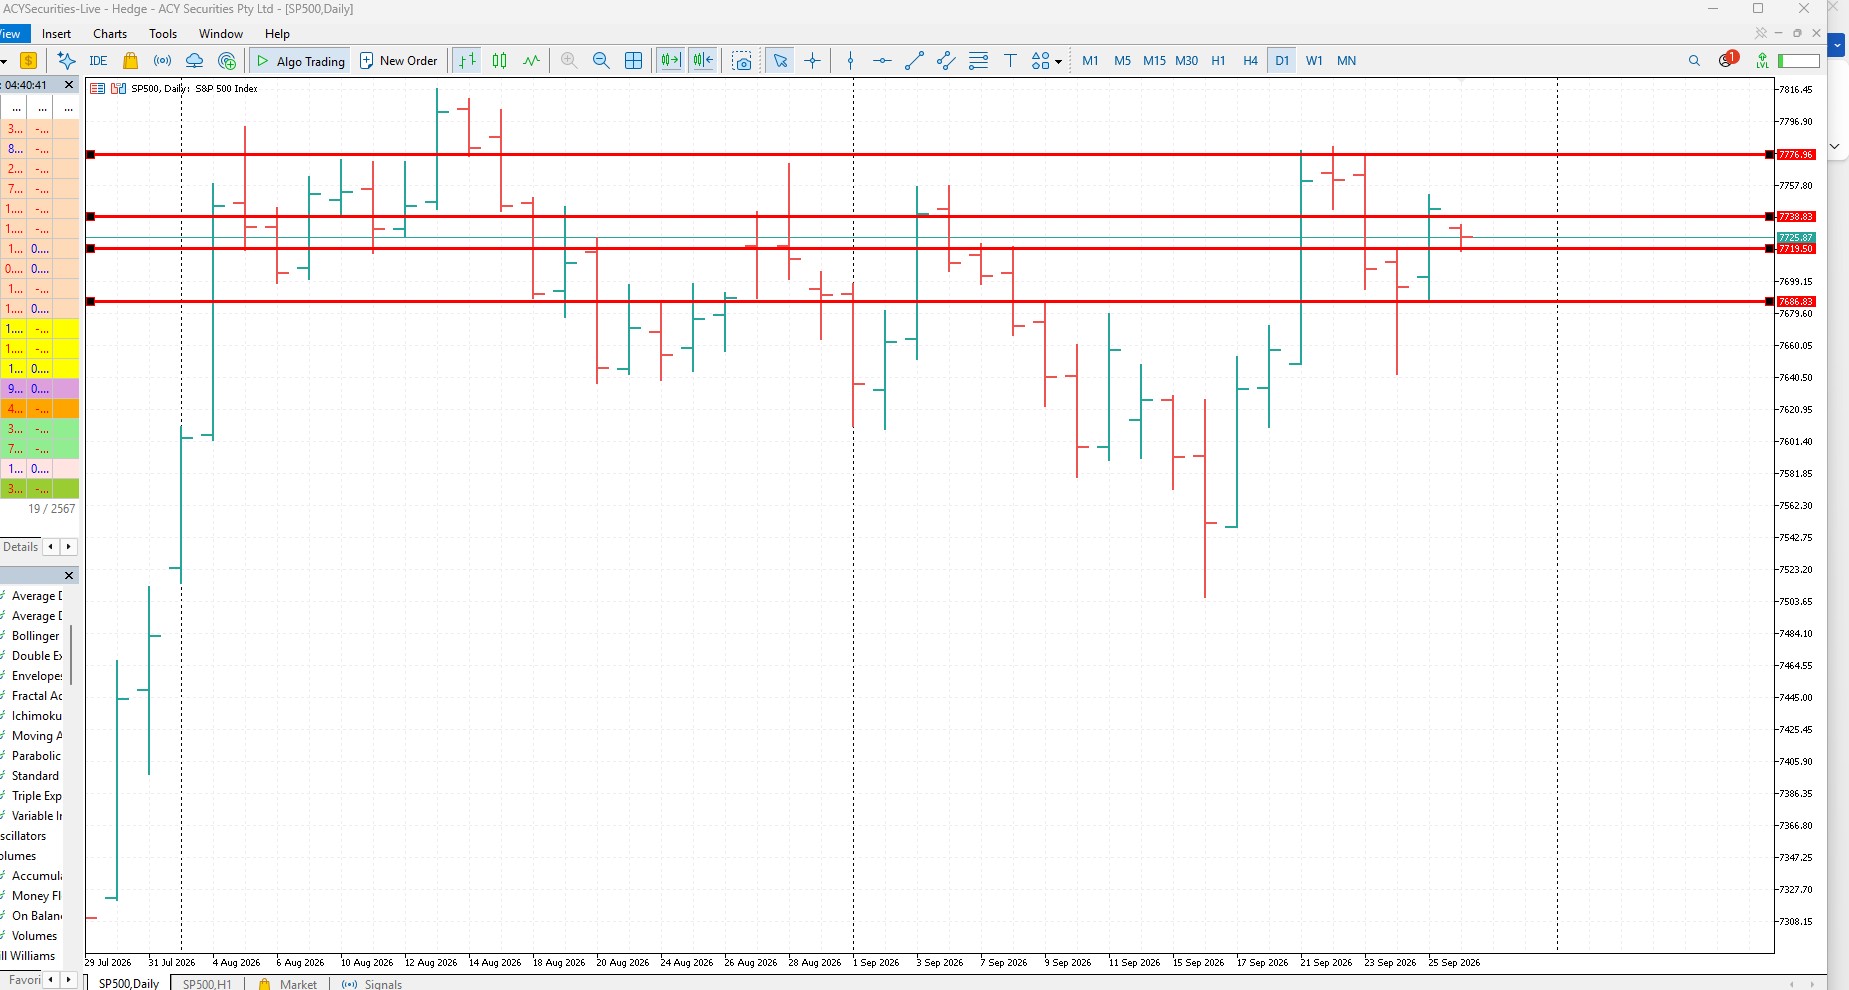
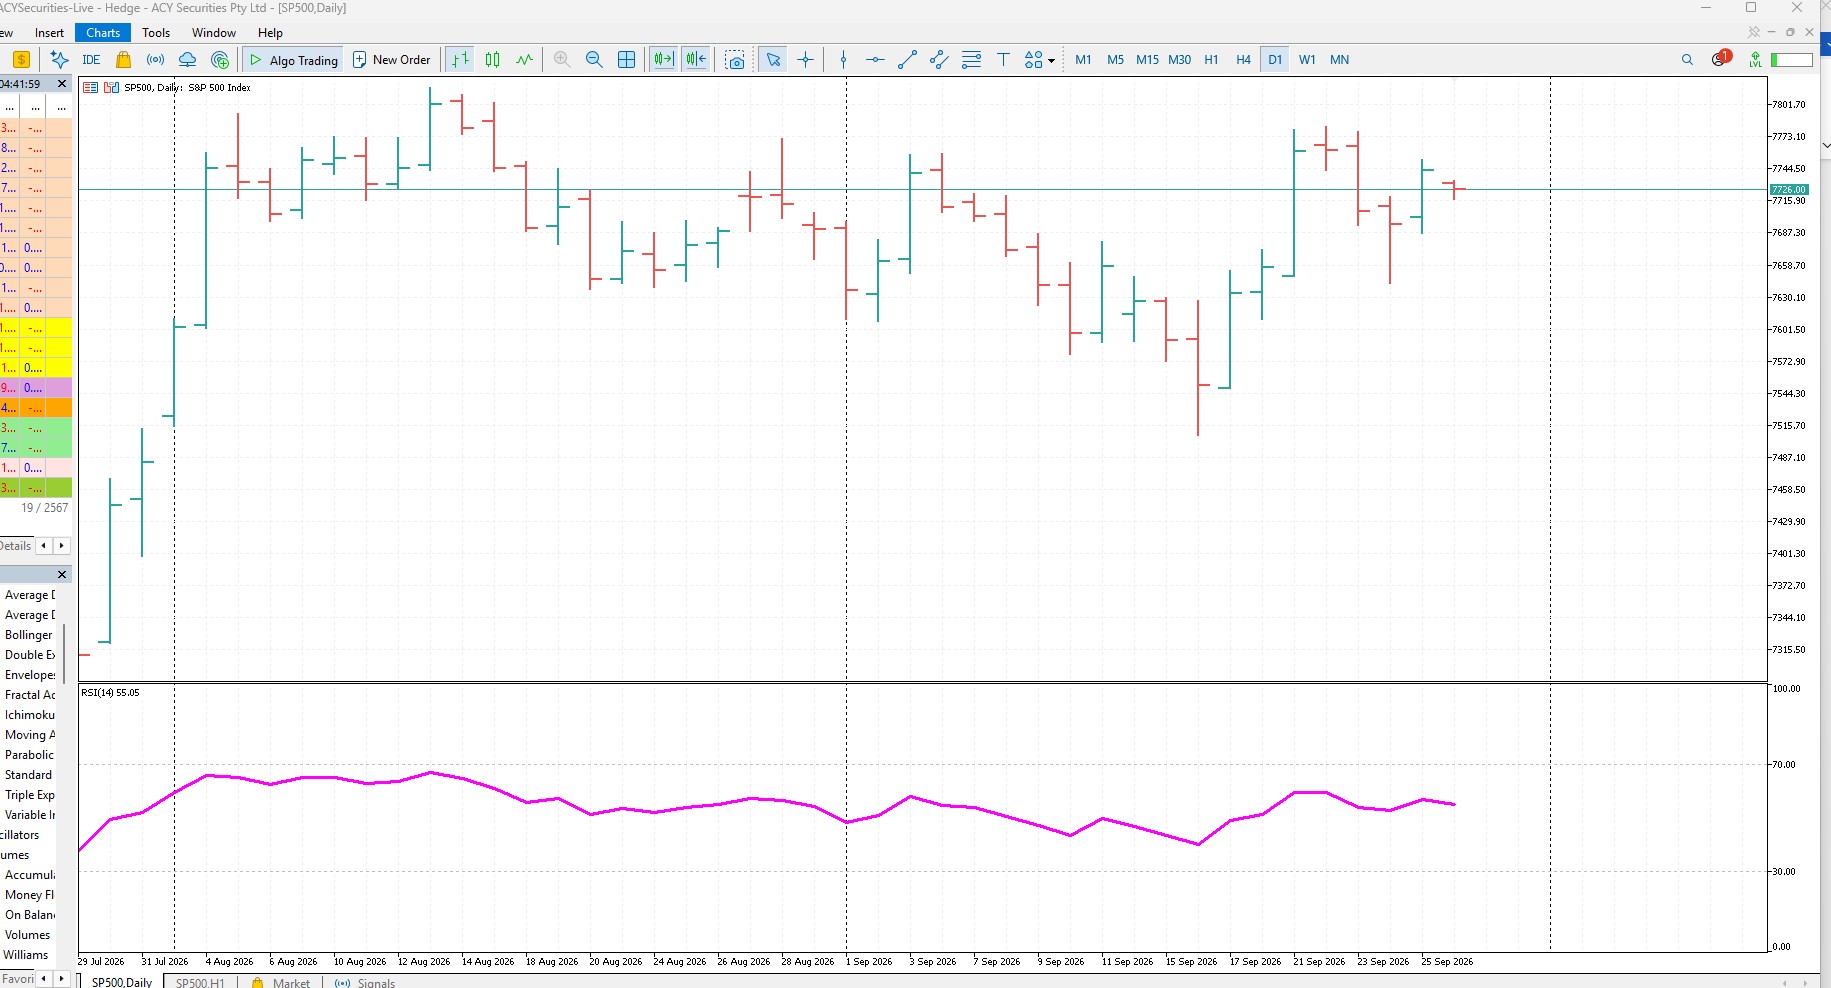
Technical indicators provide visual price context to complement fundamental evaluation, identifying price areas where demand or supply may concentrate.
Below the Daily Chart
Source: ACY MetaTrader5
Source: ACY MetaTrader5
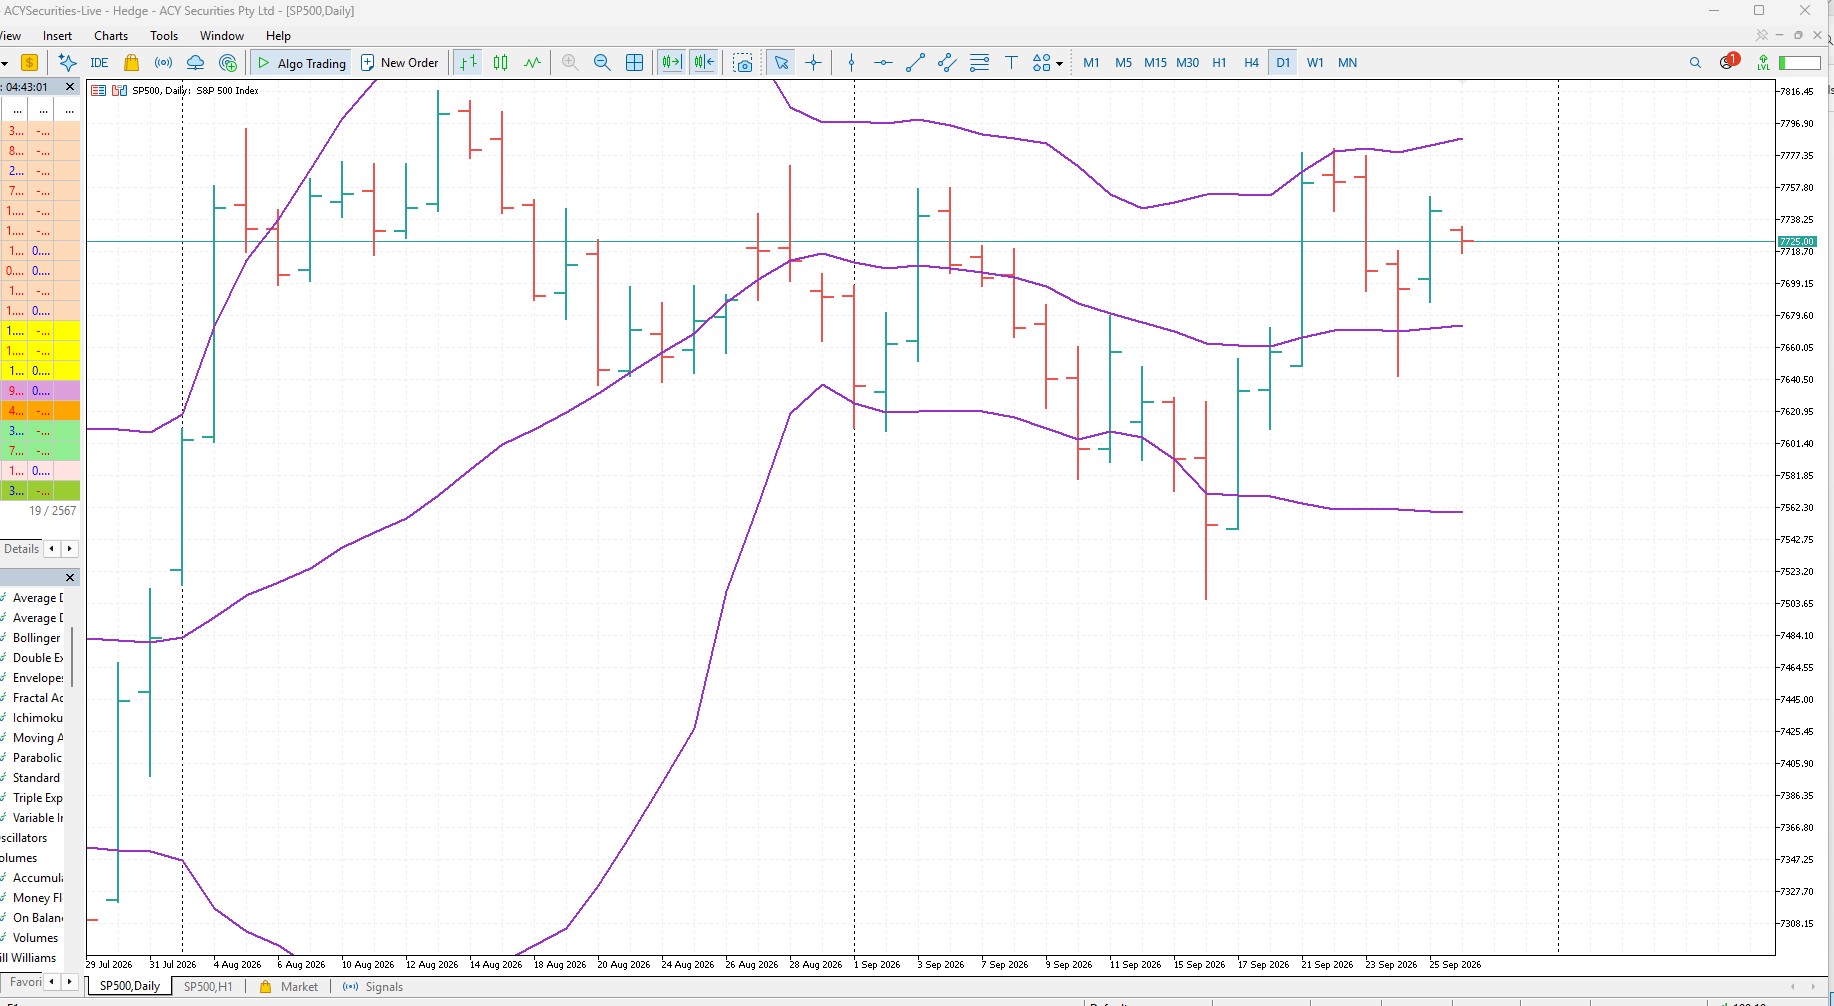
Source: ACY MetaTrader5
Summary of Key Technical Levels
| Indicator / Level Type | Price Level / Value | Market Context & Significance |
| Upper Resistance 2 | 7,776.96 | Major overhead resistance level on the daily chart, a clean breached here could target the 7800 level region. |
| Upper Resistance 1 | 7,738.83 | Immediate technical resistance ceiling. |
| Current Index Level | 7,726.00 | Closing index price benchmark. |
| Pivot / Near-Term Support | 7,719.50 – 7,725.87 | Consolidation support zone from recent daily sessions. |
| Primary Support 1 | 7,686.83 | Key support floor aligned near the middle Bollinger Band. |
| Lower Bollinger Band | ~7,560.00 | Lower statistical volatility boundary. |
| Upper Bollinger Band | ~7,790.00 | Upper statistical volatility boundary. |
| Daily RSI (14) | 55.05 | Neutral momentum reading leaning slightly positive. |
Disclaimer: This content may have been written by a third party. ACY makes no representation or warranty and assumes no liability as to the accuracy or completeness of the information provided, nor any loss arising from any investment based on a recommendation, forecast or other information supplies by any third-party. This content is information only, and does not constitute financial, investment or other advice on which you can rely.
ACY Securities is one of Australia's fastest growing multi-asset online trading providers, offering ultra-low-cost trading, rock-solid execution, technologically superior account management and premium market analysis.

Select the categories and companies you wish to follow directly to your person rss feed.
Create Custom RSS FeedSign up and join over 5,000 professional members who receive personalized news alerts, curated professional connections, and more for free!
Standard Chartered has signed definitive agreements to acquire 100% of Zodia Custody UK Limited, folding its regulated digital asset custody business into Securities Services. Zodia Solutions will be set up under SC Ventures with bank investors including Northern Trust, NAB Ventures, Emirates NBD and Investcorp.
Bybit Fintech FZE has secured a Virtual Asset Service Provider licence from Dubai’s Virtual Assets Regulatory Authority for Exchange Services, covering spot trading. Bybit’s Peter Loo said the firm hopes to add derivatives, subject to regulatory approvals. Its international Dubai headquarters opened in 2022.
ATFX Connect has released its Q4 2026 Institutional Edge, examining the geopolitical, monetary policy and fiscal pressures shaping global financial markets in the final quarter of the year.
The Nasdaq 100 is trading at 29,382. After reaching a recent high of 29,957, the index reversed sharply and has been recording a series of lower highs and lower lows.
propfunding.com's free-entry instant funding changes the order of prop funding. Start trading first. Its free-entry instant funding model offers two qualification attempts without an upfront activation fee.
FM Summit London returns to Old Billingsgate on 24 November 2026 for its 15th edition, with a curated one-day format aimed at senior executives. LMAX Group, Plus500, oneZero and MetaQuotes are among confirmed exhibitors, with Business Connect meetings, roundtables and an opening event at The Folly on 23 November.
GCEX has launched European-style, fiat-settled options on Bitcoin and Ethereum with monthly expiries for eligible professional and institutional clients. The service runs through the GCEX OTC desk, with pricing from Tier 1 liquidity providers and reporting on XplorPortal. GC Exchange Limited is authorised by the UK FCA
Wall Street closed mostly higher on Tuesday, led by a nearly 1% gain in the Dow. In Asia, South Korea’s Kospi rebounded 2.7% and Japan’s Nikkei gained 0.8%.
Brent crude is trading at $111.70. The latest price action show the recovery continuing toward $111.70, suggesting that demand has returned after the sharp correction.
FOREX.com has introduced weekend trading for US SP 500 and US Tech 100 CFDs in Japan, operated by StoneX Securities Co., Ltd., a StoneX Group Inc. subsidiary. Investors can manage positions seven days a week, including Saturday and Sunday sessions, without waiting for underlying markets to reopen on Monday.