just now

Liquidity Finder Ltd is incorporated in England and Wales, company number 10610740, registered address 167-169 Great Portland Street, Fifth Floor, London W1W 5PF, United Kingdom.
Published: just now
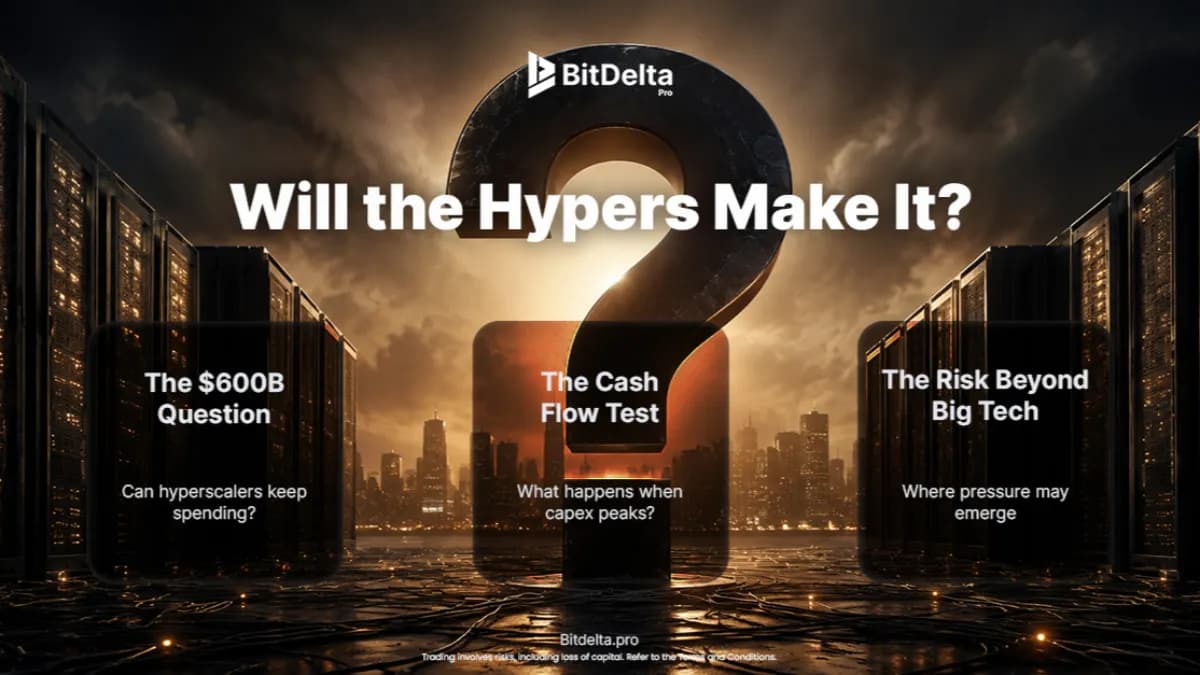
The most popular question in equity markets right now is whether the hyperscalers can sustain the capital expenditure commitments they have made. Microsoft has guided approximately $120 billion. Amazon has committed roughly $200 billion. Google is targeting $175-185 billion. Meta has set $115-135 billion. Combined, the four largest cloud infrastructure providers are planning to spend over $600 billion on AI infrastructure in 2026 alone.
The bears argue this level of spending is unsustainable, that it will compress free cash flow, dilute returns on invested capital, and ultimately weigh on equity valuations as the market demands evidence that the investment is generating returns. The Alphabet equity raise of $84.75 billion in June, backed by $10 billion from Berkshire Hathaway, is cited as proof that even the most profitable businesses in history can no longer fund the buildout from internal cash flow alone.
The question deserves a quantitative answer, and to answer it, we built a model. Here is what it shows.
We constructed a bottom-up financial model for Microsoft projecting revenue, operating income, operating cash flow, and free cash flow through Q4 FY2028 (calendar year end 2028). The model connects capital expenditure directly to cloud revenue through a fixed asset turnover framework, with explicit assumptions about utilization ramp rates and revenue per incremental dollar of invested capital. The need for this exercise is even more apparent after the incredible Q4 earnings that Microsoft reported on July 29.
The assumptions are deliberately conservative:
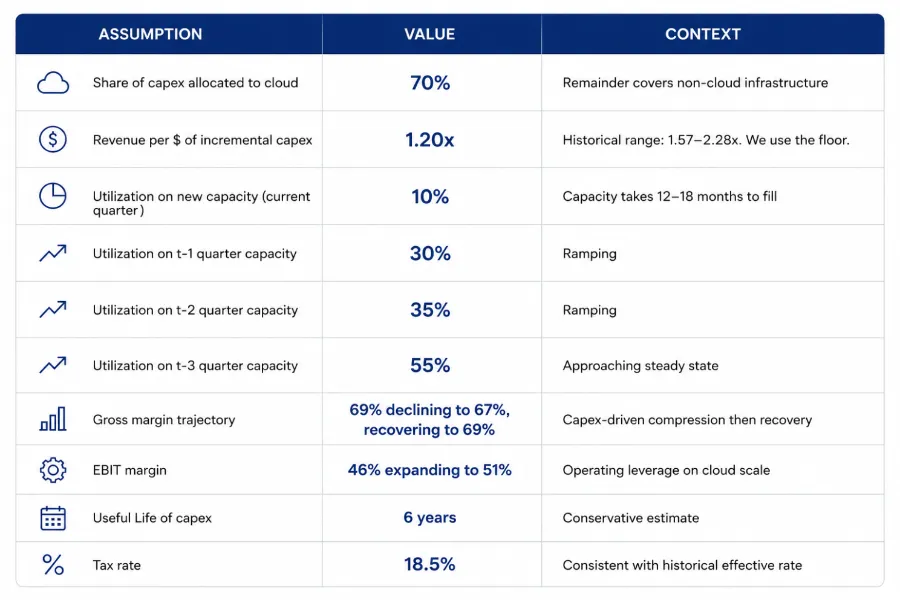
Under these assumptions, Microsoft's Intelligent Cloud segment grows from $39 billion in Q4 FY2026 to $61 billion by Q4 FY2028, driven entirely by the capex-to-revenue conversion modeled through the asset turnover framework. Total company revenue reaches approximately $417 billion in FY2027 and $525 billion in FY2028.
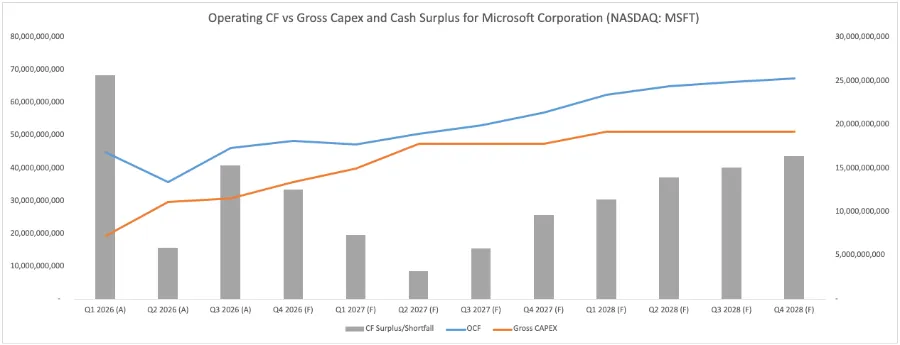
The critical output: free cash flow remains positive in every quarter of the forecast.
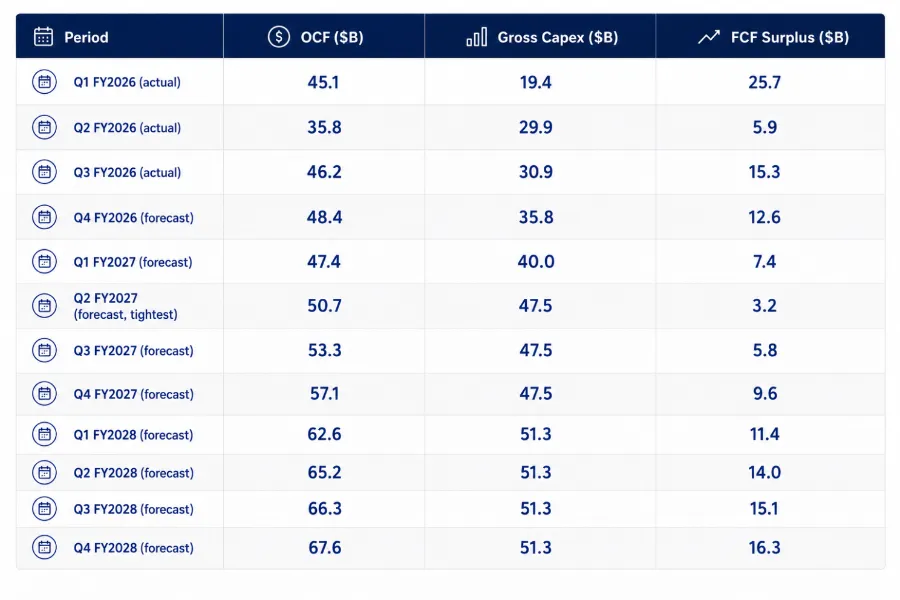
The tightest quarter is Q2 FY2027, where the FCF surplus narrows to $3.2 billion. This is the point of maximum capex-to-revenue lag: the company is spending at peak intensity but the newest capacity has not yet ramped to meaningful utilization. By Q4 FY2027, the surplus recovers to $9.6 billion. By Q4 FY2028, it reaches $16.3 billion and is widening.
Our model’s findings are consistent with what Microsoft CEO Amy Hood said in their earnings call yesterday, where she revealed that Microsoft expects positive free cash flow in 2027.
The model uses the lowest plausible utilization rates (sub-60% across the board) and a fixed asset turnover ratio of 1.20, well below the 1.57 observed in the most recent actual quarter. Even under these stressed assumptions, Microsoft never posts a negative free cash flow quarter. The machine tightens at peak capex intensity. The possibility of negative FCF is reduced further when we take into account the fact that 90% of cloud growth came from non frontier labs. Meaning, while capex is meant to power labs, they are not expected to fund them entirely, yet.
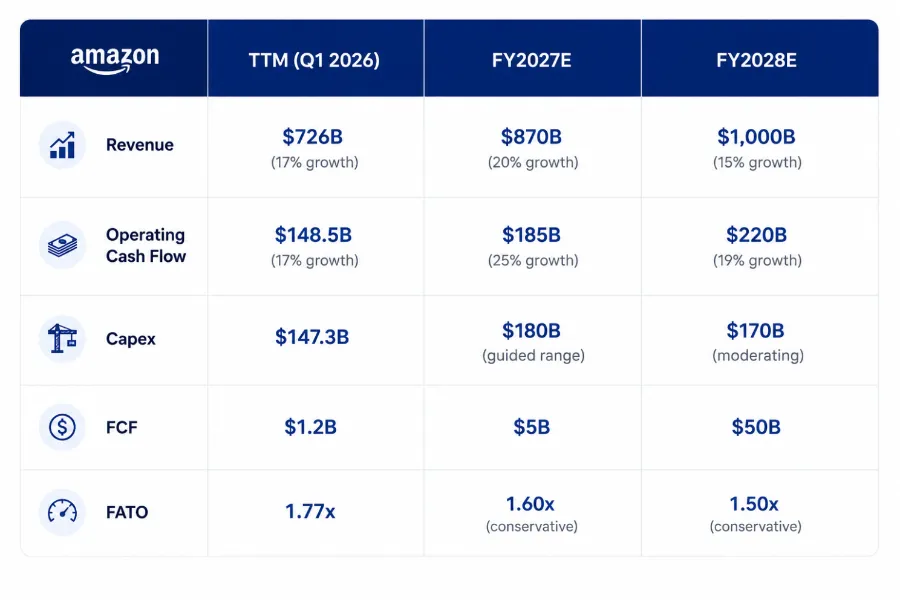
Amazon presents a more dramatic version of the same story. Trailing twelve-month free cash flow has collapsed 95% year-over-year to just $1.2 billion. The headline is alarming. The composition is not.
Q1 2026 capex was $44.2 billion, on pace for the guided $200 billion annual target. But operating cash flow was $26 billion in the quarter, up 53% year-over-year. TTM operating cash flow is $148.5 billion, up 30%. The company is generating record cash from operations. It is choosing to reinvest every dollar.
AWS revenue is $37.6 billion per quarter and growing 28% year-over-year, its fastest pace in 15 quarters. AWS operating margin is 37.7%. This single segment generates 59% of Amazon's total operating income from 21% of revenue. The capex is building capacity for the highest-margin business Amazon has ever operated.
At a fixed asset turnover of 1.77 (current) declining conservatively to 1.50 by FY2028, the capex converts to revenue on an accelerating basis as new data center capacity fills with customers. The signed compute commitments provide visibility: OpenAI has committed to approximately 2 GW of Trainium capacity through AWS beginning in 2027. Anthropic has locked in up to 5 GW. These are not speculative demand projections. They are contractual obligations.
Amazon's FCF recovers meaningfully by FY2028 as capex growth moderates while OCF continues to expand on rising cloud revenue. The $1.2 billion TTM FCF is the trough, not the trend.
Alphabet's numbers tell the same structural story with one additional complication: the $84.75 billion equity raise.
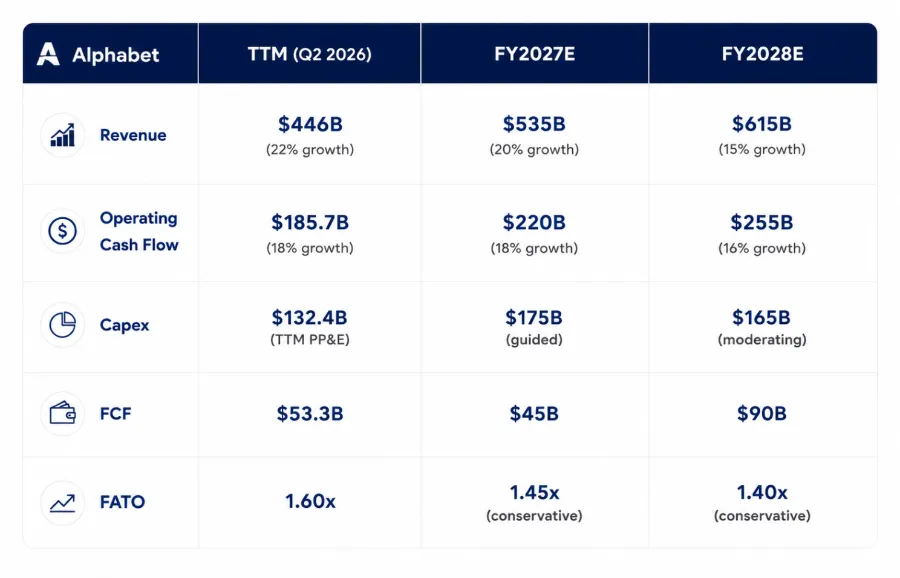
Google Cloud grew 82% year-over-year in Q2 2026 and is now running at over $80 billion in annualized revenue. Search revenue continues to grow (19% YoY in Q1 2026) despite predictions that AI would cannibalize it. YouTube advertising remains robust. The base business generates enough cash to fund the capex program with meaningful surplus.
The equity raise is the complication. Alphabet chose to raise $84.75 billion in external capital despite having more than enough internal cash generation to fund its investment program. This signals one of two things: either management believes the opportunity is so large that accelerating the buildout by six to twelve months justifies the dilution, or the timing of cash outflows is lumpy enough that the raise provides a buffer against quarters where capex exceeds OCF. In either case, the raise provides an additional cushion that makes the FCF math even more comfortable than the base case suggests.
At a FATO of 1.60 (current) declining conservatively to 1.40, Google's capex converts to cloud and infrastructure revenue on a timeline consistent with Microsoft's experience. FCF narrows in FY2027 as capex peaks, then recovers to $90 billion by FY2028.
The MSFT model and the AMZN/GOOGL napkin math all point to the same conclusion: the big three hyperscalers can afford their capex programs. They generate enough operating cash flow to fund the buildout while remaining FCF positive (or, in Amazon's case, approaching FCF breakeven at the trough before recovering strongly). The capex cycle is self-funding because each wave of investment creates revenue that funds the next wave.
The more productive question is not whether the hyperscalers can afford it. It is who in the broader ecosystem cannot.
The companies at risk are the ones making hyperscaler-scale capex commitments without hyperscaler-scale cash generation. Oracle, for example, is significantly more leveraged than the big three and lacks the diversified revenue base (search, advertising, commerce, consumer hardware) that provides the hyperscalers with a cash flow cushion during the peak investment period. A company with 3x leverage making aggressive infrastructure bets has a fundamentally different risk profile than a company with net cash on the balance sheet doing the same.
The neoclouds face a version of this problem at a smaller scale. A GPU leasing operation with no recurring revenue base and no diversified business is entirely dependent on the spread between GPU rental rates and financing costs. When that spread compresses (and GPU rental rates on legacy hardware are already declining), the model breaks. The hyperscalers can survive a squeeze because cloud is one revenue line among many. A pure-play GPU lessor cannot.
The hyperscaler capex question has a quantitative answer. Under conservative assumptions (sub-60% utilization, bottom-of-range asset turnover, declining gross margins at peak capex intensity), Microsoft remains FCF positive throughout the entire investment cycle. Amazon's FCF trough at $1.2 billion is the result of choosing to reinvest 99% of operating cash flow, not of operating cash flow deteriorating. Google generates enough surplus to fund its program and still has $84.75 billion of additional capital from its equity raise.
Cloud revenue's share of total revenue is approaching 50% for Microsoft. AWS generates 59% of Amazon's operating income. Google Cloud grew 82% last quarter. These are not speculative investments hoping to find a market. They are capacity expansions in businesses that are already the most profitable divisions these companies operate.
The bears are asking the wrong question. The hyperscalers can afford it. The question is who else in the ecosystem is making bets they cannot back with cash flow. That is where the risk lives.
Sources: Microsoft 10-Q filings (FY2024-FY2026), Amazon Q1 2026 earnings release (April 29, 2026), Alphabet Q2 2026 earnings release, company guidance from earnings calls. Financial projections are based on publicly available company filings, consensus estimates, and BitDelta Pro's proprietary research. This is not investment advice.
Institutional multi-asset market access across MT5 Ultency, CQG, Iress Pro and BitDelta Terminal, with transparent execution standards and global market coverage.

Select the categories and companies you wish to follow directly to your person rss feed.
Create Custom RSS FeedSign up and join over 5,000 professional members who receive personalized news alerts, curated professional connections, and more for free!
Multi-asset trading broker AvaTrade has agreed to acquire the majority of FXCM Group’s business and brand, in a transaction that would bring a longstanding retail FX franchise into the AvaTrade Group.
LSEG and CMC Markets have signed a multi-year strategic data agreement expanding CMC's access to LSEG's real-time and delayed pricing, reference and corporate actions data, news and analytics, plus AI-ready content, to support new products, entry into new markets and the growth of CMC's institutional and B2B partnerships.
The Tel Aviv Stock Exchange is considering a bid for the Cyprus Stock Exchange, with Israeli media citing its EU licence, trading platform and clearing house. Euronext’s Athens exchange and India’s National Stock Exchange are also seen as contenders, and Cyprus aims to sign a sale agreement by the end of this year.
CME Group will launch baseball futures on 12 October, pending regulatory review, tracking CME FutureSports Performance Indexes built on Official League Data. Standard and micro contracts will start with the 2026 Postseason and the four clubs in the League Championship Series, trading around the clock.
ESMA has published an opinion stating that MiCA-authorised crypto-asset service providers should cease services tied to non-MiCA-compliant stablecoins for EU clients across MiCA crypto-asset services. National authorities should require remediation of existing exposures within three months, by early January 2027.
Nasdaq Ventures has made a strategic investment in Amsterdam-based derivatives and crypto exchange One Trading, with both firms to explore 24/7 trading of equity futures. The undisclosed investment follows Nasdaq's US$100 million investment in Payward, the parent of Kraken, and CME Group's move to 24/7 trading.
cTrader has opened multi-platform plugins to brokers and prop firms, which can pre-install their own tools for clients or list them in cTrader Store. The plugins run across Mobile, Web, Windows and Mac, and can be built and launched independently of core-platform releases, including trading journals and calculators.
Institutional brokerage and financial infrastructure provider Clear Street has joined TradingView’s broker network, allowing its clients to trade US stocks, exchange-traded funds and options directly through the charting and analysis platform.
Learn how to improve trading psychology, manage fear and greed, avoid revenge trading, and follow your trading strategy with discipline and a trading journal.
GTC Prime has announced a strategic partnership with Centroid Solutions to manage and distribute its liquidity through CS 360 Bridge, Centroid's multi-asset connectivity and execution engine, giving brokers and institutional clients access to tailor-made pricing, low-latency execution and real-time risk management.