
Explore Companies BySectors & Categories
Explore Companies ByUse Cases
Explore Companies ByProducts & Services
Explore Companies ByRankings & Reviews
Featured NewsCompaniesMarketsCryptoTechRegulatoryCommentaryUKUSWorldMore

    Latest Wires

      Daily Newsletter

      LF Daily News

      Daily industry focused newsletter giving you an overview for the financial & finTech industry.

      See All Newsletters
      By clicking "Sign Up" you are agreeing to our Terms of Service and Privacy Policy

      WTI Crude Oil Market Outlook September 21 to 25, 2026

      Published: just now

      WTI Crude Oil Market Outlook September 21 to 25, 2026

      Is WTI Crude Oil Setting Up for a Bullish Breakout Above 50 EMA? Key Technical Levels to Watch


      West Texas Intermediate (WTI) crude oil has stabilized near $100 per barrel following a three-session decline. A combination of active diplomatic efforts in the Middle East and rising regional energy shipments has offered temporary respite to supply anxiety. Global central banks remain attentive as elevated energy prices fuel inflation concerns, prompting expectations of sustained tight monetary policy.


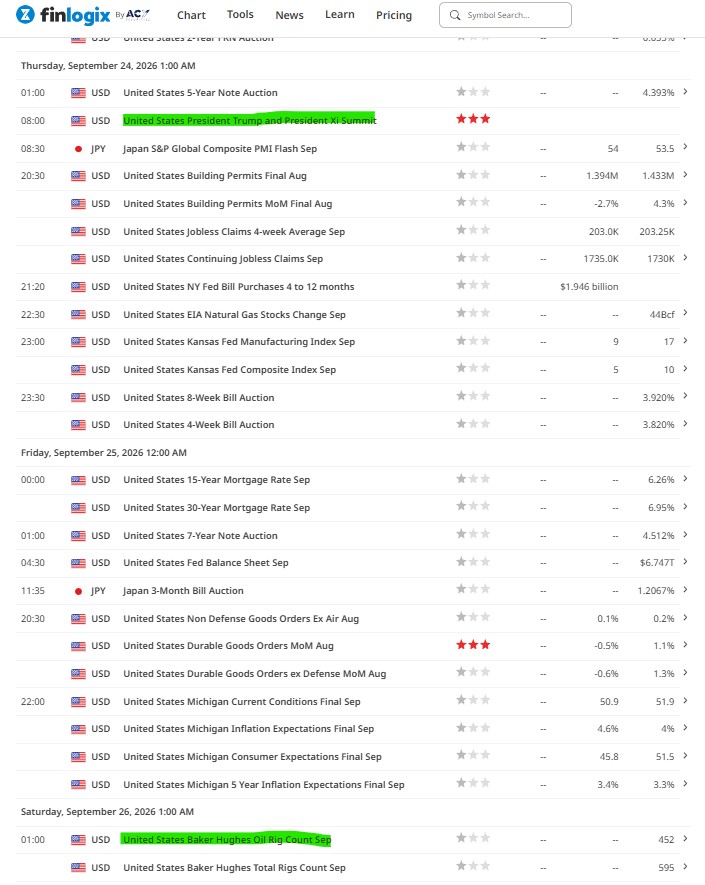
      For the trading week of September 21 to 25, 2026, market participants will also monitor high-impact economic releases, including Flash PMI readings from Germany and the UK, Germany's Ifo Business Climate index, US durable goods data, and a high-profile US-China presidential summit.


      With WTI crude oil stabilizing near $100 per barrel, energy markets stand at a crossroad where geopolitical headlines and weekly inventory shifts dictate immediate price direction.


      KEY DRIVERS TO PRICE MOVEMENTS


      OPEC+ Quota Constraints- Output targets reaffirmed at the September 6 meeting ensure production limits stay locked in through October, guaranteeing sustained supply tightness until the cartel re-evaluates policy on October 4th 2026.


      Post illustration

      Source: OPEC


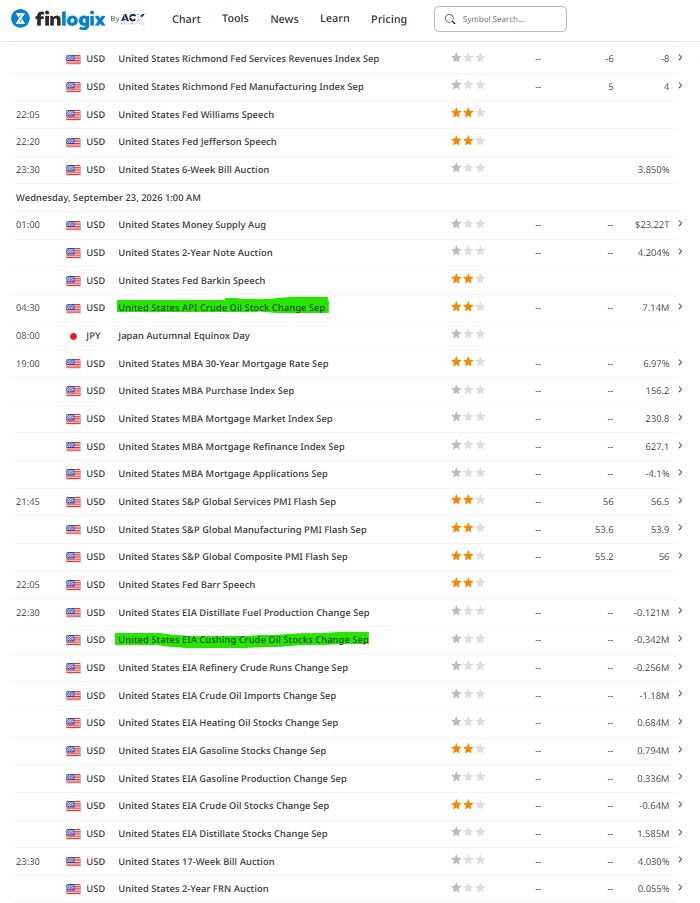
      Weekly Inventory

      1. American Petroleum Institute (API) Data Released Tuesday afternoon at 430 PM EST, serving as an early indicator of US commercial inventory trends.
      2. Energy Information Administration (EIA) Data Released Wednesday morning at 1030 AM EST, acting as the primary market benchmark.

      Post illustration

      Source: Finlogix


      Post illustration

      Source: Finlogix


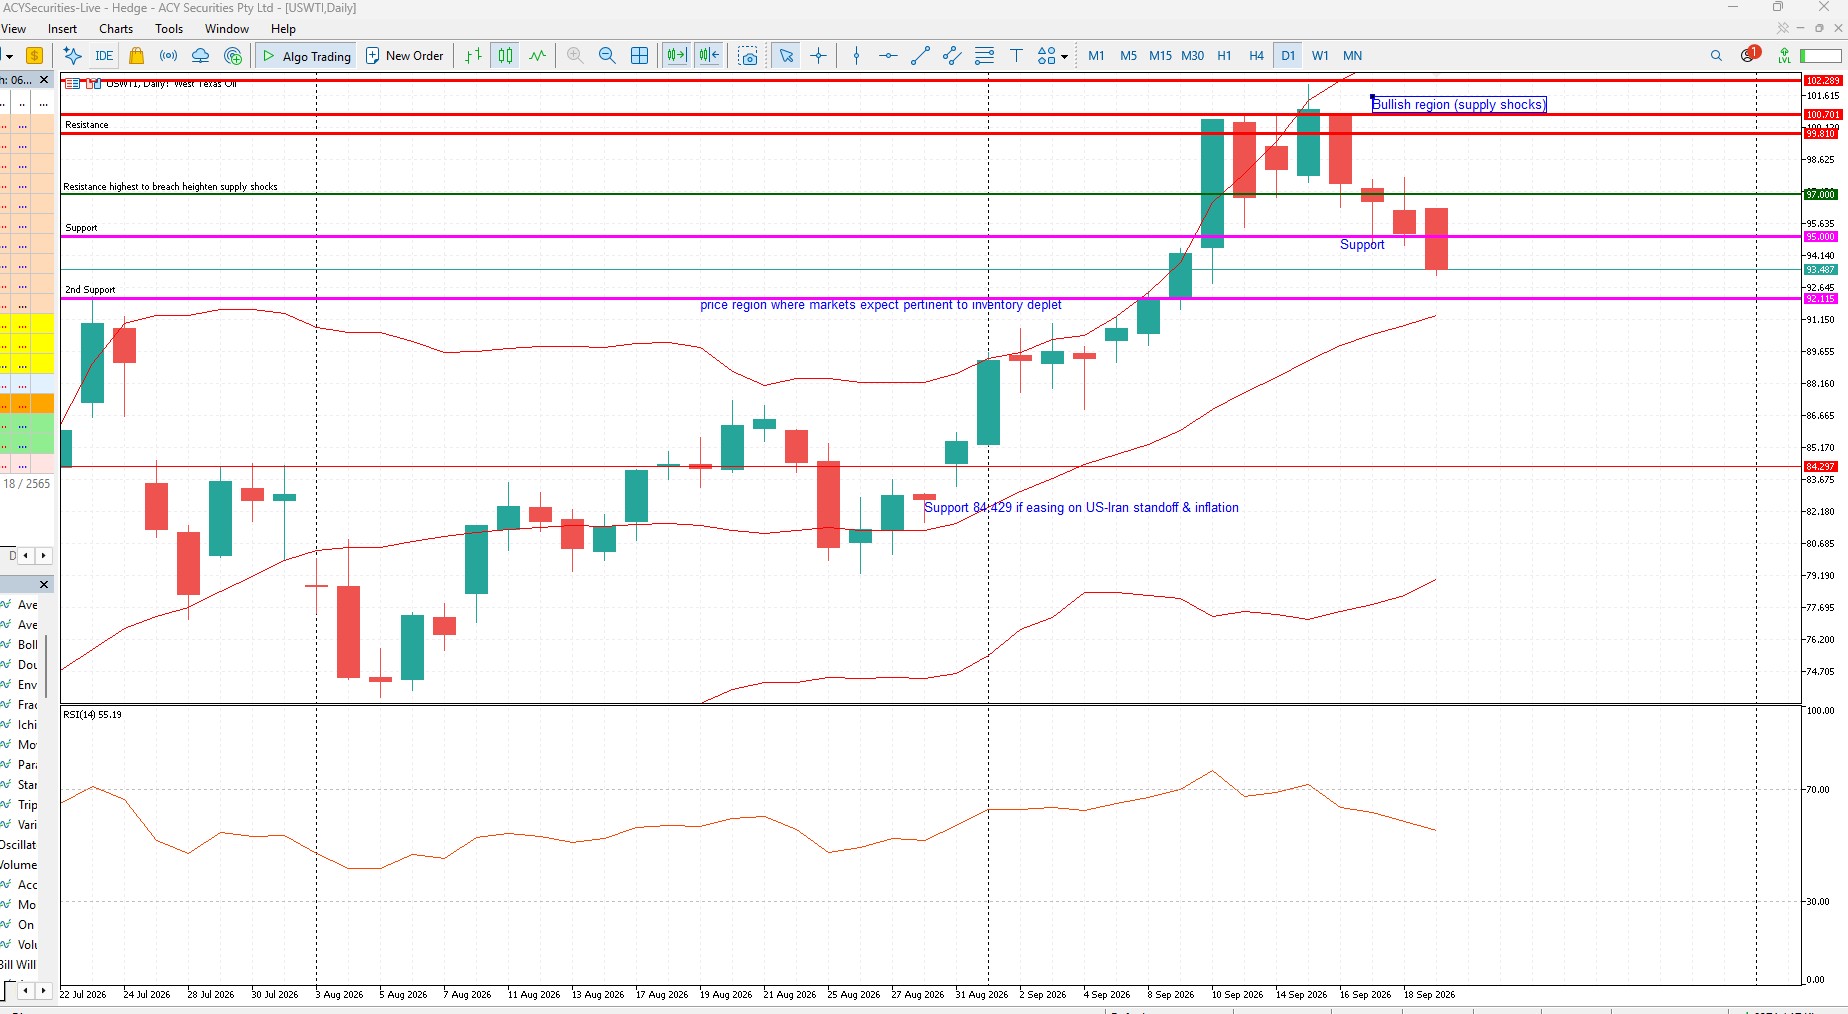
      TECHNICAL INDICATOR CONFLUENCE


      Post illustration

      Source: ACY MetaTrader5


      1. 50 Exponential Moving Average (EMA) Serves as the trend direction filter. Prices holding above the 50 EMA favor long setups, while trading below the 50 EMA signals short setups.
      2. Relative Strength Index (RSI 14) Bullish structures look for RSI pullbacks toward the 50–40 support zone, while bearish structures watch for RSI resets toward the 50–60 resistance band.
      3. Bollinger Bands Provide volatility boundaries, where price interactions with the Middle Band act as trend continuation triggers.


      The Bullish Case Geopolitical Risk Premiums and Tight Supply


      The bullish scenario posits that WTI crude oil will defend the $100 price floor and extend its trajectory higher.

      1. Geopolitical Disruption Regional conflict remains active, highlighted by missile and drone attacks targeting Saudi energy infrastructure and Riyadh. Additional geopolitical friction, including missile launches off the Korean peninsula and stepped-up security measures for critical European infrastructure, underscores ongoing threat levels to global supply lines.


      Post illustration

      Source: CNN

      Post illustration

      Source: BBC


      1. Industrial Support and Macroeconomic Triggers US capacity utilization stands firm at 76.3%, buoyed by substantial capital allocation into artificial intelligence infrastructure. Upcoming US-China presidential summit could provide renewed demand expectations if macroeconomic activity holds resilient.
      2. Technical & Inventory Realignment A bullish confirmation emerges if Wednesday's EIA report shows a net commercial inventory draw Technically, if the level maintains its position above the 50 EMA on daily charts and the Relative Strength Index resets to the 50–40 support zones, buyers may utilize the Bollinger Middle Band to drive momentum toward higher resistance levels.


      The Bearish Case: Demand Deterioration and Technical Resistance


      1. Monetary Policy Tightening and Demand Challenges: Rising energy-fueled inflation concerns have driven Treasury yields higher as the Federal Reserve advances interest rate hikes. European equities have slumped alongside rising sovereign yields amid expectations of further European Central Bank rate increases. Additionally, US manufacturing output contracted by 0.3% in August, signaling cooling industrial energy demand.
      2. Macroeconomic Uncertainty: German consumer confidence and Ifo Business Climate data may highlight lingering European economic softening. Euro Area 12-month inflation expectations have crept up to 3%, increasing the likelihood of prolonged central bank tightening that restricts economic expansion.
      3. Technical & Inventory Breakdown: A bearish trigger occurs if the EIA release indicates a surprise commercial build. If crude oil trades below its 50 EMA, with Relative Strength Index pulling up toward the 50–60 resistance range, a rejection at the Bollinger Middle Band would indicate institutional selling pressure targeting lower support levels.
      4. Resistance Levels 102.289 (Bullish region-supply shocks), 100.701, 99.810 based from 4-Hour charts.
      5. Support Levels 95.000 remain as the immediate Support, 92.115


      Disclaimer: This content may have been written by a third party. ACY makes no representation or warranty and assumes no liability as to the accuracy or completeness of the information provided, nor any loss arising from any investment based on a recommendation, forecast or other information supplies by any third-party. This content is information only, and does not constitute financial, investment or other advice on which you can rely.

      ACY Securities is one of Australia's fastest growing multi-asset online trading providers, offering ultra-low-cost trading, rock-solid execution, technologically superior account management and premium market analysis.

      This content may have been written by a third party. LiquidityFinder makes no representation or warranty and assumes no liability as to the accuracy or completeness of the information provided, nor any loss arising from any investment based on a recommendation, forecast or other information supplies by any third-party. This content is information only, and does not constitute financial, investment or other advice on which you can rely.
      Comments
      Most Recent
      Written By
      Daily Newsletter

      LF Daily News

      Daily industry focused newsletter giving you an overview for the financial & finTech industry.

      See All Newsletters
      By clicking "Sign Up" you are agreeing to our Terms of Service and Privacy Policy
      RSS Feeds

      Create a custom RSS Feed

      Select the categories and companies you wish to follow directly to your person rss feed.

      Create Custom RSS Feed

      Related Categories:

      Related Tags:

      #TradingPlatform#MarketNews#ProviderPlatforms#FinTech

      Related Articles:

      Find The Right Partners for
      Your Trading Business

      Sign up and join over 5,000 professional members who receive personalized news alerts, curated professional connections, and more for free!

      Create Your FREE Account
      Get access to latest news, updates, real-time data, brokerage and trading firm insights and customized information feeds.

      AUDCAD price forecast tracks a bullish retest of 0.99265–0.99450 toward 0.99940, with a weekly support breakdown putting 0.98740 in focus.

      just now

      Visa has received approval of its Application to Prepare from the People's Bank of China, allowing it to begin formal preparations to establish a domestic bankcard clearing institution in China. The company will now work to complete the process under PBOC regulations before starting domestic clearing operations in the country.

      just now

      Plus500 has conditionally agreed to acquire Hedge Capital Markets, an SEC-registered US broker-dealer, marking its entry into US securities. The cash-funded deal supports a planned US super-app in Q1 2027 combining futures, prediction markets, stocks, options and ETFs, plus a new hub in New York.

      just now

      MAS Markets has appointed Simon Naish as Head of APAC to lead its plans across the Asia-Pacific region. Naish brings over 30 years of experience in institutional banking and FX, most recently as Country Head at ATFX Global and previously 33 years at National Australia Bank (NAB) across Asia-Pacific and global markets.

      just now

      BTCUSD rejects $78,400–$82,175 support. Watch bullish follow-through toward $86,550 and a daily close below $80,268.75 for weakness.

      just now

      Gold price forecast: Watch $4,175–$4,190 support for bullish confirmation toward $4,265, or a weekly support breakdown toward $3,935.

      just now

      WTI crude oil price forecast: A confirmed breakout above $94.765 could open the way toward $100.305, while weekly support remains at $87.360–$90.830.

      just now

      NAS100 price forecast recap: Explore the Nasdaq 100 rally to 31,401.3, with technical analysis of the breakout and key support and resistance levels.

      just now

      Learn how to identify, draw and trade XAUUSD supply and demand zones using Gold market structure, price action confirmation and clear risk management.

      just now
      Feed