
Gold has spent the past three months being crushed by the US technology sector.
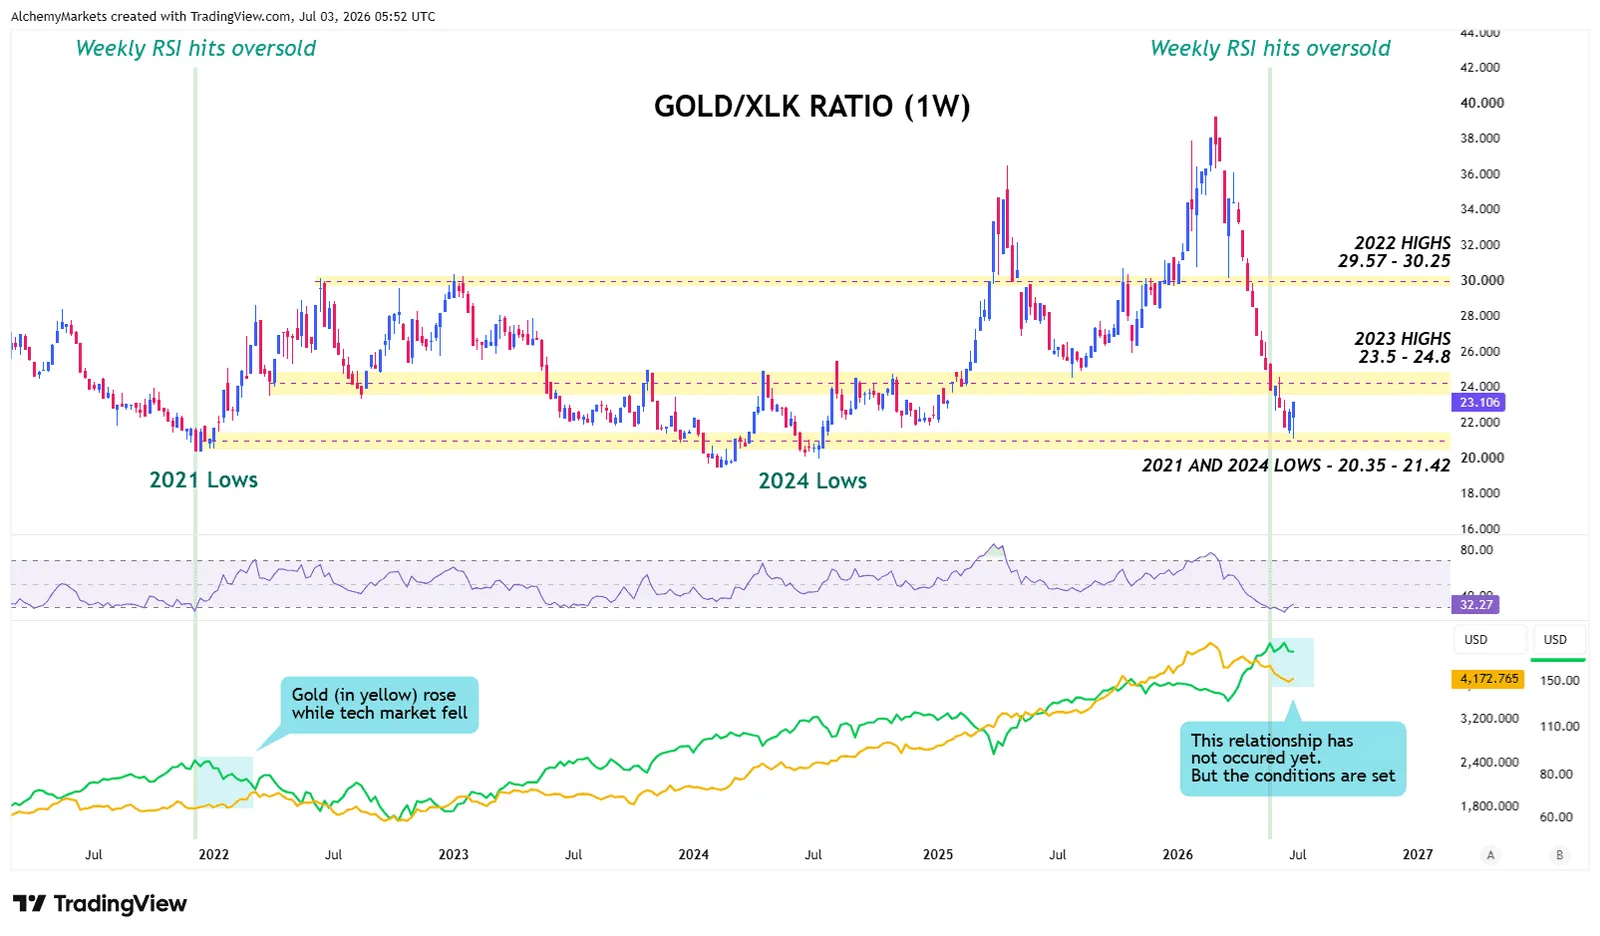
The Gold-to-XLK ratio has fallen by more than 32%, including a stretch of almost ten consecutive weekly declines. It has now returned to the same broad area that marked major relative lows in 2021 and 2024.
But now, Gold has received a fresh macro catalyst to potentially begin a recovery, while the most extended part of the technology trade is showing its first meaningful weakness in months.
That makes the Gold-to-XLK ratio chart highly interesting to watch.
Weak NFP gives gold a reason to recover
June nonfarm payrolls increased by only 57,000 against expectations of roughly 110,000, a miss of around 48%.
April and May were also revised lower by a combined 74,000 jobs. Although unemployment fell to 4.2%, labour-force participation also declined, making the headline improvement less convincing than it initially appeared.
The report does not confirm a US recession. It does, however, make it harder for the Federal Reserve to become more hawkish without another strong inflation or employment report.
Following the release, the probability of a July rate hike fell below 20%, while expectations for a September hike also eased. The dollar weakened by roughly 0.5% and spot gold gained more than 2%.
The logic is straightforward. Lower rate expectations can reduce Treasury yields and the opportunity cost of holding gold, which does not produce interest.
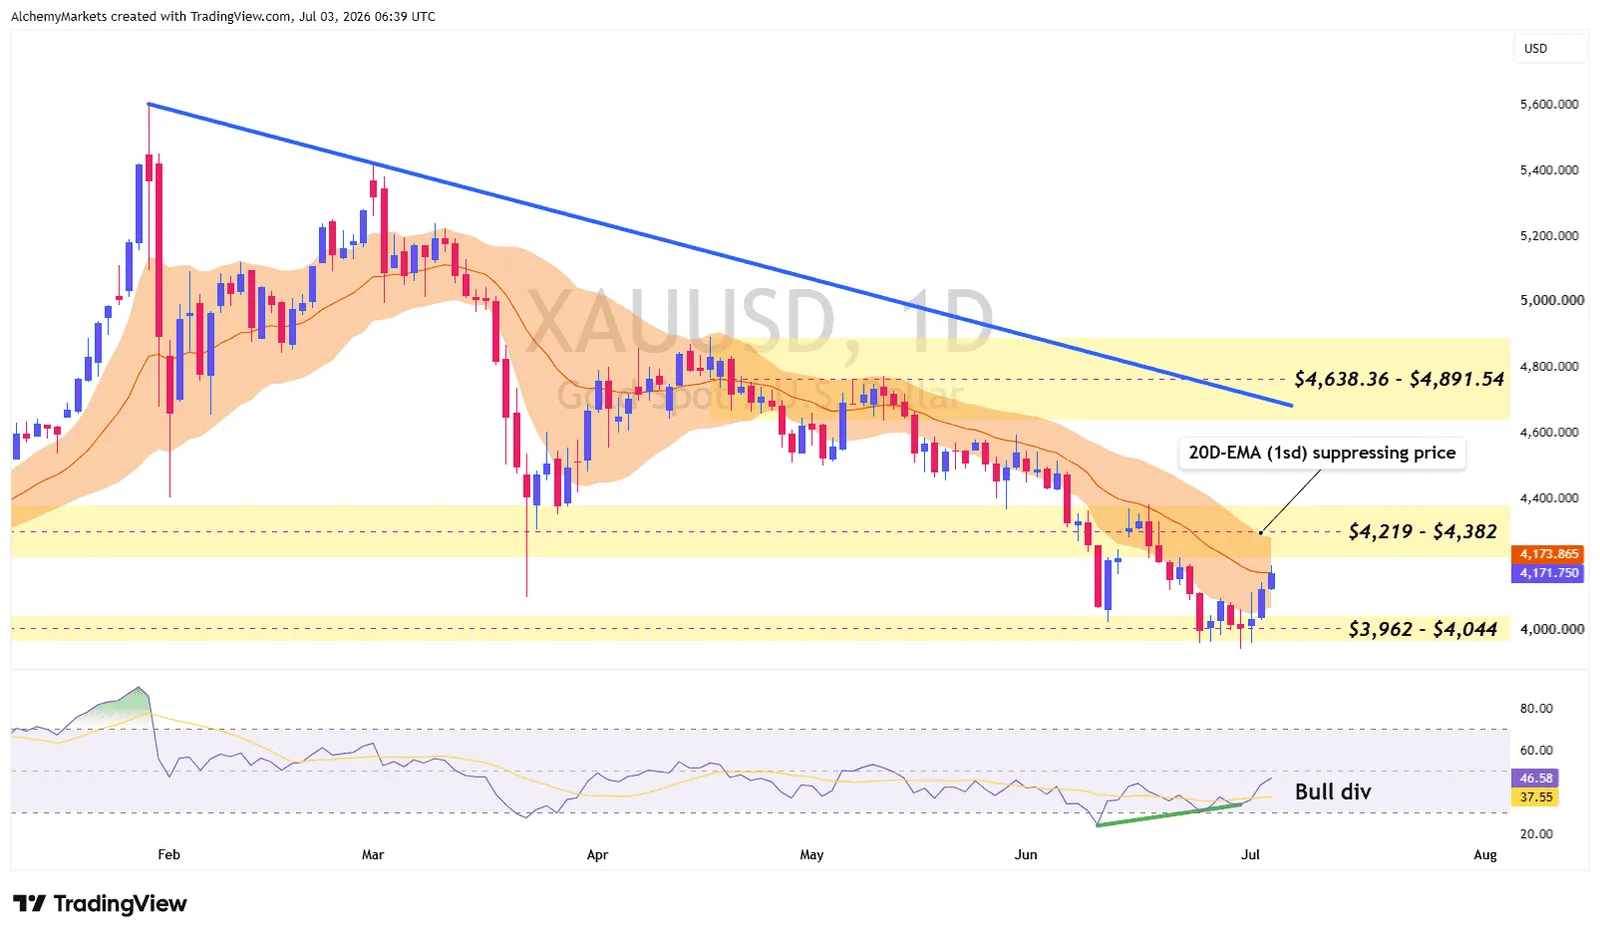
Gold is now attempting to recover above its daily 20-EMA band after responding from an important support area with a bullish divergence. This still remains an early technical signal, but after yesterday’s print, it now has a clearer macro reason behind it.
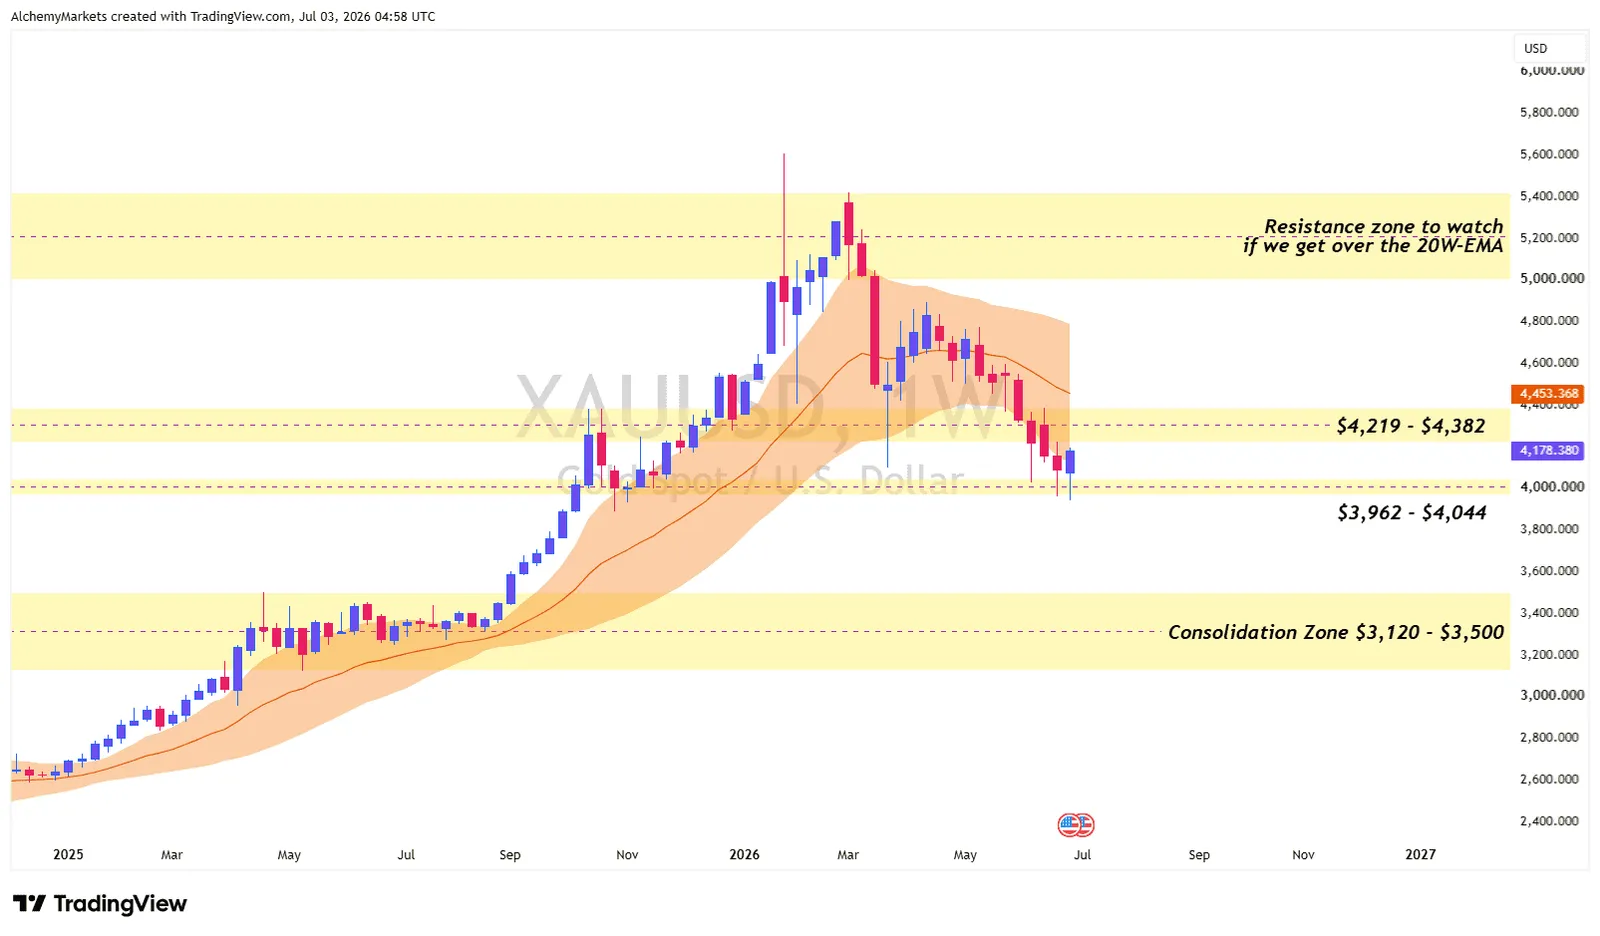
Gold is also attempting to form a bullish engulfing candle on the weekly chart. A confirmed close would strengthen the case for a near-term floor, although further follow-through would still be needed before calling it a major low.
Why technology matters to the ratio
XLK tracks the S&P 500 technology sector, but it is currently heavily influenced by AI hardware.
Semiconductors and semiconductor equipment account for almost half of the fund, followed by software and technology hardware. Major holdings include Nvidia, Apple, Microsoft, Micron, Broadcom and AMD.
This means Gold/XLK is not only measuring gold against software and mega-cap technology. It is also heavily exposed to the semiconductor cycle that previously drove much of the Nasdaq and S&P 500’s performance for the past year.
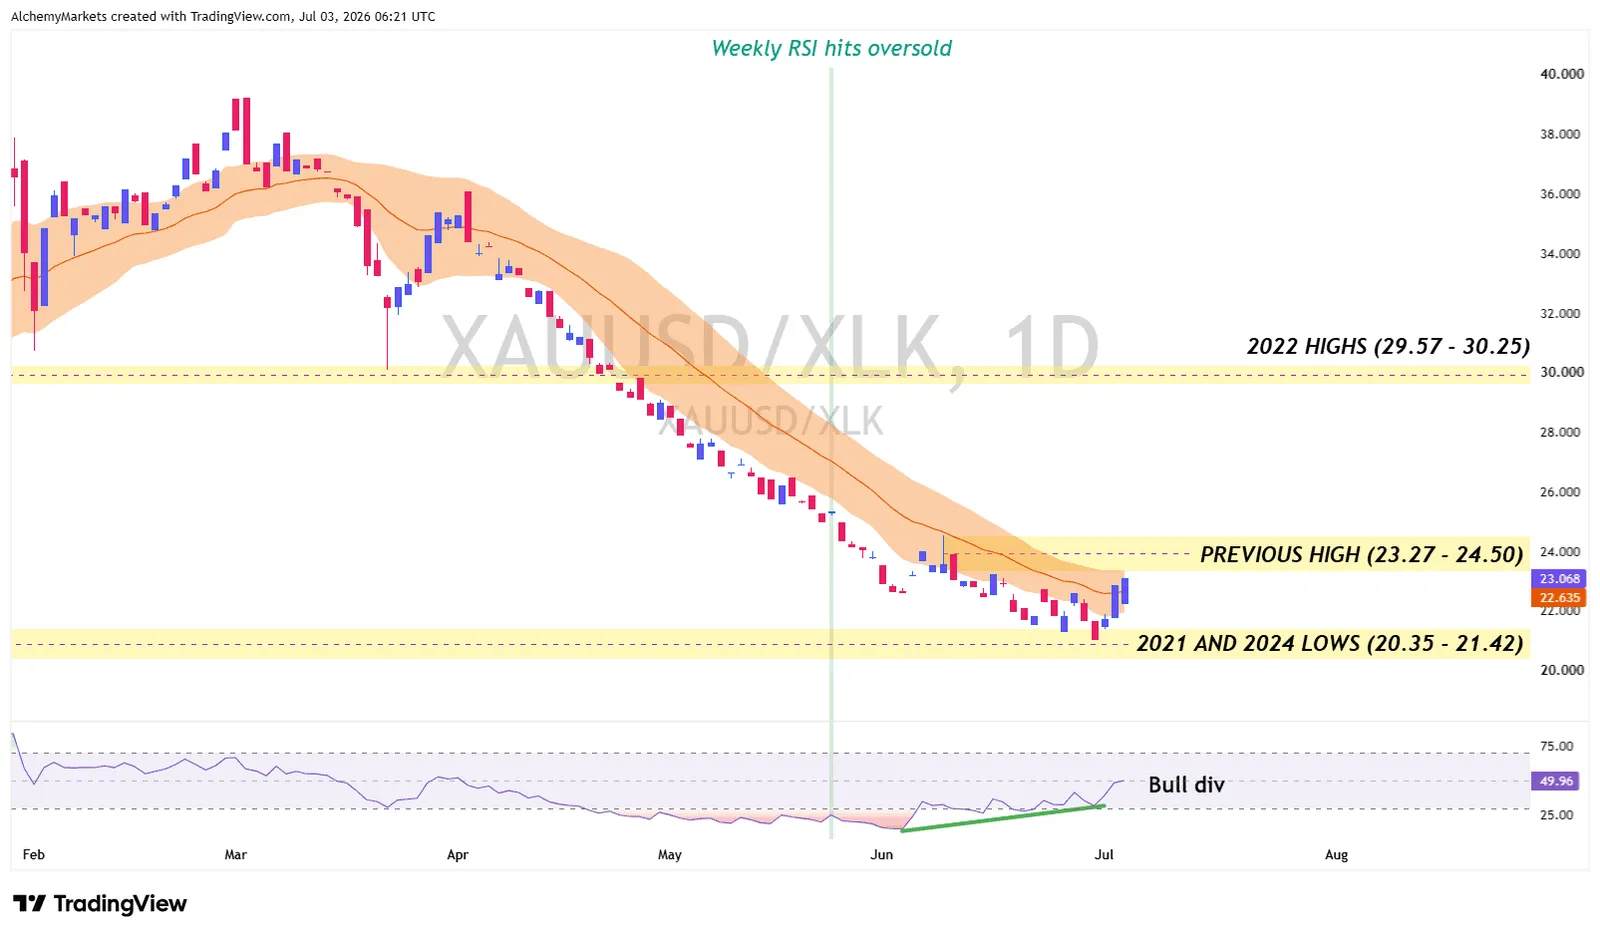
Now, that part of the market is now under pressure. Even on the daily timeframe, a bullish divergence can be observed on the Gold-to-XLK ratio.
If the ratio can reclaim its previous high and stay above that 20-EMA band, the following could be happening:
- Gold is beginning to bottom out.
- Gold is rising or moving sideways as the tech sector begins to pull back.
- Or, both assets are rising or falling together, but gold is outperforming the tech sector.
Either way, this makes for an interesting chart for goldbugs to watch. In every scenario, the common message is that gold is regaining relative strength.
A similar setup appeared in 2021, when Gold/XLK reclaimed its daily 20-EMA band as gold strengthened and technology weakened:
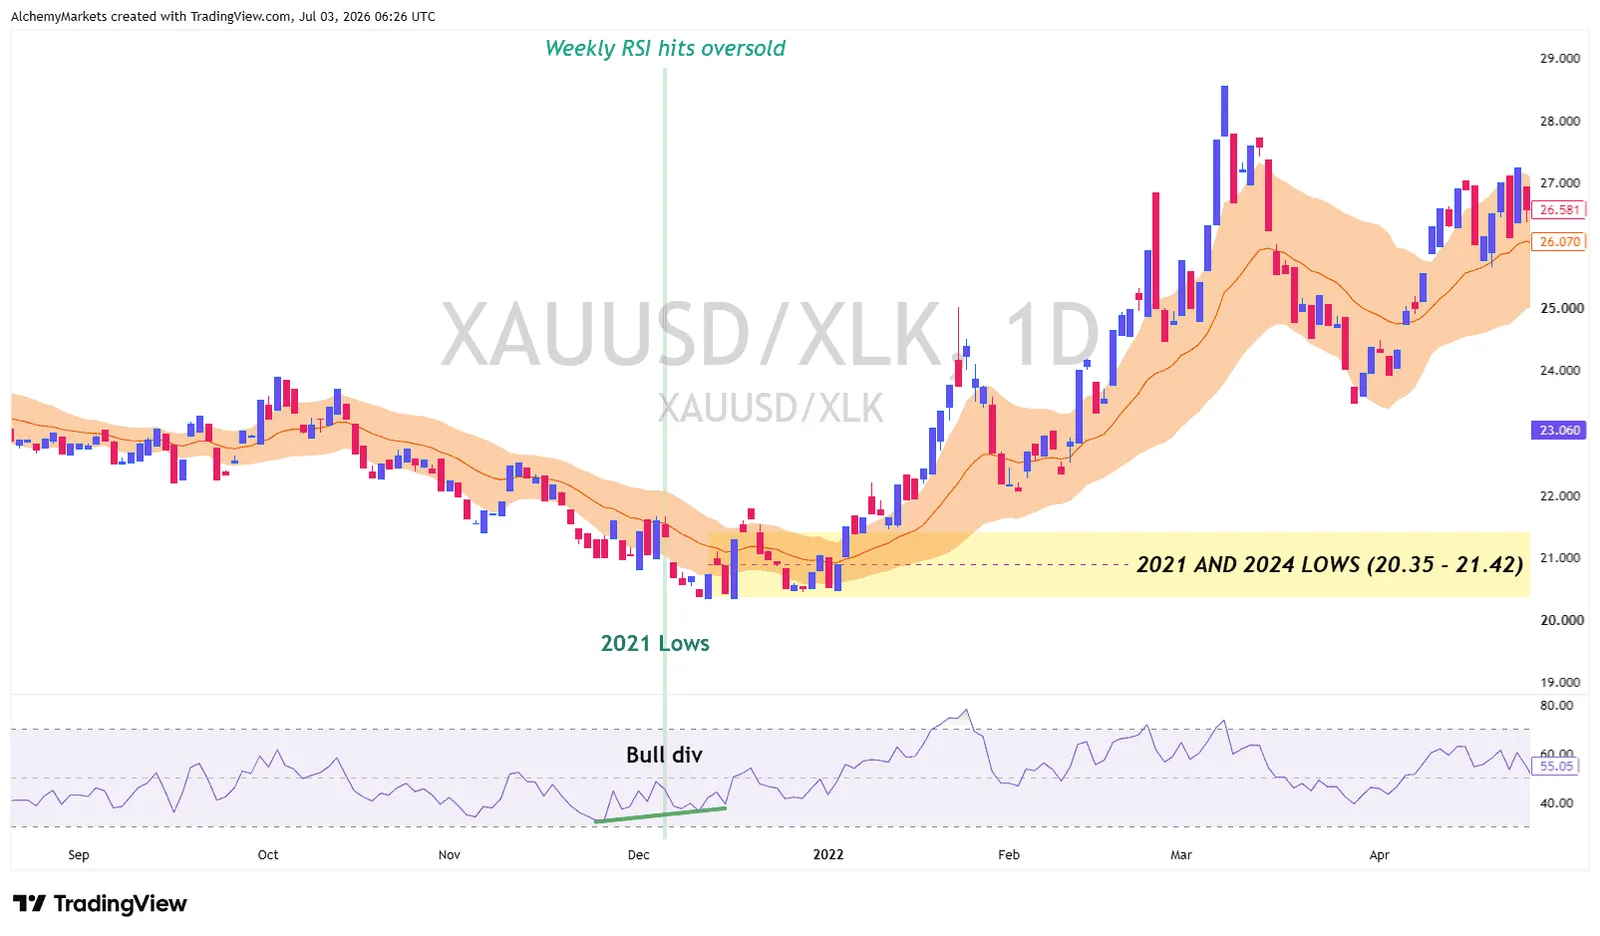
With yesterday’s shocking NFP print, one could argue that Gold is now better positioned for upside, rather than more downside - making this a possible outlook to consider.
Gold is improving fastest against semiconductors
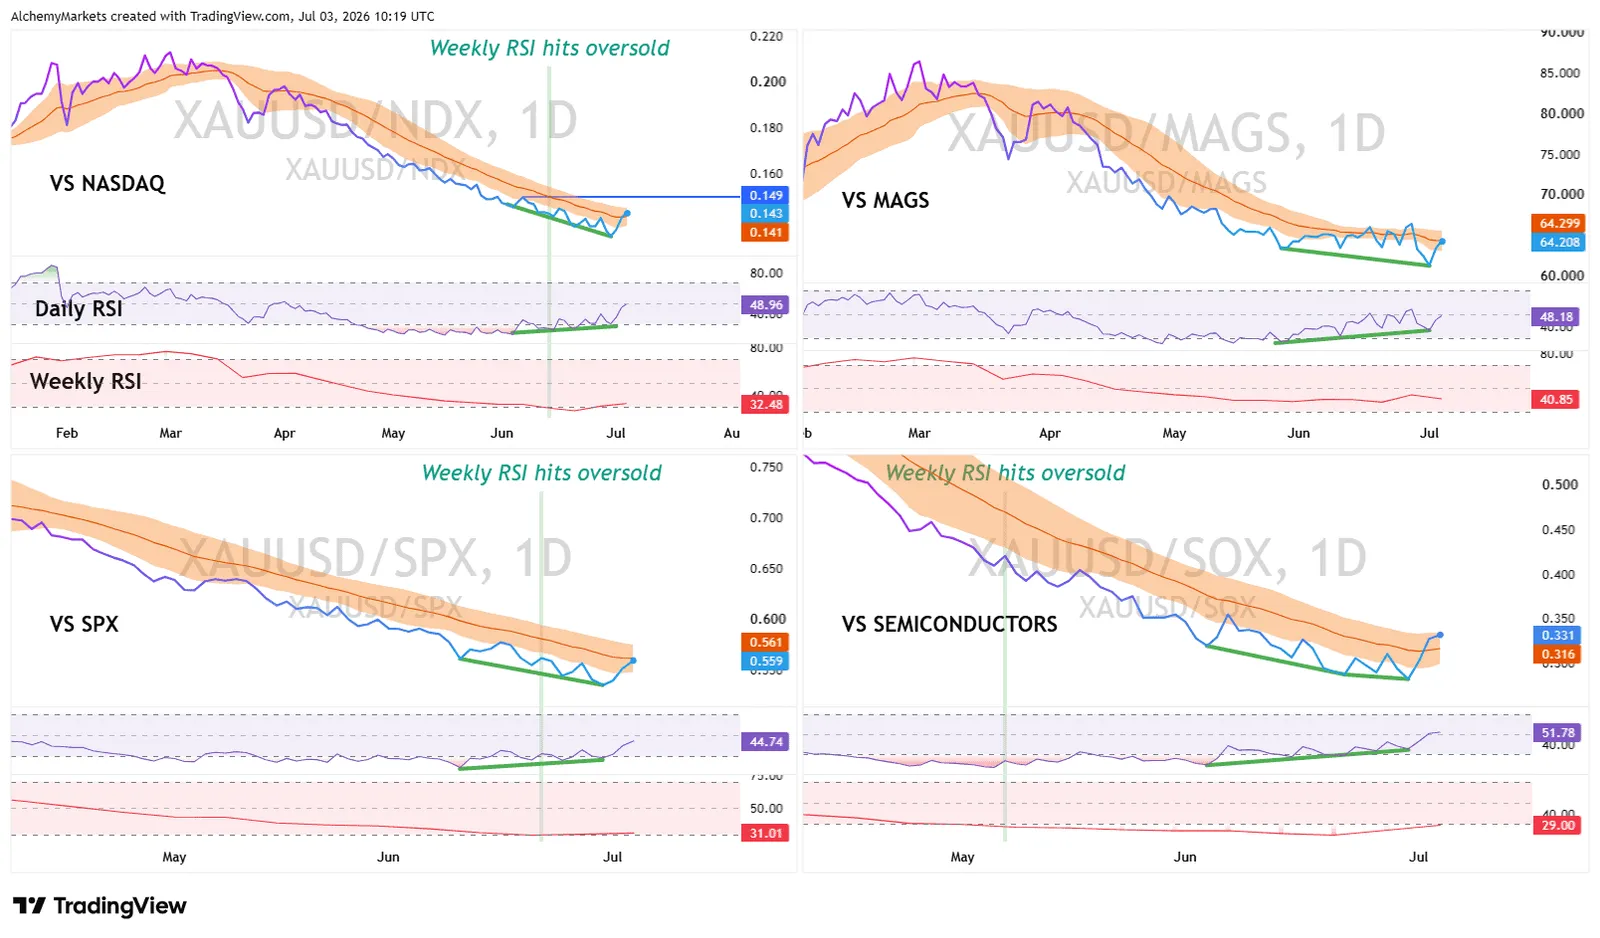
Gold’s relative recovery is also appearing against the Nasdaq-100, the Magnificent Seven, the S&P 500 and SOX...