
Search Companies, News, Members & more
Terms of ServicePrivacy PolicySecurity PolicyLegal InformationCommunity GuidelinesSitemapsCookie Settings
2026 Copyright © Liquidity Finder Ltd. All rights reserved.
Liquidity Finder Ltd is incorporated in England and Wales, company number 10610740, registered address 167-169 Great Portland Street, Fifth Floor, London W1W 5PF, United Kingdom.
Tradefora Composite Index (TCI)
Published on Mar 23, 2026
Updated on Mar 23, 2026
Spread Benchmark: Tradefora Composite Index (TCI)
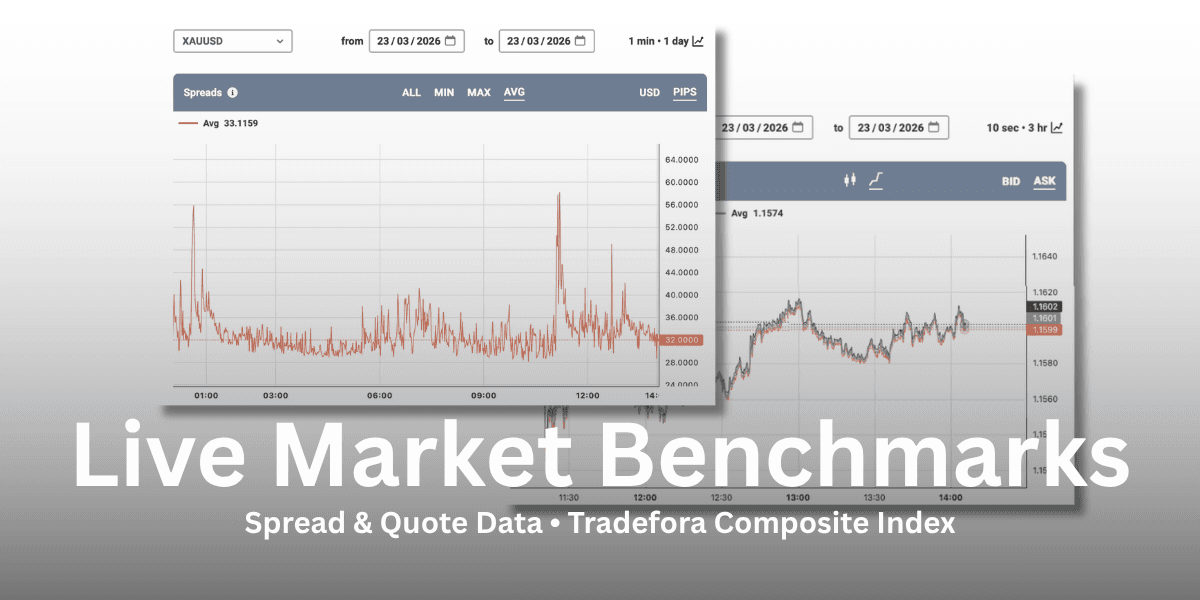
The chart below displays average aggregated spreads drawn from the Tradefora Composite Index (TCI), an independent benchmark compiled from spread data collected across multiple brokers simultaneously. This is a market-wide view, not specific to any individual broker.
Use the instrument selector to switch between currency pairs and other instruments. The timeframe can be adjusted to view spread behaviour across different market sessions. Results can be displayed as either ALL, MIN, MAX or AVG values, in both USD and pip equivalents, useful for assessing typical cost-of-trade conditions at different points in the trading day.
Data is captured at millisecond precision by Tradefora, a best execution analytics platform and RegTech 100 company, and updated continuously.
Source: Tradefora. TCI reflects aggregated average data across brokers in the Tradefora dataset. Updated continuously. Past spread data does not guarantee future trading conditions.
Quote Benchmark: Tradefora Composite Index (TCI)
This chart shows composite bid and ask quotes from the Tradefora Composite Index (TCI). Rather than reflecting a single broker's pricing, it aggregates quote data collected across the Tradefora broker dataset to produce minimum, maximum and average price lines for the selected instrument and time window.
Select your instrument and adjust the timeframe to explore how composite market pricing has moved across different sessions. Toggle between BID and ASK views using the controls within the widget. This data is particularly useful for understanding where market consensus pricing sits and how tight or wide the aggregate quote range has been.
Data is captured at millisecond precision by Tradefora and updated continuously.
Source: Tradefora. TCI reflects aggregated average data across brokers in the Tradefora dataset. Updated continuously. Past quote data does not guarantee future trading conditions.
Share this article
Comments
Most Recent
Find The Right Partners for
Your Trading Business
Sign up and join over 5,000 professional members who receive personalized news alerts, curated professional connections, and more for free!
Dark pool trading was once the preserve of institutional desks, but a new wave of AI tools is promising self-directed investors a look into non-displayed liquidity and where the big money sits. This article explains what dark pools actually are, why retail traders face an even bigger information gap in FX than in equities, and what AI-driven intelligence platforms like IUX24 can and cannot reveal about institutional positioning.
n in-depth review of TMGM (TradeMax Global Markets), the ASIC-regulated ECN broker offering raw spreads from 0.0 pips, MT4 and MT5, copy trading via HUBx and ZuluTrade, and 24/7 multilingual support across four regulated jurisdictions. Find out if TMGM belongs on your shortlist.
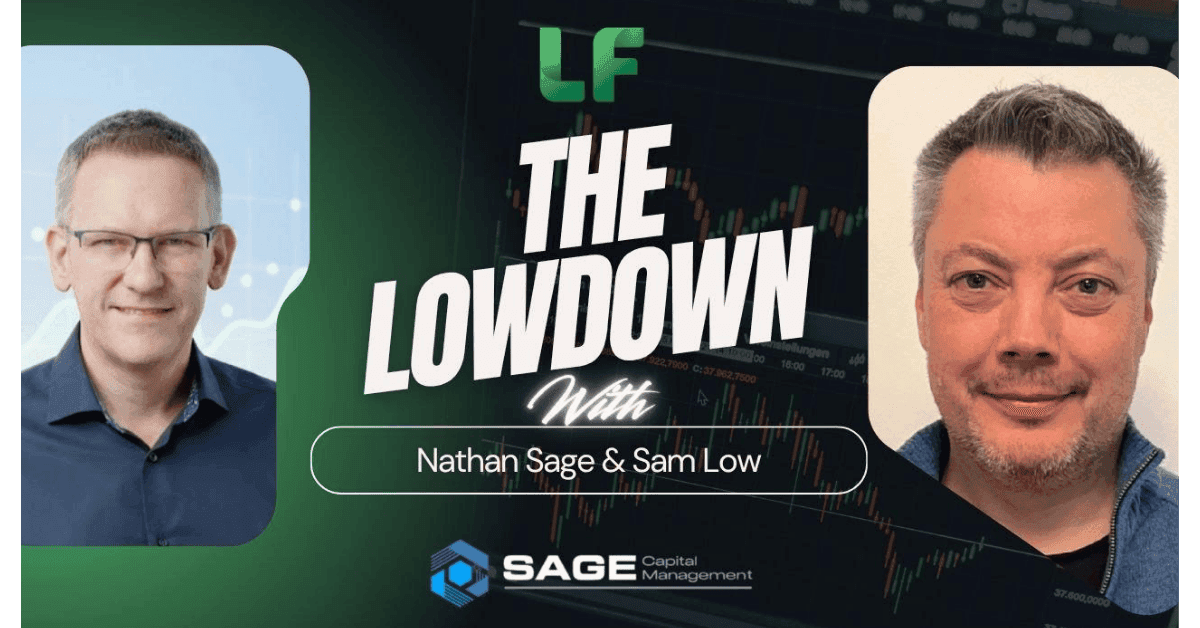
LiquidityFinder's Sam Low sits down with Nathan Sage, founder and CEO of Sage Capital Management, to trace his journey from FX fund manager to running a Bitcoin fund doing $1BN a day in 2016 — and how that experience of pain built one of the most connected prime brokerages in the digital assets market today.
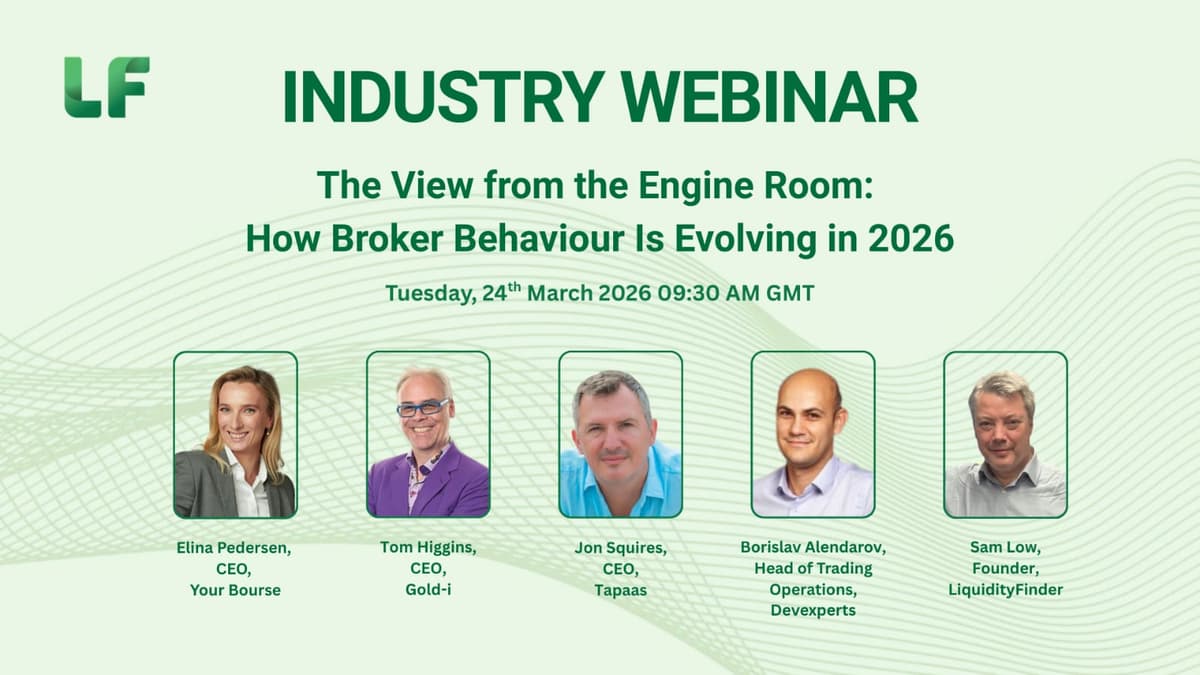
Gold at record highs, oil as a meme stock, and crypto exchanges eyeing your clients. Watch our expert panel - Gold-i, Your Bourse, Tapaas and Devexperts - discuss broker risk management, , AI trading and the MetaTrader debate.

Over a long tapas lunch in Shoreditch, London, Sam Low sits down with Peter Brooks and Jess Reed from ADMISI eFX, the dedicated electronic FX desk operating inside one of the world's largest agricultural commodities companies. What emerges is a compelling case for why this largely unknown operation deserves serious attention from brokers, payments firms, corporate treasuries, and digital asset companies alike.

In Part 6 of his A-Book STP series, Youssef Bouz from GCC Brokers looks at how the rise of algorithmic and AI-assisted trading is forcing brokers to rethink risk models, revenue strategy, and long-term sustainability, and why trader longevity, not short-term extraction, is the real measure of a resilient execution business.

Fusion Capital is a specialist crypto liquidity provider offering brokers over 350 crypto CFD pairs with bespoke pricing, pure A-book execution, and access to decentralised exchange liquidity through Hyperliquid. In this broker profile, LiquidityFinder's Sam Low speaks with Head of Product Jasper Cooney about how Fusion's in-house trading bots monetise flow across centralised and decentralised venues, why crypto exchanges handle toxic flow differently to FX, and how brokers can now offer clients pre-IPO perpetual futures through their existing MT5 infrastructure.
In Part 5 of his A-Book STP series, Youssef Bouz from GCC Brokers provides a guide to distinguishing healthy algorithmic trading from latency arbitrage and structural abuse — and why behavior, not profitability, is the real risk indicator.
Create Your FREE Account
Get access to latest news, updates, real-time data, brokerage and trading firm insights and customized information feeds.

Running a venue around the clock is the easy part. Pricing risk when the market underneath it is shut is not. Lars Holst, CEO of GCEX explains how to manage risk in 24/7 markets.

ATFX has released its Q4 2026 Trader Magazine, offering a closer look at the macroeconomic and market forces that could shape trading conditions in the final quarter of the year.


LSEG has announced a collaboration with NVIDIA that lets financial institutions analyse years of LSEG Tick History data in seconds using NVIDIA cuDF on GPUs, without creating another full copy of the dataset. Tick History holds 110 trillion rows across 100 million instruments and more than 580 venues and contributors.

Standard Chartered has launched a cryptocurrency trading solution letting eligible affluent clients buy and sell Bitcoin and Ether through existing bank accounts. Built with Zodia Markets and regulated by VARA, it launches first for Professional Investor clients in the UAE, with other markets to follow over time.


WTI crude oil breaks above daily resistance after rejecting weekly support. Explore key price levels, breakout confirmation, and the potential 100.305 target.

IG Prime has confirmed Investec Prime Services as a new partner for its institutional white label solution, giving institutional clients in South Africa access to IG’s multi-asset global trading platform under the Investec Prime Services brand. The offering spans equities, indices, FX, commodities and fixed income.


PLUGIT announcing a new YOONIT UX/UI experience coming across all six modules.


The AI conversation in brokerage risk management is mostly led by vendors. Here is what a dealing desk actually needs to know — before signing anything.


The cost of capital is becoming a defining force in global markets. But are investors pricing in the full impact? With the Fed's policy outlook under scrutiny, major bank and semiconductor earnings approaching, and key inflation data on the horizon, markets face a critical week. In this week's BitDelta Pro Weekly Outlook, we explore the signals shaping market expectations and the factors that could challenge the prevailing narrative.

September's US inflation report could be a defining moment for the Federal Reserve's next interest rate decision. With headline inflation expected to accelerate while core inflation remains steady, the growing divergence raises an important question: Is inflation pressure becoming more widespread, or is energy driving the narrative? Ahead of the October 14 CPI release, BitDelta Pro Research examines the forces shaping inflation expectations, the signals policymakers may prioritise, and what the data could mean for the Fed's next move.
Feed