
just now


Liquidity Finder Ltd is incorporated in England and Wales, company number 10610740, registered address 167-169 Great Portland Street, Fifth Floor, London W1W 5PF, United Kingdom.
Published: just now


The AUDCAD price forecast remains bearish as the weekly and daily charts show rejection at former support, now acting as resistance. Bearish market structure and daily price trading below the 50 EMA suggest sellers continue to limit recovery attempts.
The 0.98500–0.98750 resistance zone is the main area to monitor. A retest followed by bearish candlestick confirmation could strengthen the case for a decline toward 0.97900.
Alternatively, a confirmed breakout above 0.98750, followed by a successful retest of the zone as support, could support a recovery toward 0.99100.

Weekly Timeframe Price Action Analysis: AUDCAD Rejects Former Support as the Bearish Trend Continues.
The weekly AUDCAD chart remains in a clear bearish trend following a break below a major area of weekly and daily support. Price is now rejecting that former support area, suggesting sellers are defending it as resistance.
Understanding market structure alongside support and resistance helps explain this shift. An area that previously attracted buyers can become a barrier to recovery after price breaks below it.
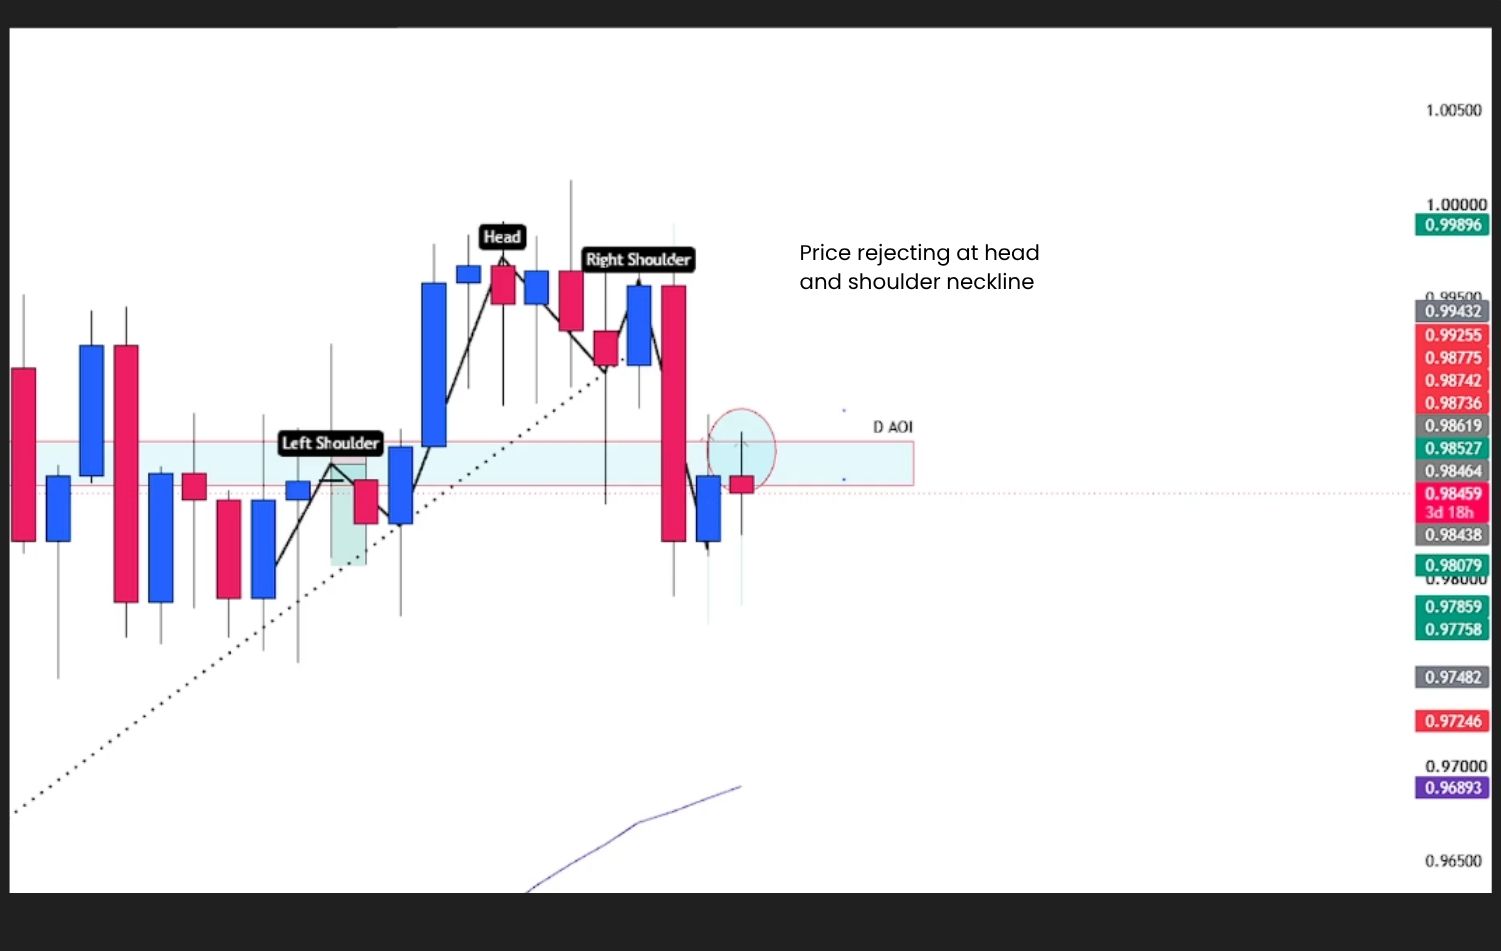
Weekly Timeframe Price Action Analysis: Rejecting Head and Shoulder Neckline
The weekly chart observations also identify rejection around a head-and-shoulders pattern. A rejection at the broken neckline would reinforce the bearish interpretation by showing that buyers have failed to reclaim the pattern’s breakdown level.
Key weekly observations include:

Daily Timeframe Price Action Analysis: AUDCAD Rejects Weekly and Daily Resistance While Trading Below the 50 EMA.
The daily AUDCAD chart also shows bearish market structure, aligning with the weekly outlook. Strong rejection at the 0.98500–0.98750 weekly and daily resistance zone suggests recovery attempts are encountering selling pressure.
The 50-period exponential moving average, or 50 EMA, remains above price, adding support to the bearish bias. This means price is trading below its recent weighted average, which is consistent with weaker momentum. However, the EMA alone does not confirm that another decline will follow.
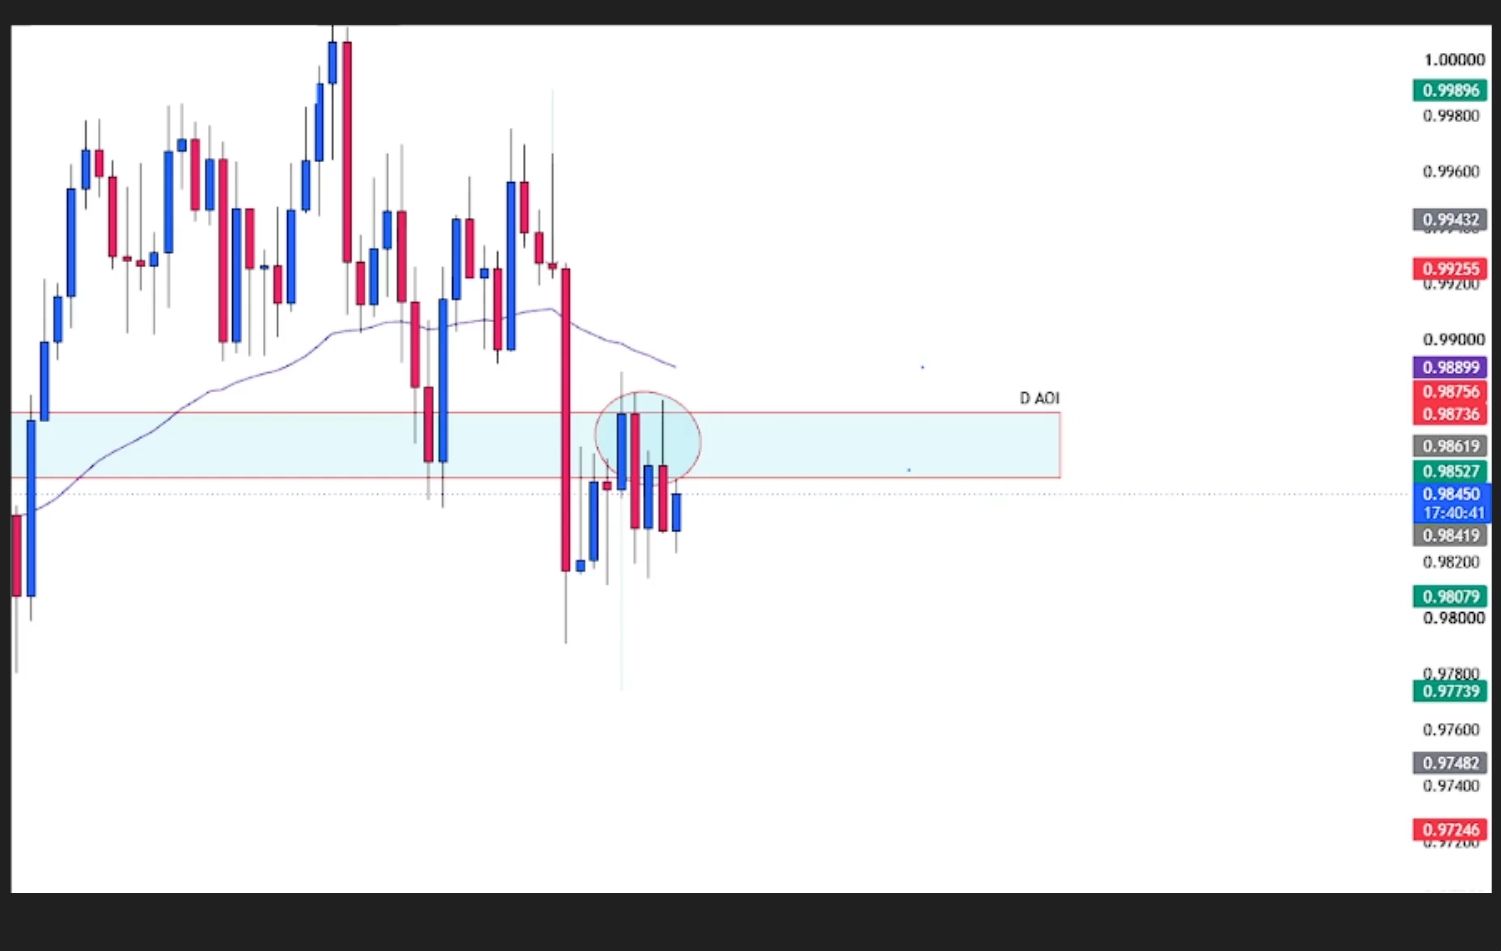
Weekly Timeframe Price Action Analysis: Rejecting Weekly and Dailiy Resistance
The next important development is how price responds to resistance. A completed bearish rejection candle followed by further downside would strengthen the continuation scenario. A sustained move above the zone would challenge it.
For beginners, the key question is straightforward: Can sellers keep defending resistance, or will buyers reclaim it as support?
| Technical Level | Significance |
| 0.98500–0.98750 | Former weekly and daily support, now acting as resistance |
| 0.98500 | Lower boundary of the resistance zone |
| 0.98750 | Upper boundary buyers need to clear for the bullish scenario |
| 0.97900 | Potential downside target after confirmed bearish rejection |
| 0.99100 | Potential upside target after a confirmed breakout and support retest |
A move into resistance does not automatically confirm a bearish entry. The completed candle and subsequent price movement provide stronger evidence of whether sellers are defending the area.
Likewise, a brief move above 0.98750 would not be enough to establish a bullish breakout. A decisive daily close above the zone, followed by a successful support retest, would provide stronger confirmation.

Daily Timeframe Price Action Analysis: Bearish Rejection at 0.98500–0.98750 Could Support a Decline Toward 0.97900.
The bearish scenario follows the current weekly and daily trend.
AUDCAD would need to retest 0.98500–0.98750 from below and fail to reclaim the zone. A completed bearish rejection candle would suggest sellers are continuing to defend resistance.
Learning to assess candlestick confirmation at key levels helps distinguish a temporary reaction from a more developed setup.
Further downward movement after the rejection would strengthen the case for a potential decline toward 0.97900.

Daily Timeframe Price Action Analysis: Conditional Bearish Objective
Bearish confirmation sequence: Resistance retest → bearish candle close → downward follow-through.
A sustained recovery above 0.98750, followed by a successful support retest, would weaken this bearish setup.

Daily Timeframe Price Action Analysis: A Confirmed Breakout Above 0.98750 and Support Retest Could Bring 0.99100 Into Focus.
The bullish scenario requires AUDCAD to overcome the 0.98500–0.98750 resistance zone.
A decisive daily close above 0.98750 would suggest buyers are beginning to challenge selling pressure. Price would then need to return to the former resistance zone and hold it as support.
This break-and-retest price action pattern helps assess whether buyers can defend the reclaimed area after the breakout.
A completed bullish rejection candle during the retest, followed by upward movement, could support a recovery toward 0.99100.

Daily Timeframe Price Action Analysis: Conditional Bullish Objective
Bullish confirmation sequence: Resistance breakout → support retest → bullish candle close → upward follow-through.
If price briefly breaks above resistance but falls back below 0.98500, the bullish setup would weaken. This scenario initially represents a recovery against the bearish weekly trend; it would not automatically confirm a complete trend reversal.
AUDCAD’s bearish weekly and daily structure, resistance rejection and position below the daily 50 EMA keep attention on 0.98500–0.98750.
A failed retest followed by bearish candlestick confirmation would strengthen the downside scenario toward 0.97900. A daily close above 0.98750, followed by a successful support retest, could instead support a recovery toward 0.99100.
Both targets remain conditional. Planning take-profit targets using market structure and risk-reward helps connect these price objectives to a defined trading plan.
Watch the levels. Wait for the retest. Let price confirm the direction.
_____________________________________________________________________________________
Move from learning price action to applying it in the real market.
Trade:
Access trading platforms and tools including ACY, MT4, MT5, and Copy Trading.
Create an Account and Start Live Trading
_____________________________________________________________________________________
Build your trading foundation with these step-by-step guides:
Learn to read price action and assess trading setups at key levels:
Learn to recognize bullish, bearish and sideways markets:
Learn to mark key levels and interpret price reactions:
Understand recurring price patterns, retests and false breakouts:
Learn to combine candlestick signals with price action analysis:
Learn to recognize patterns that may signal a change in market direction:
Explore how to combine the exponential moving average with price action:
Bring your technical analysis skills together through a gold swing trading guide:
Learn how risk management and position sizing fit into your trading plan:
Learn how to plan take-profit targets using market structure and risk-reward:
Develop discipline, emotional awareness and a more consistent trading process:
Explore the psychological habits behind a disciplined trading approach:
_____________________________________________________________________________________
Not sure where to begin? Here’s a simple roadmap to guide you:
By building step by step; from basics → real trading → mastering the craft, you’ll gain clarity, confidence, and steady progress without ever feeling overwhelmed.

_____________________________________________________________________________________
Follow Ruffy Grant B. Capacio for Gold analysis, Forex trading ideas, price action education, trading psychology, and market insights: LinkedIn
ACY Securities: Join the Discord Server
Disclaimer:
Trading Forex, Gold, CFDs, cryptocurrencies, commodities, indices, and other leveraged financial instruments involves a high degree of risk and may not be suitable for all investors or traders. Market conditions can change rapidly, and leveraged trading can result in losses that occur quickly.
Before trading, carefully consider your investment objectives, level of experience, and risk tolerance. Only trade with capital you can afford to lose and seek independent financial or professional advice where appropriate.
All market analysis, price forecasts, technical commentary, trading scenarios, educational materials, and opinions presented in this content are provided solely for general informational and educational purposes. They do not constitute financial advice, investment advice, a recommendation, solicitation, or an offer to buy or sell any financial instrument.
Past performance and historical price movements are not reliable indicators of future results. Any price levels, targets, scenarios, or market outlooks discussed should be viewed as analysis rather than guarantees of future market performance. October 27, 2026
ACY Securities is one of Australia's fastest growing multi-asset online trading providers, offering ultra-low-cost trading, rock-solid execution, technologically superior account management and premium market analysis.

Select the categories and companies you wish to follow directly to your person rss feed.
Create Custom RSS FeedSign up and join over 5,000 professional members who receive personalized news alerts, curated professional connections, and more for free!
CMC Markets, a FTSE 250 multi-asset financial services firm, has named two-time heavyweight world champion Anthony Joshua a global ambassador in a 12-month partnership. CMC branding will appear on Joshua’s fight-night clothing for his 11 December bout with Tyson Fury at Cardiff’s Principality Stadium.
One company is setting the tone for the whole market. Nvidia reports on Tuesday, its first results since Jensen Huang resigned as CEO and left the board on November 12, after 33 years in charge. Two days later, Anthropic begins trading on Nasdaq in one of the largest listings ever. In between, the Fed's minutes and a 10-year Treasury yield back above 5% will remind investors that the cost of capital has not gone away.
Nasdaq is showing a clearly bearish short-term structure on the 1-hour chart. The recent low at 27,133 is the immediate support, while the broader decline from 28,535 confirms that sellers remain in control. The moving averages MA5, MA10 and MA20, with price trading below all three.
Dave Inc. has filed an application with the OCC and FDIC to establish Dave Bank, N.A., an insured national bank that would offer deposit accounts, ExtraCash liquidity and Dave Flex credit under direct OCC supervision. It has also appointed Anthony Sharett, formerly President of Pathward, as Chief Banking Officer.
U.S. stock futures are mixed this morning after a sharp sell-off on Wall Street in yesterday's session, with investors focused on Nvidia ahead of its earnings report. Nvidia fell 4.1% on Monday, dragging down other AI-related stocks such as AMD, Micron and Sandisk.
Charles Schwab has launched a Model Context Protocol (MCP) server that lets clients connect their own AI platforms to their Schwab accounts.
Gold remains under significant selling pressure. with price now around $3,840. The 1-hour chart confirms the bearish momentum, with price recently breaking below the $3,870 area.
US stock futures are pointing lower at the start of the week, as investors remain cautious following a volatile week on Wall Street, with all eyes now on Nvidia’s highly anticipated earnings report and the latest developments in the AI sector.
CMC Markets has become the first UK-regulated broker to offer options on pre-IPO grey markets, launching with Anthropic. Clients can buy European-style, cash-settled call and put options, with the premium capping losses. The product is live for UK clients from today, with a wider global rollout planned.
Thunes has expanded its Direct Global Network into Bhutan, enabling digital banks, MTOs and remittance providers to send real-time C2C payouts to all licensed bank accounts in the country, so Bhutanese living abroad can send funds home in Ngultrum in seconds. Personal remittances to Bhutan grew 69% from 2024 to 2025.