
just now


Liquidity Finder Ltd is incorporated in England and Wales, company number 10610740, registered address 167-169 Great Portland Street, Fifth Floor, London W1W 5PF, United Kingdom.
Published: just now


Gold (XAUUSD) reached $3,880, completing the bearish target outlined in the November 11 forecast.
The original analysis identified a bearish weekly outlook, supported by a consolidation breakdown, rejection around resistance and price below the 50-week EMA. However, the daily chart had reclaimed $4,000–$4,100 as support, so the bearish plan required fresh confirmation.
The forecast focused on a breakdown below $4,000, followed by a failed retest of $4,000–$4,100 and bearish follow-through. Here is why the sell scenario was anticipated and how the original confirmation process was structured.

Weekly Price Action Analysis: Gold Broke Below Consolidation, Supporting the Bearish Weekly Outlook.
The weekly chart showed Gold breaking below an earlier consolidation area, a range where price had been moving sideways. Losing that range suggested buyers were struggling to defend previous support.
Recovery attempts also met rejection around weekly resistance. This supported the view that sellers remained active when price moved higher.

Weekly Price Action Analysis: Gold Traded Below the 50-Week EMA as Rejection Around the Head-and-Shoulders Area Reinforced the Bearish Bias.
Gold traded below the 50-week EMA, adding support to the bearish reading. Rejection around the identified head-and-shoulders area provided further context, although the analysis did not establish an exact neckline or measured-move target.
Why this mattered: Several weekly observations supported the same bearish scenario. They provided a reason to prepare for further weakness, while the daily chart determined what confirmation was still needed.

Daily Price Action Analysis: Gold Reclaimed $4,000–$4,100 as Support, Leaving the Bearish Setup Dependent on a Fresh Breakdown.
At the time of the forecast, Gold had recovered above $4,000–$4,100, restoring the zone as daily support.
That recovery meant sellers had not yet completed the forecast’s bearish setup. Selling solely because the weekly chart was bearish would have ignored the buying response on the daily chart.

Original Bearish Scenario: A Breakdown Below $4,000 and Failed Retest of $4,000–$4,100 Targeted a Decline Toward $3,880.
The plan therefore required Gold to lose support again. A subsequent retest would help assess whether buyers could reclaim the zone or sellers could defend it as resistance.
Why this mattered: The weekly chart supplied the bearish context. The daily support zone supplied the condition needed to develop the sell setup.
This relationship is central to combining market structure with support and resistance.
The following steps explain the original trade plan. Gold’s reported move to $3,880 establishes the target outcome; it does not, by itself, verify each intervening candle or retest.
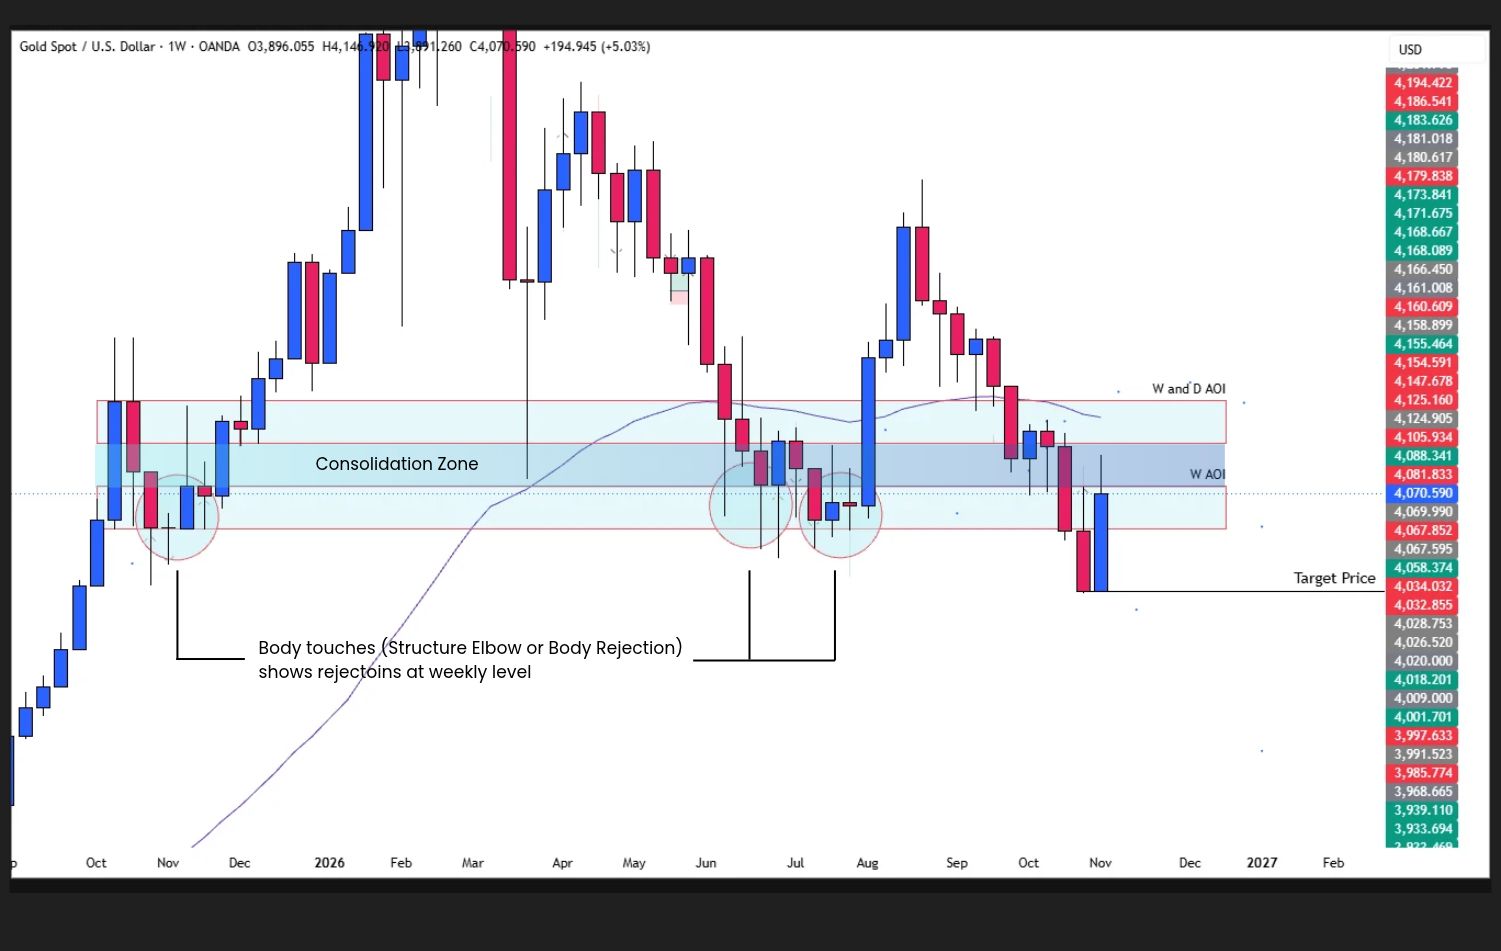
Step 1 — Mark Key Levels: Gold’s Sell Plan Focused on $4,000–$4,100 Support and the $3,880 Downside Target.
The bearish plan centered on these key Gold support and resistance levels:
| Gold price levelRole in the original sell plan | |
| $4,000–$4,100 | Reclaimed support; potential resistance after a breakdown |
| $4,000 | Daily closing threshold required to begin confirmation |
| $3,880 | Original bearish target—reached |
The full support zone mattered. A move into the zone alone would not establish that buyers had lost control of it.
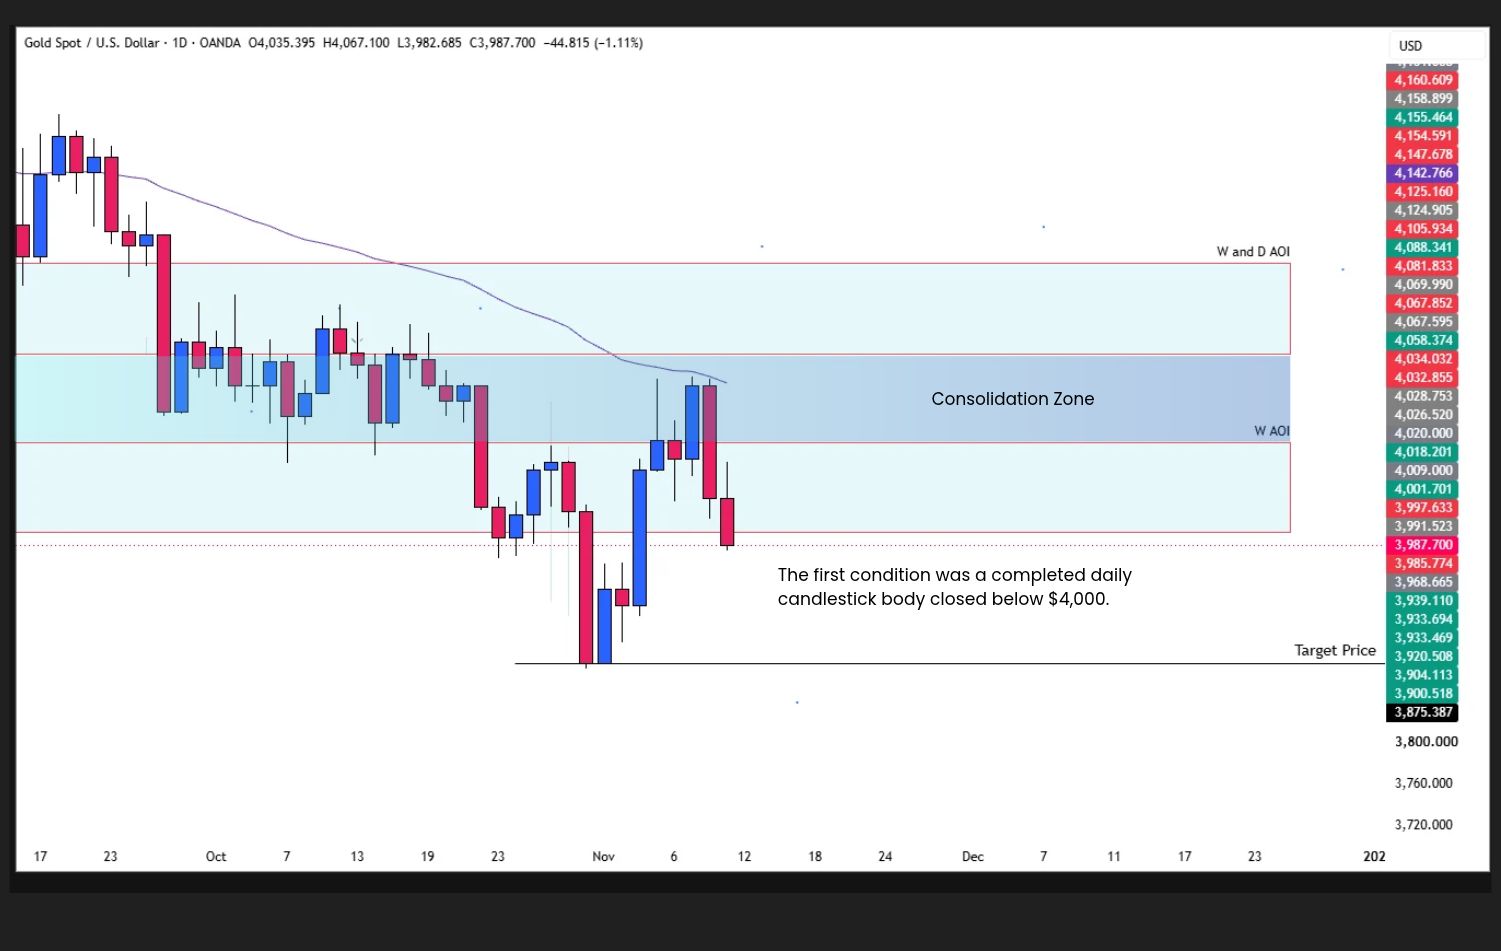
Step 2 — Confirm the Breakdown: The Original Setup Required a Completed Daily Candle Close Below $4,000.
The first condition was a completed daily candlestick body closed below $4,000.
This would show that price had closed below the lower boundary of support. A temporary move below the level during the day would not satisfy the original rule. Waiting for the close helps assess the risk of a false breakout.
Purpose: Identify a breakdown before looking for continuation.
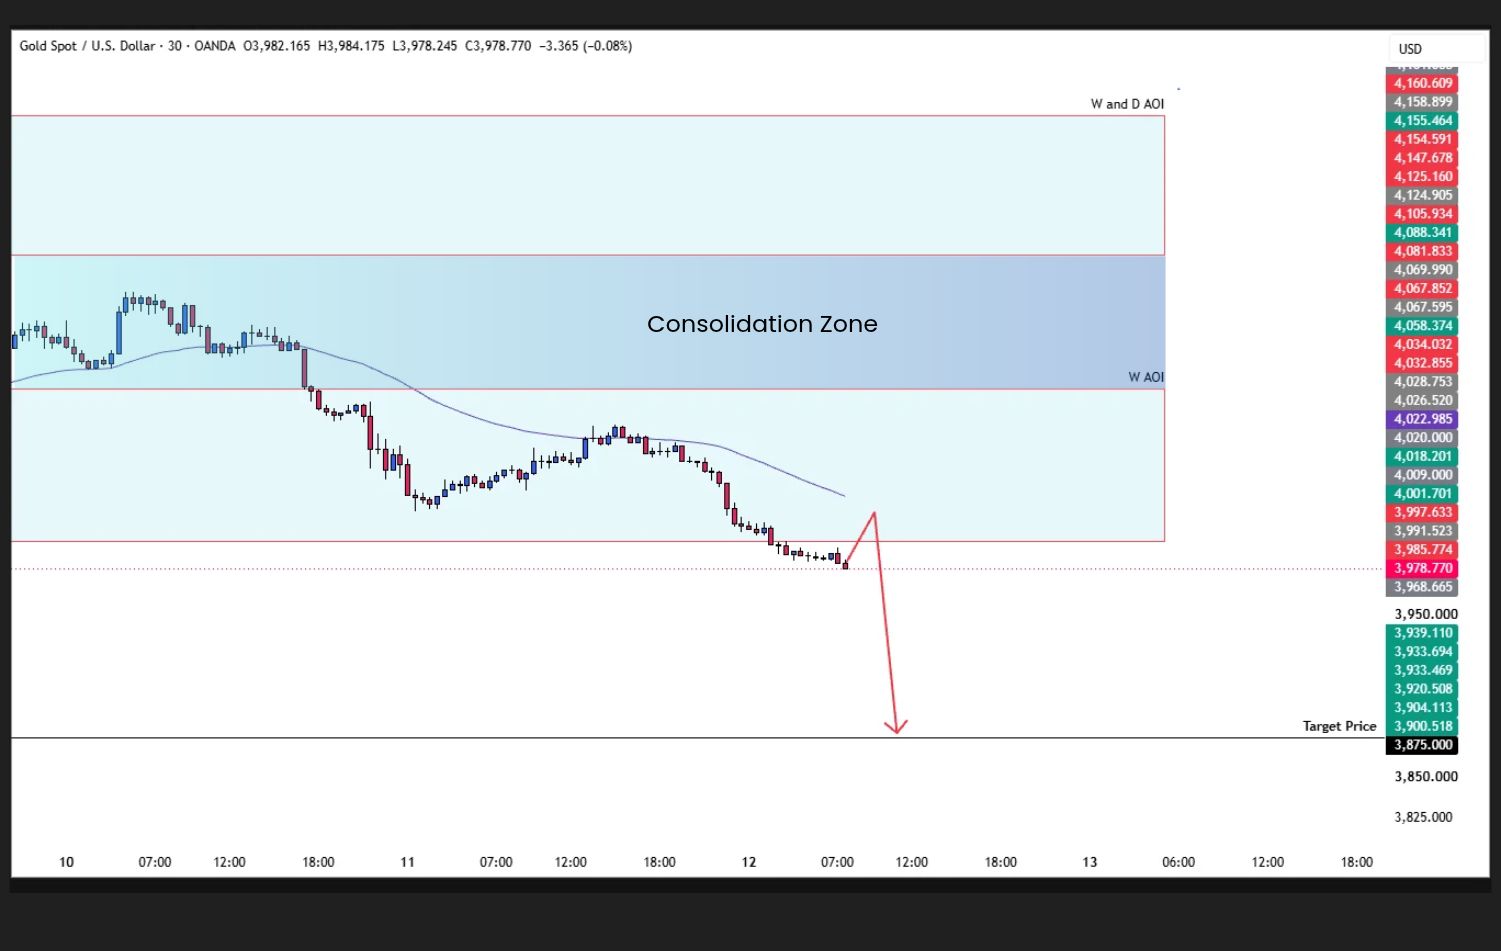
Step 3 — Watch the Retest: A Return to $4,000–$4,100 From Below Tested Whether Former Support Would Hold as Resistance.
This break-and-retest setup tests whether former support is becoming resistance.
Purpose: Look for evidence that sellers are defending the zone before considering an entry.
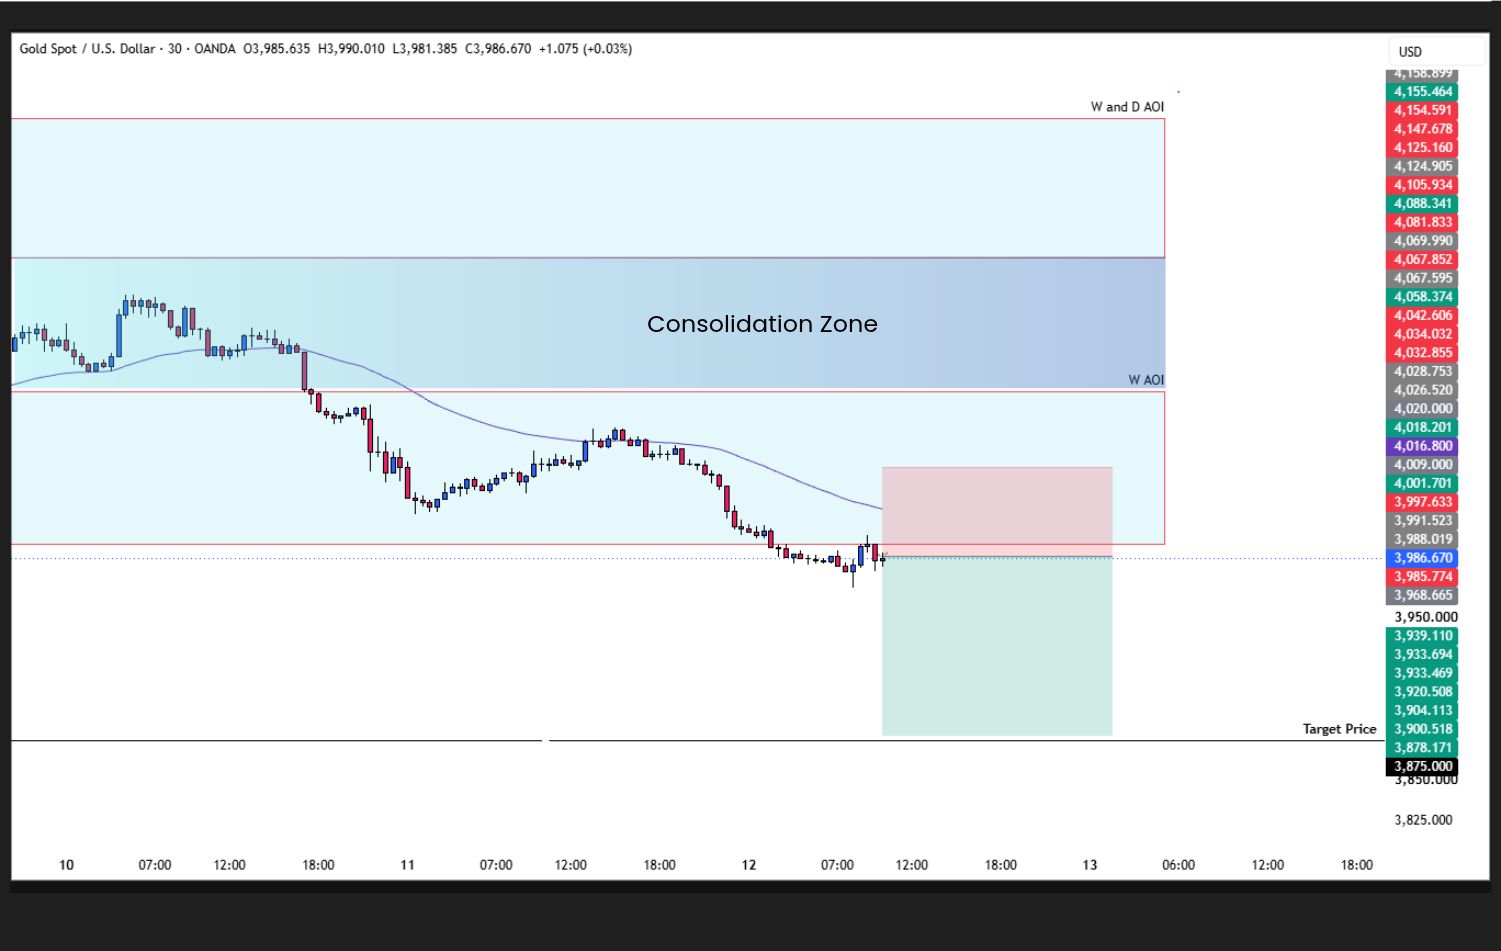
Step 4 — Confirm Bearish Entry: A Completed Bearish Engulfing Candle and Break Below Its Low Provided the Planned Entry Trigger.
On the selected lower timeframe, wait for a completed bearish engulfing candlestick during the retest, ideally rejecting the zone and closing back below $4,000.
The bearish candle’s body should engulf the previous bullish candle’s body. A subsequent break below the engulfing candle’s low provides the follow-through trigger for this setup.
Use the same timeframe to assess the completed pattern and its trigger.
Purpose: Confirm a selling response instead of entering simply because price touches resistance.
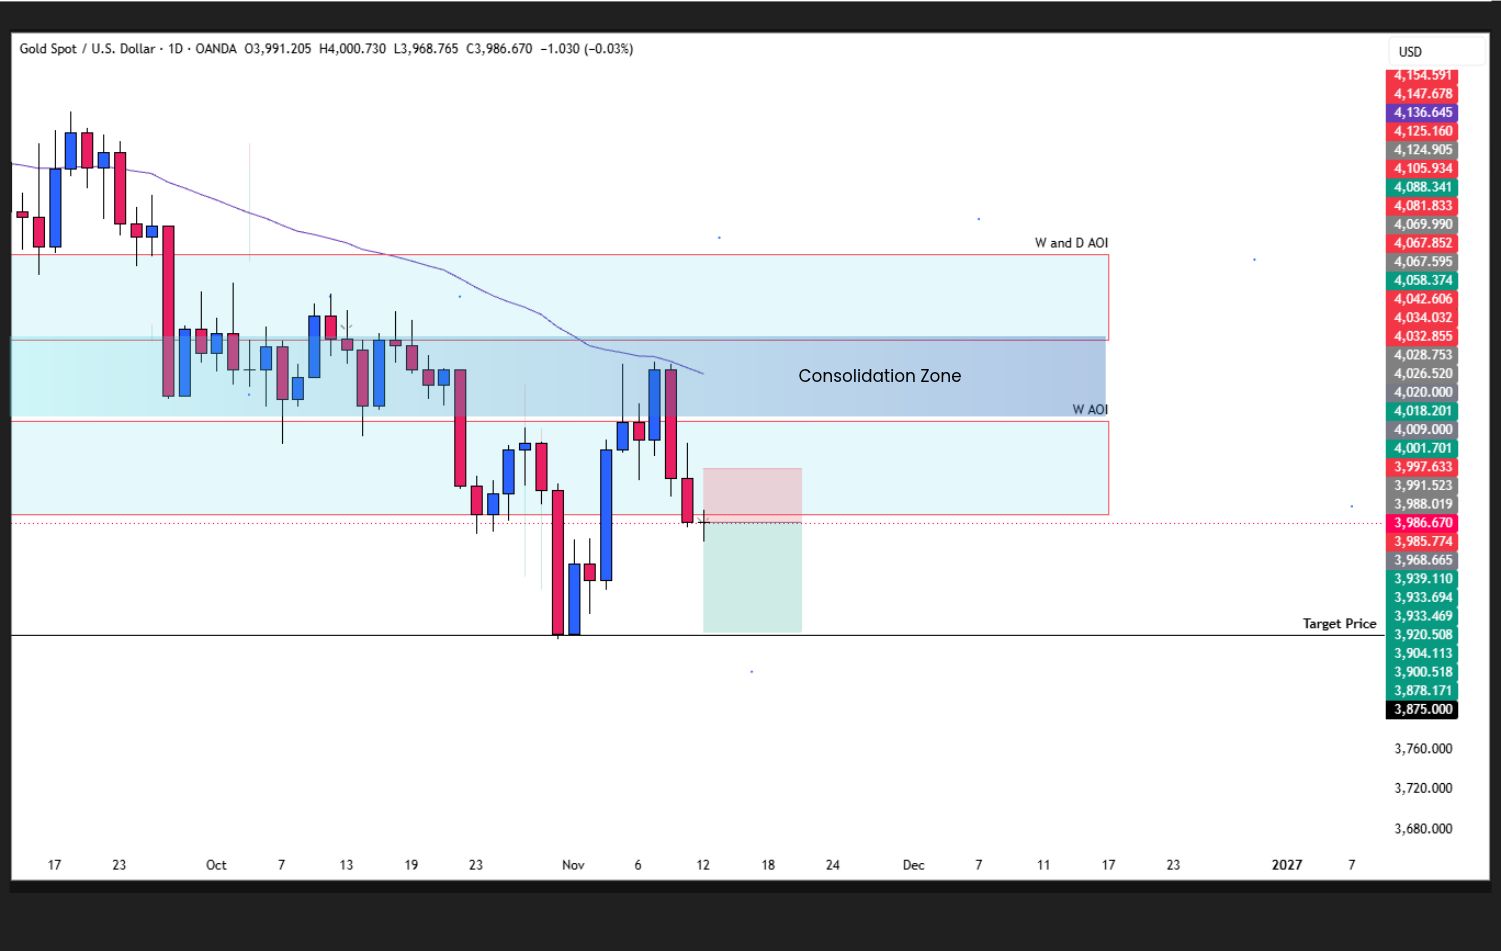
Step 5 — Set Stop Loss and Take Profit: The Sell Plan Placed the Stop Loss Above the Relevant Retest High, With $3,880 as the Downside Objective.
Adjust position size to your planned risk. No confirmation, no trade.
Gold later reached $3,880, completing the original bearish target.
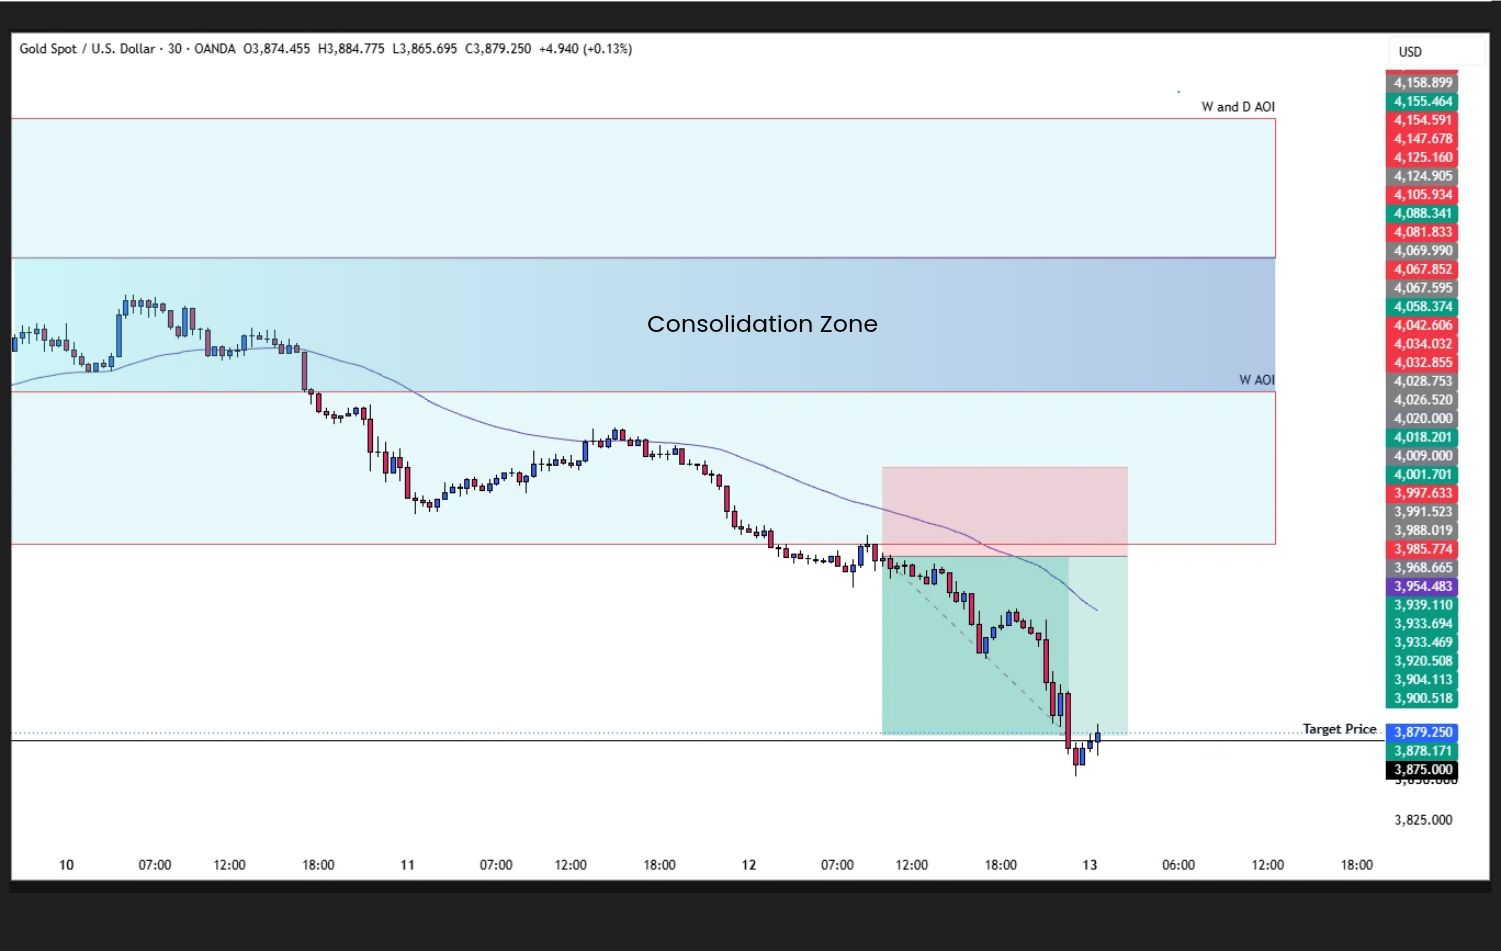
Lower-Timeframe Trade Management: The Plan Called for Controlled Risk and Patience as the Bearish Setup Developed.
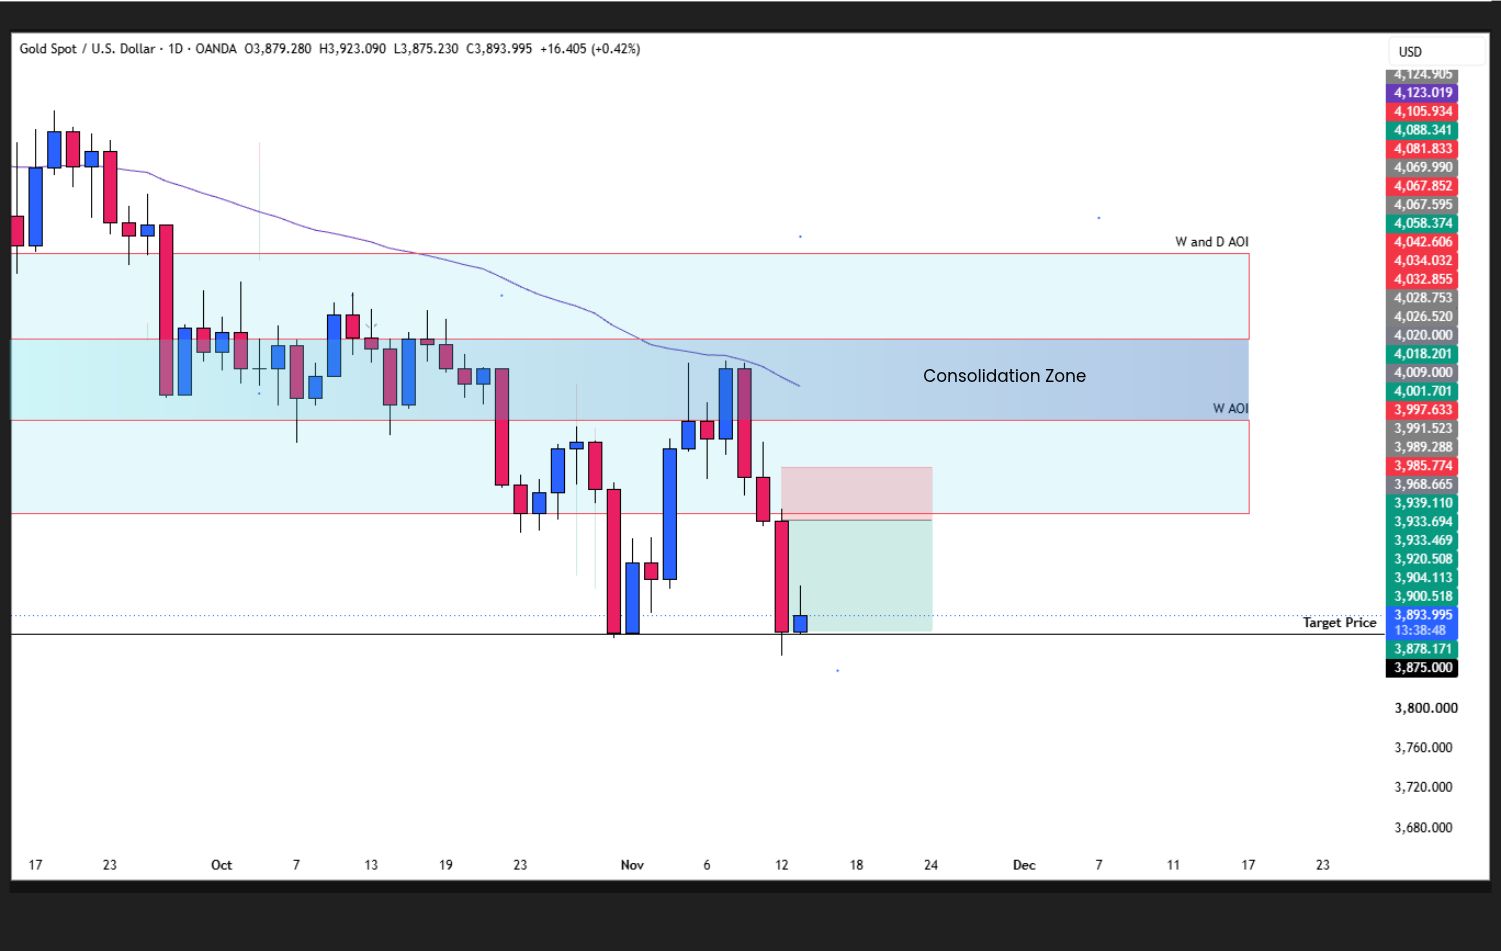
Daily Bearish Outcome: Gold Reached $3,880, Completing the Original Downside Target From the November 11 Forecast.
Once the trade is open, let price move toward your stop loss or take profit. Avoid changing the plan because of small price movements.
Follow your risk management plan:
You cannot control the outcome. You can control your risk and execution.
| Trade filterOriginal requirementWhy it mattered | ||
| Break | Daily close below $4,000 | Established a close below support |
| Retest | Return to $4,000–$4,100 from below | Tested former support as resistance |
| Confirm | Bearish rejection close below $4,000, then a break of the candle’s low | Added evidence of selling pressure |
| Target | $3,880 | Original downside objective—reached |

Daily Timeframe Price Action Analysis: Gold’s bullish setup requires a daily close above $4,250 and a successful retest of $4,175–$4,250 as support.
The original forecast also prepared for a recovery. Buyers needed a daily close above $4,250, a successful retest of $4,175–$4,250, and bullish rejection with upward follow-through.
That scenario carried a conditional target of $4,375. It defined what buyers needed to achieve to strengthen the recovery case.
The outcome reviewed here is Gold reaching the bearish objective at $3,880.

The sell scenario began with the weekly breakdown, resistance rejection and weaker trend below the 50-week EMA. The daily recovery then identified the key hurdle: sellers needed to overcome $4,000–$4,100 support.
The original checklist translated that analysis into clear conditions: a daily breakdown, a retest and bearish confirmation.
Gold reached $3,880, completing the forecast’s downside objective. The lesson is to connect the broader trend with a specific price level and a defined confirmation process, the foundation of a structured price action trading approach.
Read the trend. Mark the level. Wait for confirmation. No confirmation, no trade.
______________________________________________________________________________________
A clear Gold trading strategy starts with understanding the trend, marking key levels, and waiting for confirmation. Build your foundation with these guides:
Start with one Gold setup and one timeframe combination. Practice on a demo trading account, record your decisions, and review your execution.
______________________________________________________________________________________
Before moving to live trading, understand the account terms, trading costs, and risks. Use only capital you can afford to lose. Demo results do not guarantee live performance.
Explore an ACY Live Trading Account
______________________________________________________________________________________
Follow Ruffy Grant B. Capacio for price action education, Gold and Forex analysis, and trading psychology insights.
Follow on LinkedIn · Join the ACY Securities Discord Community
Build your plan. Wait for confirmation. Manage your risk.
Risk Disclaimer:
Trading leveraged financial instruments involves significant risk and may not be suitable for everyone. This content is for general education and information only and is not financial advice or a recommendation to trade. Past performance, demo results, and price targets do not guarantee future outcomes. Consider your objectives, experience, and risk tolerance, and seek independent advice where appropriate. Only trade with capital you can afford to lose. November 13, 2026
ACY Securities is one of Australia's fastest growing multi-asset online trading providers, offering ultra-low-cost trading, rock-solid execution, technologically superior account management and premium market analysis.

Select the categories and companies you wish to follow directly to your person rss feed.
Create Custom RSS FeedSign up and join over 5,000 professional members who receive personalized news alerts, curated professional connections, and more for free!
Crypto exchange and forex brokerage TheTrueTrade (TTT) has partnered with institutional liquidity provider X Securities to strengthen its dealing desk and risk management operations covering 24/7 trading.
Gold reached the $3,880 bearish target. Review the weekly analysis, $4,000 support zone and original break-and-retest sell checklist.
VS Markets Ltd has been authorised by CySEC to provide crypto-asset services under MiCA, covering custody, exchange, order execution, reception and transmission, and transfers. Services launch in the coming weeks for retail and institutional clients across 29 EEA markets, alongside its CFD and shares offering.
Learn how to set up a day tradeusing price action with five simple steps covering market direction, key levels, entry confirmation, stop loss, and take profit.
Learn price action trading step by step, with beginner and advanced techniques covering market structure, key levels, entry confirmation, and risk management.
Gold price forecast: Will XAUUSD break $4,250 or lose $4,000 support? Explore bullish and bearish setups, with potential targets at $4,375 and $3,880.
smartTrade Technologies SAS has acquired Celoxica, a provider of ultra-low latency execution infrastructure for listed markets across 80+ venues worldwide. The deal extends the smartTrade Group’s reach from OTC to listed markets, and Celoxica General Manager Jean-Marc Bouhelier joins the smartTrade Executive Committee.
The collaboration adds outsourced dealing, real-time risk intelligence and trading-flow surveillance to STARPRIME's institutional liquidity offering.
MAS Markets has appointed Gareth Palmer as eFX Sales, bringing more than 20 years of financial services experience to develop the FCA-regulated liquidity provider’s electronic FX sales capabilities, strengthen institutional client relationships and expand its electronic trading offering across global markets.
Usio has reported third quarter 2026 revenue of $23.8 million, up 12%, with Adjusted EBITDA up 222% to $1.2 million, total payment dollars processed up 25% to $2.73 billion and a sixth consecutive quarterly record in ACH transactions, and has reiterated its guidance of 14% to 16% revenue growth for 2026.