
just now


Liquidity Finder Ltd is incorporated in England and Wales, company number 10610740, registered address 167-169 Great Portland Street, Fifth Floor, London W1W 5PF, United Kingdom.
Published: just now


A day trading setup is a set of conditions you wait for before entering a trade. It helps you answer five simple questions: Which direction is price moving? Where should I watch? Has price rejected the level? Is there an entry signal? How much am I risking?
If you are new to price action trading, start with this sequence:
Direction → Level → Retest → Confirmation → Risk.
This guide breaks the process into five easy steps. Once your charts are prepared, the final checklist takes about one minute to review. Waiting for a valid setup can take much longer.

| StepWhat to doWhat to look for | ||
| 1. Direction | Check the higher timeframe | Bullish, bearish, or unclear structure |
| 2. Level | Mark support or resistance | An area where price has reacted |
| 3. Retest | Wait for price to return | A completed rejection candle |
| 4. Confirmation | Check your lower timeframe | A completed engulfing candle and entry trigger |
| 5. Risk | Plan the trade | Entry, stop loss, target, and position size |
If a condition is missing, the setup is not ready.

Think of a surfer waiting for a wave.
The surfer checks the conditions, chooses a position, and waits for a suitable wave before paddling. Chasing every movement wastes energy.
A trading setup follows a similar process. You study the direction, mark your level, and wait for price to give your planned signal.
Your job is to wait for your setup, not catch every move.
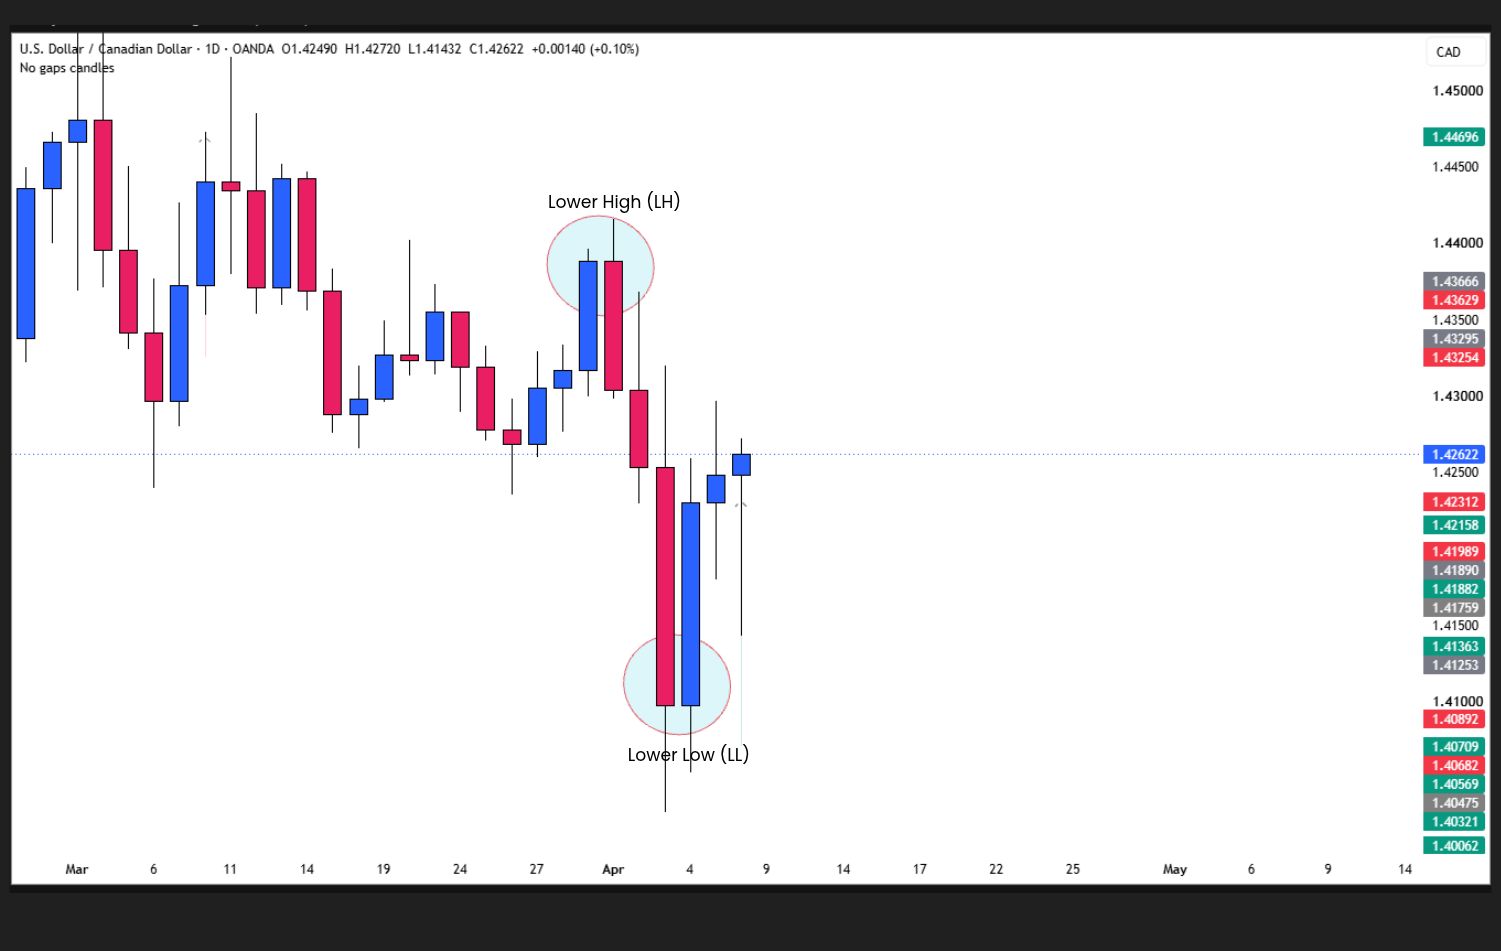
Start with the Weekly, Daily, or 4-Hour chart to understand market direction.
Look at the market structures highs and lows:
For this trend-following strategy, look for buys in bullish structure and sells in bearish structure. If the direction is unclear, wait.
Beginner example: Use H4 for your setup and M15 or M30 for your entry. Choose the pairing before searching for a trade.
Timeframe confluence: Check whether the Daily chart supports your H4 direction. If they disagree, recognize the conflict instead of switching charts until you find a signal you like.
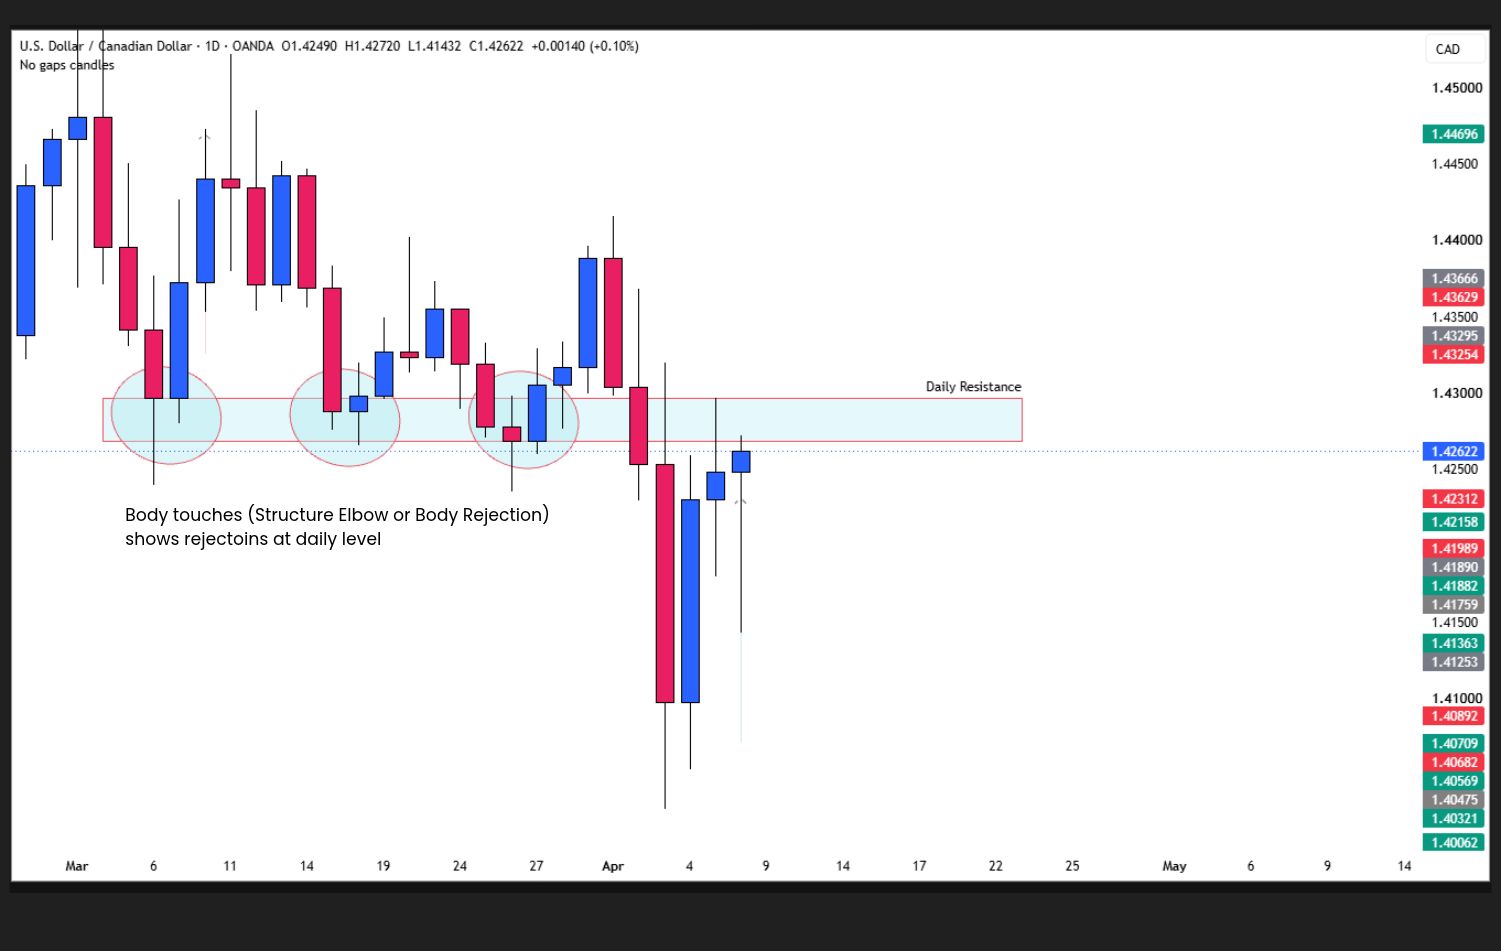
On the same timeframe, mark the area where you want price to react.
For a buy setup: Mark support below price. This might be a previous higher low or broken resistance that price could retest.
For a sell setup: Mark resistance above price. This might be a previous lower high or broken support that price could retest.
Think of support and resistance as zones, rather than exact prices that must hold.
| Your biasMark this levelWait for | ||
| Bullish | Support | Price to return and reject the zone |
| Bearish | Resistance | Price to return and reject the zone |
Timeframe confluence: A zone visible on both H4 and Daily gives you overlapping context. It still needs confirmation.
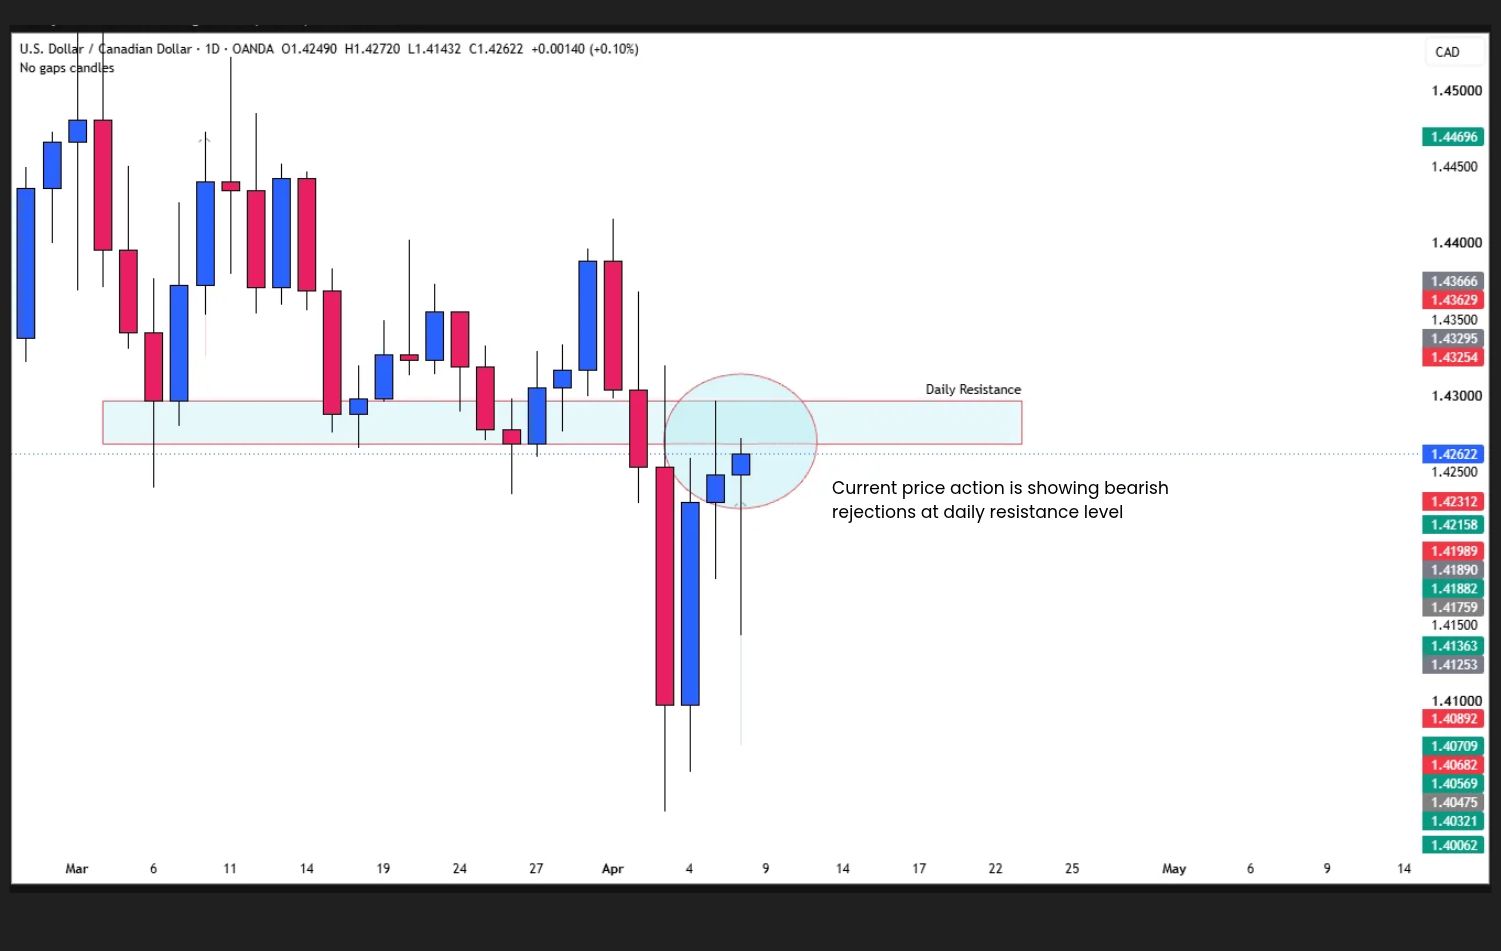
A retest happens when price returns to the level you marked. Rejection describes price moving away after testing it.
Do not enter simply because price touches your zone.
Buy setup:
Sell setup:
Wait for the rejection candle to close on your chosen setup timeframe. An unfinished candle can change before the close.
Using H4? Wait for the H4 close. Using Daily or Weekly confirmation? Wait for that candle to close first.
Daily and Weekly confirmation can mean a much longer wait. The one-minute checklist does not shorten that process.
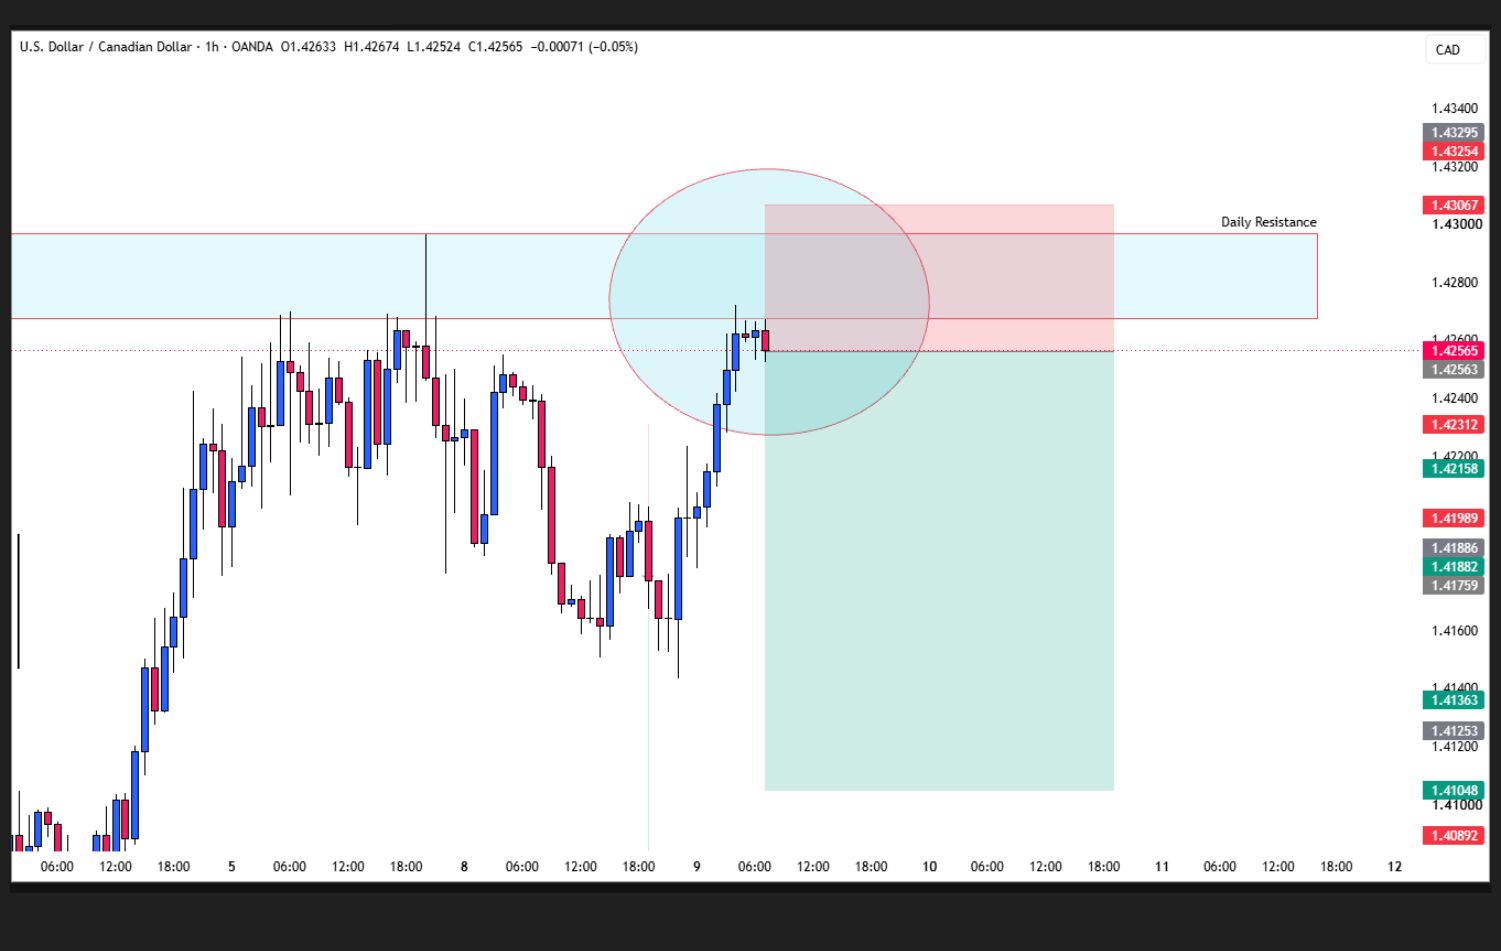
After the higher-timeframe rejection, move to your chosen lower timeframe.
| Setup chartExample entry charts | |
| H4 | M15, M30, or H1 |
| Daily | M15, M30, H1, or H2 |
| Weekly | M30, H1 or H2 after weekly confirmation |
These are combinations to practice and test, not guaranteed profitable pairings.
Look for a body-to-body engulfing pattern:
The candle body is the distance between its open and close. The wicks do not have to be engulfed for this definition.
Buy trigger: After support rejects and the bullish engulfing candle closes, consider entry if price breaks its high.
Sell trigger: After resistance rejects and the bearish engulfing candle closes, consider entry if price breaks its low.
Use this as one consistent execution rule to test. An engulfing candle suggests a possible momentum shift; it does not guarantee the next move.
If price runs too far before you can enter, let it go.
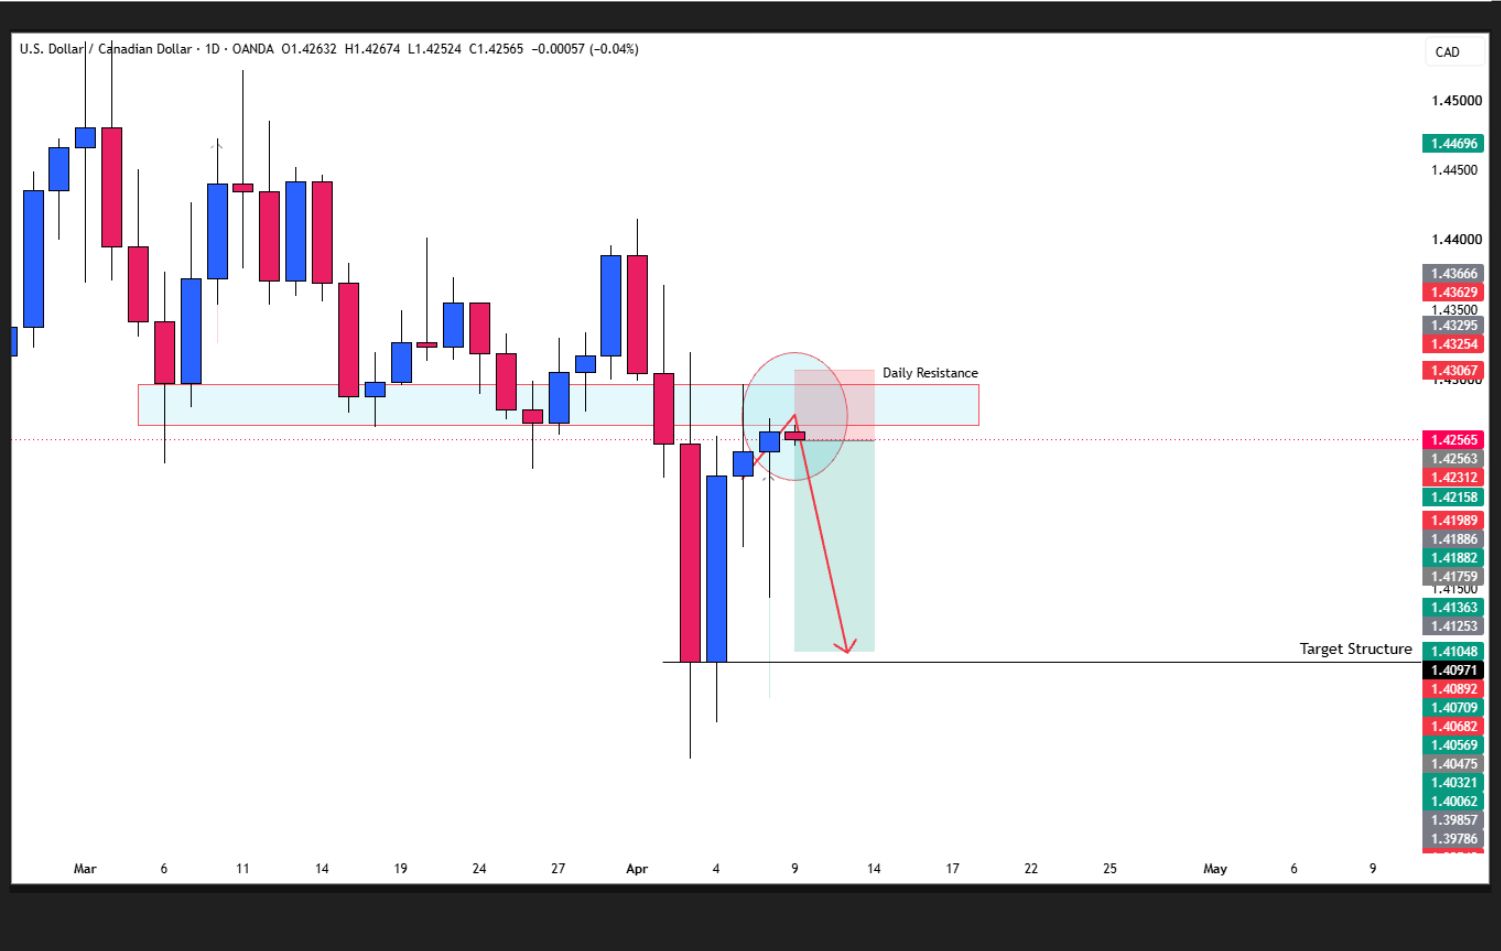
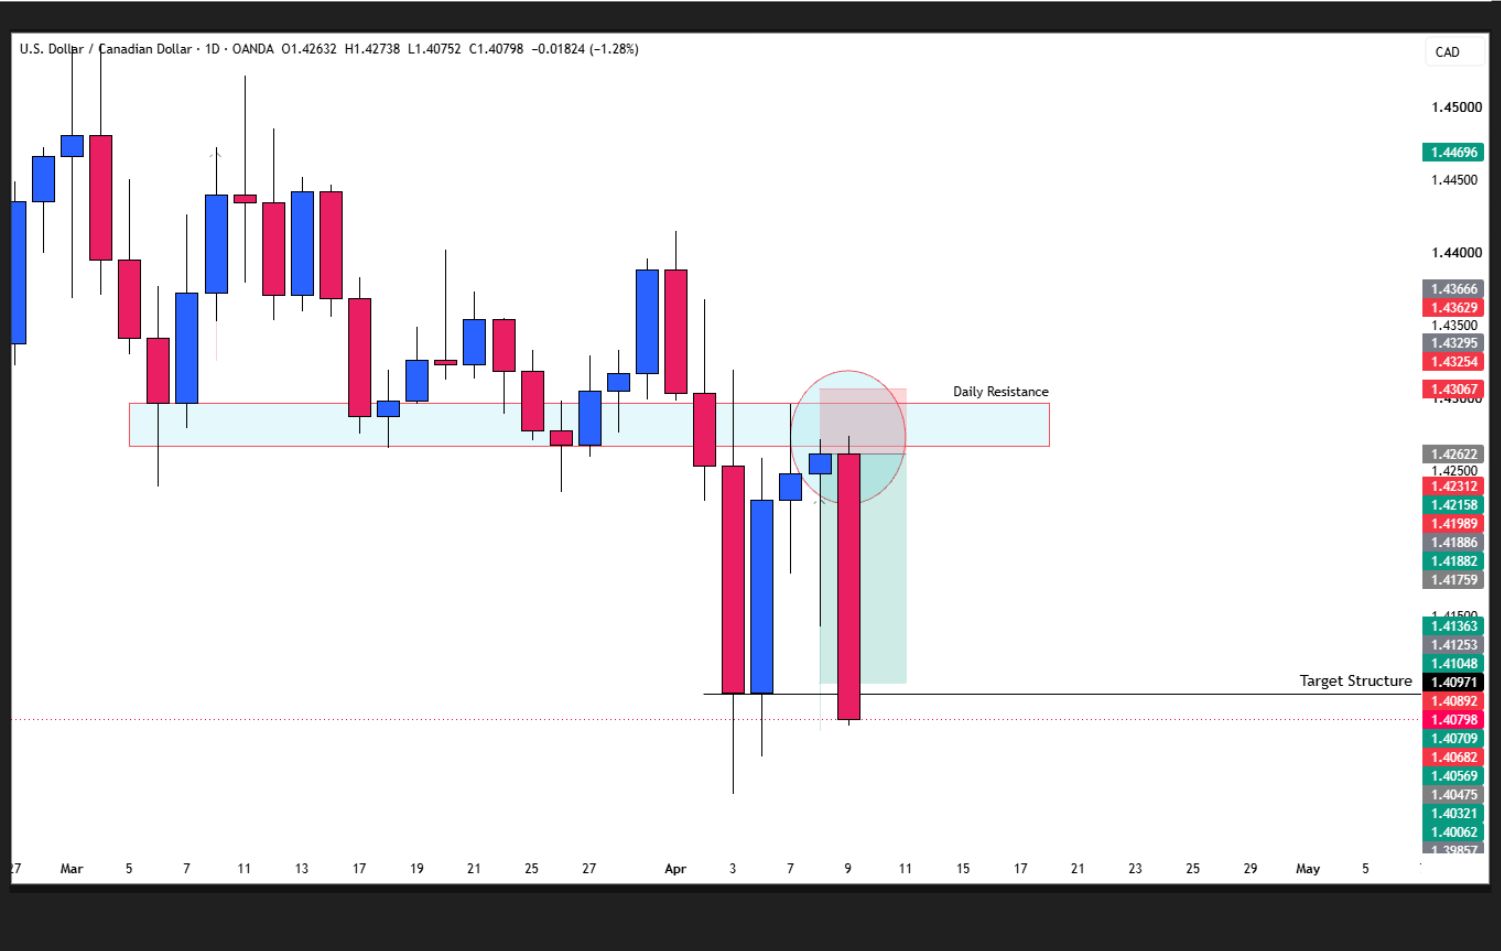
Before entering, know where your idea becomes invalid and where you plan to exit.
| TradeStop loss referenceTake profit reference | ||
| Buy | Below the relevant rejection low and support zone | Before the next meaningful resistance |
| Sell | Above the relevant rejection high and resistance zone | Before the next meaningful support |
Then choose a position size that fits your planned risk and stop distance. Do not squeeze the stop closer simply to trade a larger position.
Simple example:
This is a 1:2 risk-to-reward ratio before costs: two points of potential reward for every point of planned risk.
The ratio alone does not make a strategy profitable. If the next support or resistance leaves too little room for your tested rules, skip the trade.
Allow for spreads, commissions, and slippage. A standard stop loss can fill beyond its trigger price during fast markets or gaps.
Use this after preparing your charts and waiting for the setup.
| TimeQuestion | |
| 0–10 seconds | Is my higher-timeframe direction clear? |
| 10–20 seconds | Have I marked support for buys or resistance for sells? |
| 20–30 seconds | Has price retested the level and confirmed rejection? |
| 30–40 seconds | Has my engulfing candle closed, and is my entry trigger defined? |
| 40–60 seconds | Are entry, stop loss, target, position size, and session exit planned? |
A completed checklist prepares the trade. Enter only when your planned trigger occurs.
Set a loss budget per trade and a daily loss limit before the session. Day trading means closing positions within the trading day, so a lower-timeframe entry still needs a realistic session exit.
Start with one market, one timeframe pairing, and one setup.
For example, practice H4 support or resistance rejection with an M15 engulfing entry on a demo account.
Record the setup, entry, stop loss, target, and outcome. Save screenshots and include every qualifying trade, including losses.
Your first goal is to follow the process consistently and evaluate it after costs. Demo results do not guarantee live results.

Start with direction. Mark your level. Wait for rejection. Confirm your entry. Define your risk.
Save this day trading checklist and practice it with one market and one timeframe combination.
React, don’t predict. No confirmation, no trade.
______________________________________________________________________________________
You can review a prepared setup in about a minute. Chart preparation and waiting for confirmation can take hours or longer.
H4 for the setup and M15 or M30 for entry is one combination to practice. There is no universally best pairing; test your rules before risking real money.
Under this framework, no. Wait for higher-timeframe rejection, a completed bullish engulfing candle on your entry chart, and the planned trigger.
No. It can suggest a change in momentum, but price may reverse again or continue its previous direction.
Let it go. Missing a move is better than abandoning your process to chase an unplanned entry.
______________________________________________________________________________________
A clear price action trading strategy starts with market direction, key levels, confirmation, and risk management. Strengthen your process with these guides:
Start with one market, one timeframe combination, and one setup. Practise on a demo trading account, record your decisions, and review whether you followed your rules.
______________________________________________________________________________________
Before moving to live trading, understand the account terms, trading costs, and risks. Use only capital you can afford to lose. Demo results do not guarantee live performance.
Explore an ACY Live Trading Account

______________________________________________________________________________________
Follow Ruffy Grant B. Capacio for price action education, Gold and Forex analysis, and trading psychology insights.
Follow on LinkedIn · Join the ACY Securities Discord Community
Build your plan. Wait for confirmation. Manage your risk.
Risk Disclaimer:
Trading leveraged financial instruments involves significant risk and may not be suitable for everyone. This content is for general education and information only and is not financial advice or a recommendation to trade. Past performance, demo results, and price targets do not guarantee future outcomes. Consider your objectives, experience, and risk tolerance, and seek independent advice where appropriate. Only trade with capital you can afford to lose. November 13, 2026
ACY Securities is one of Australia's fastest growing multi-asset online trading providers, offering ultra-low-cost trading, rock-solid execution, technologically superior account management and premium market analysis.

Select the categories and companies you wish to follow directly to your person rss feed.
Create Custom RSS FeedSign up and join over 5,000 professional members who receive personalized news alerts, curated professional connections, and more for free!
Learn how to set up a day tradeusing price action with five simple steps covering market direction, key levels, entry confirmation, stop loss, and take profit.
Learn price action trading step by step, with beginner and advanced techniques covering market structure, key levels, entry confirmation, and risk management.
Gold price forecast: Will XAUUSD break $4,250 or lose $4,000 support? Explore bullish and bearish setups, with potential targets at $4,375 and $3,880.
smartTrade Technologies SAS has acquired Celoxica, a provider of ultra-low latency execution infrastructure for listed markets across 80+ venues worldwide. The deal extends the smartTrade Group’s reach from OTC to listed markets, and Celoxica General Manager Jean-Marc Bouhelier joins the smartTrade Executive Committee.
The collaboration adds outsourced dealing, real-time risk intelligence and trading-flow surveillance to STARPRIME's institutional liquidity offering.
MAS Markets has appointed Gareth Palmer as eFX Sales, bringing more than 20 years of financial services experience to develop the FCA-regulated liquidity provider’s electronic FX sales capabilities, strengthen institutional client relationships and expand its electronic trading offering across global markets.
Usio has reported third quarter 2026 revenue of $23.8 million, up 12%, with Adjusted EBITDA up 222% to $1.2 million, total payment dollars processed up 25% to $2.73 billion and a sixth consecutive quarterly record in ACH transactions, and has reiterated its guidance of 14% to 16% revenue growth for 2026.
Macquarie Bank has admitted failures in how it promoted its Welcome Rate offer for new savings account customers, with ASIC and Macquarie jointly proposing a $14 million penalty to the NSW Supreme Court, on top of $8.8 million in remediation that Macquarie has already paid to nearly 40,000 customers.
Alta, a new blockchain designed for banks and payment firms, has raised a $47.5 million Series A led by Index Ventures, with GV joining, taking total funding to $80 million. What caught my eye is that Airwallex CEO Jack Zhang is a co-founder and Airwallex is an early design partner, giving Alta access to fiat rails in around 200 countries from day one. Privacy and compliance built into the chain itself is exactly what institutions have been asking for.
DriveWealth, the embedded brokerage engine behind a long list of fintech apps, has secured MiCA authorisation from the Bank of Lithuania. Its EU entity already held a MiFID II licence, so one Vilnius-based firm can now offer partners securities and crypto-assets under a single regulatory roof, with crypto services due in the new year. Add the recent Ripple tie-up for RLUSD settlement and the direction is obvious: stocks, stablecoins and tokenised assets through one API. A shot across the bows for white-label brokerage rivals in Europe.