
just now


Liquidity Finder Ltd is incorporated in England and Wales, company number 10610740, registered address 167-169 Great Portland Street, Fifth Floor, London W1W 5PF, United Kingdom.
Published: just now


The Gold (XAUUSD) price forecast carries a bearish weekly bias, but the daily chart shows a bullish recovery. The supplied weekly analysis identifies a consolidation breakdown, bearish rejection around resistance and price trading below the 50-week EMA.
The daily chart tells a different story. Price has reclaimed $4,000–$4,100, allowing this former weekly support and subsequent resistance zone to act as daily support again. This recovery leaves the bearish continuation setup unconfirmed.
A daily close below $4,000, followed by a failed retest of $4,000–$4,100, would strengthen the case for a decline toward $3,880. Alternatively, a confirmed break and successful retest above $4,175–$4,250 would bring $4,375 into focus.

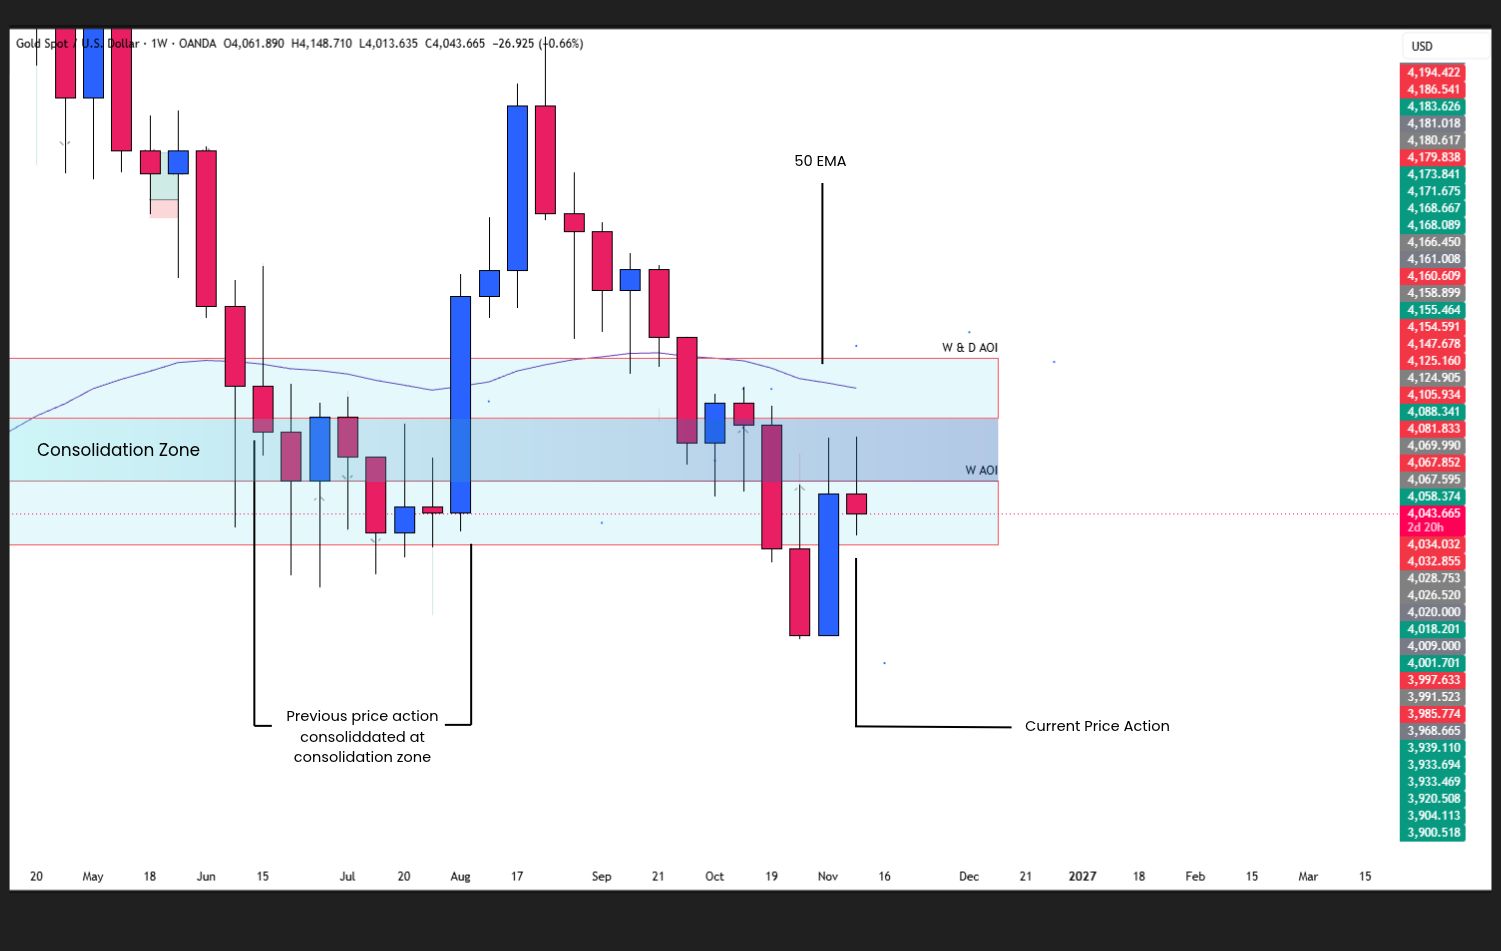
Weekly Chart Price Action Analysis: Gold (XAUUSD) shows bearish market structure following a consolidation breakdown, with rejection around weekly resistance supporting the bearish bias.
The supplied weekly analysis shows bearish market structure following a break below consolidation and former support. Bearish candlestick rejections around weekly resistance suggest sellers remain active.
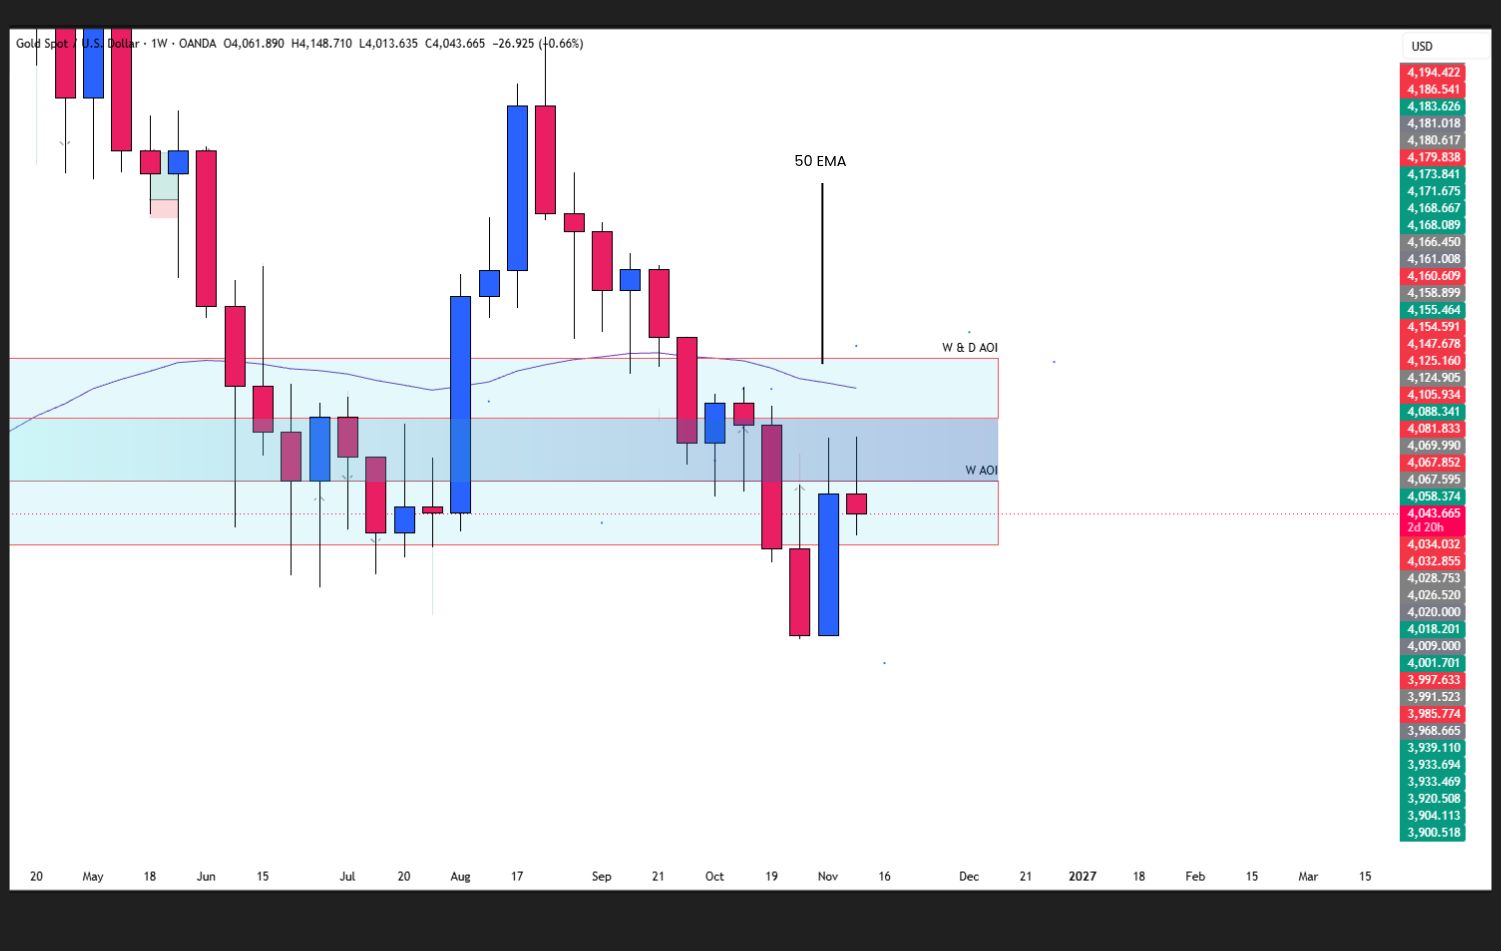
Weekly Chart Price Action Analysis: Gold trades below the 50-week EMA, with bearish rejection around the indicator suggesting sellers remain active.
Price also trades below the 50-week EMA, with rejection around the indicator adding to the bearish reading.
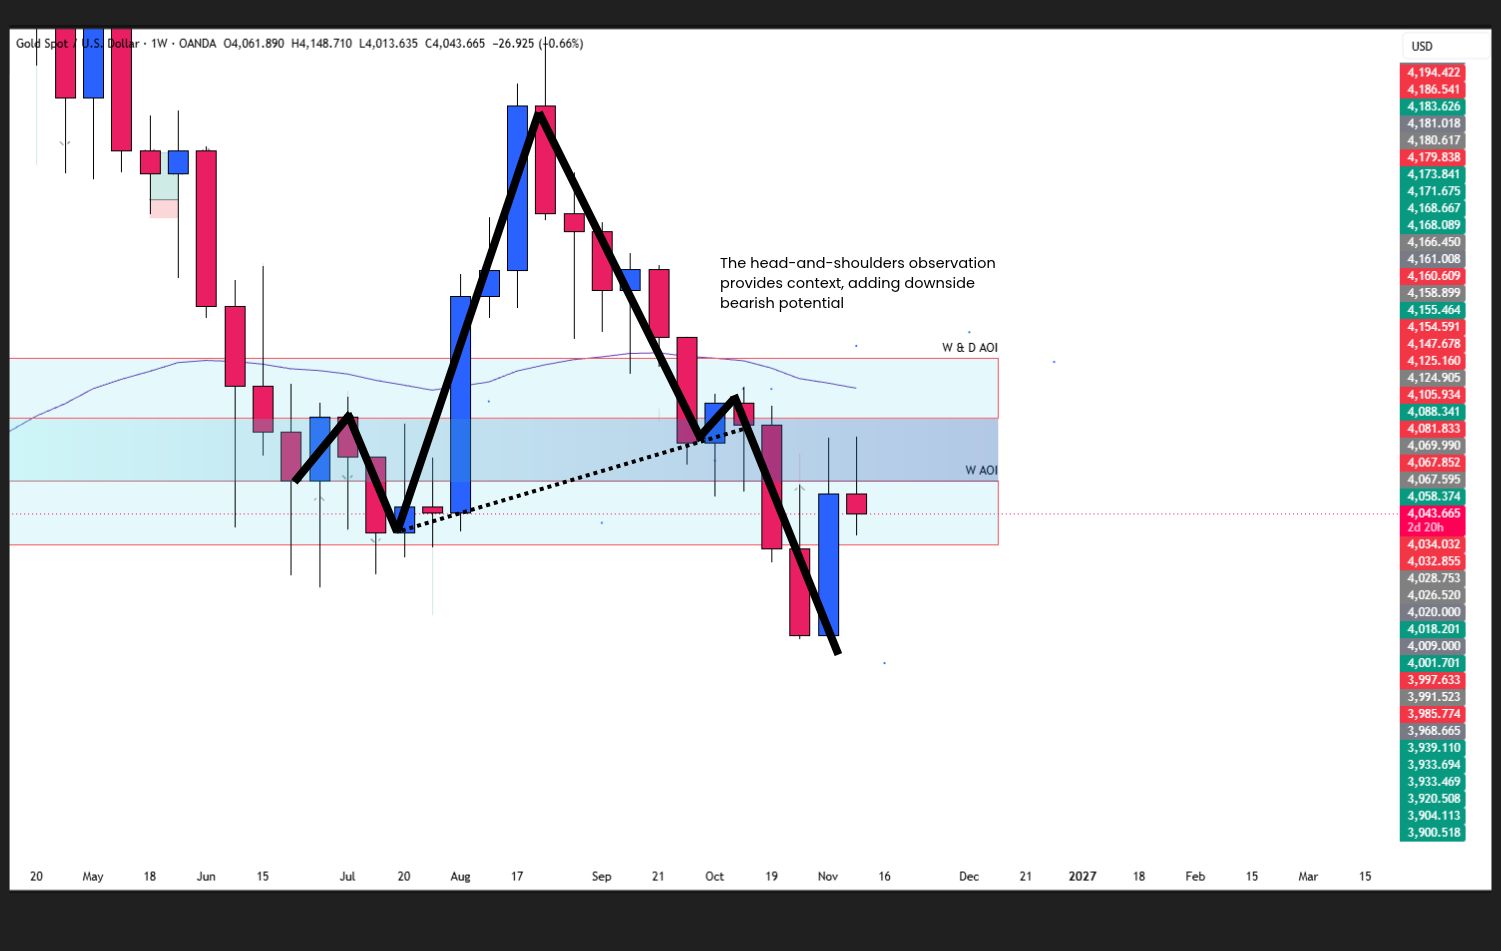
Weekly Chart Price Action Analysis: Gold shows rejection around the identified head-and-shoulders area, while bearish continuation still requires a confirmed breakdown of reclaimed support.
The head-and-shoulders observation provides context, but the supplied notes do not establish an exact neckline or measured-move target. $3,880 remains the supplied scenario target.
The daily recovery means the weekly bias still needs fresh price confirmation. Understanding support and resistance helps explain why the same zone can change roles as price breaks and reclaims it.
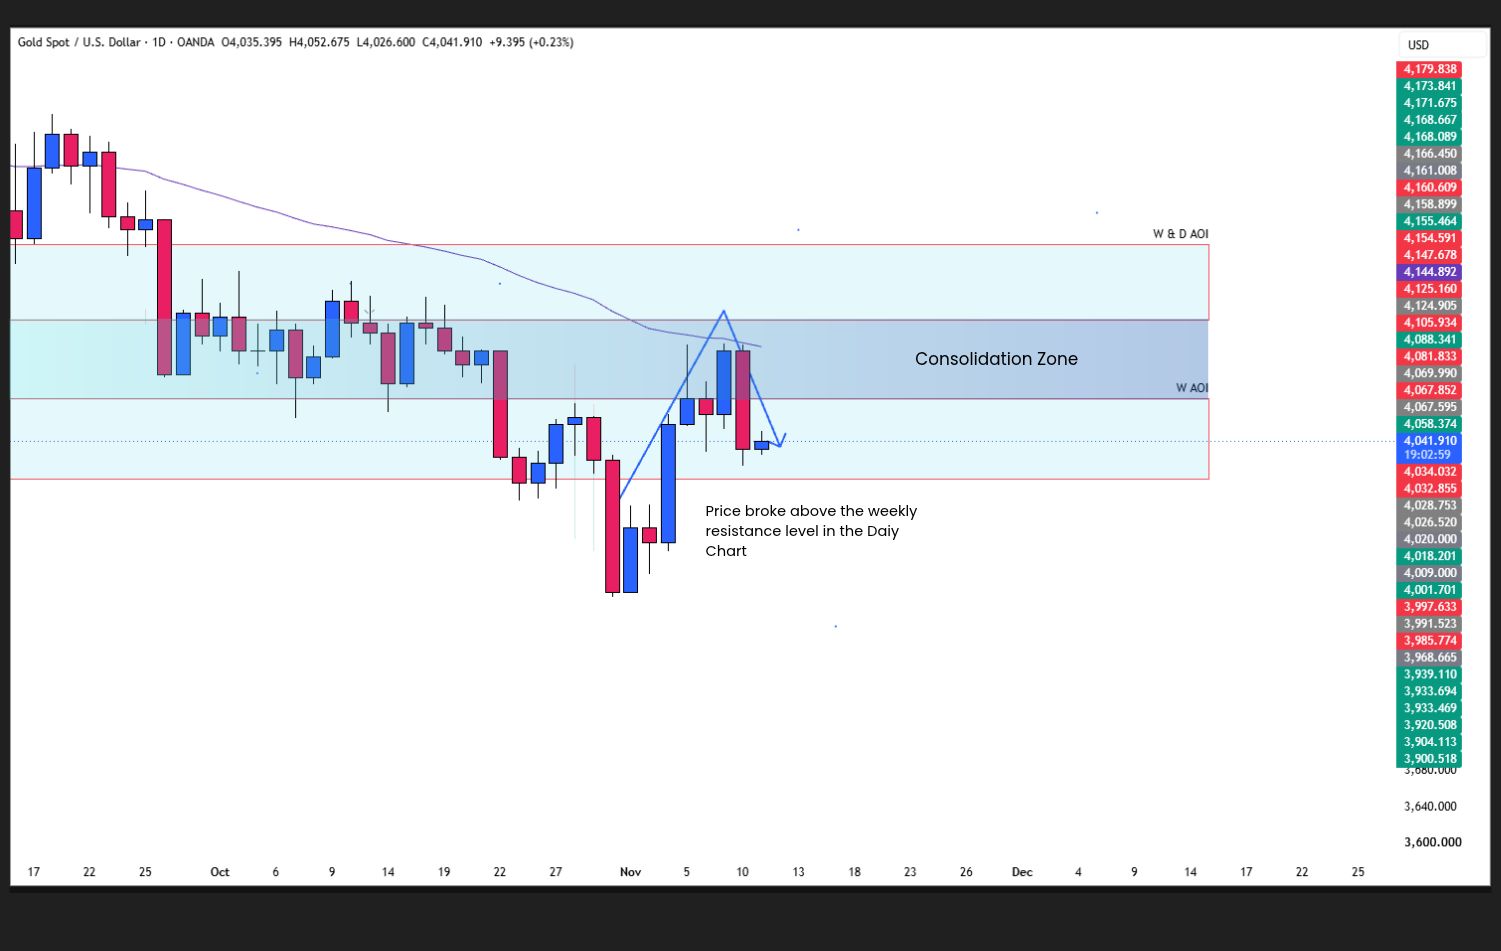
Daily Chart Price Action Analysis: Gold’s daily structure remains bullish after reclaiming $4,000–$4,100, putting the zone back in focus as support despite the weekly bearish bias.
Daily market structure remains bullish in the supplied analysis. Price has moved above $4,000–$4,100, putting the reclaimed zone back into focus as support.
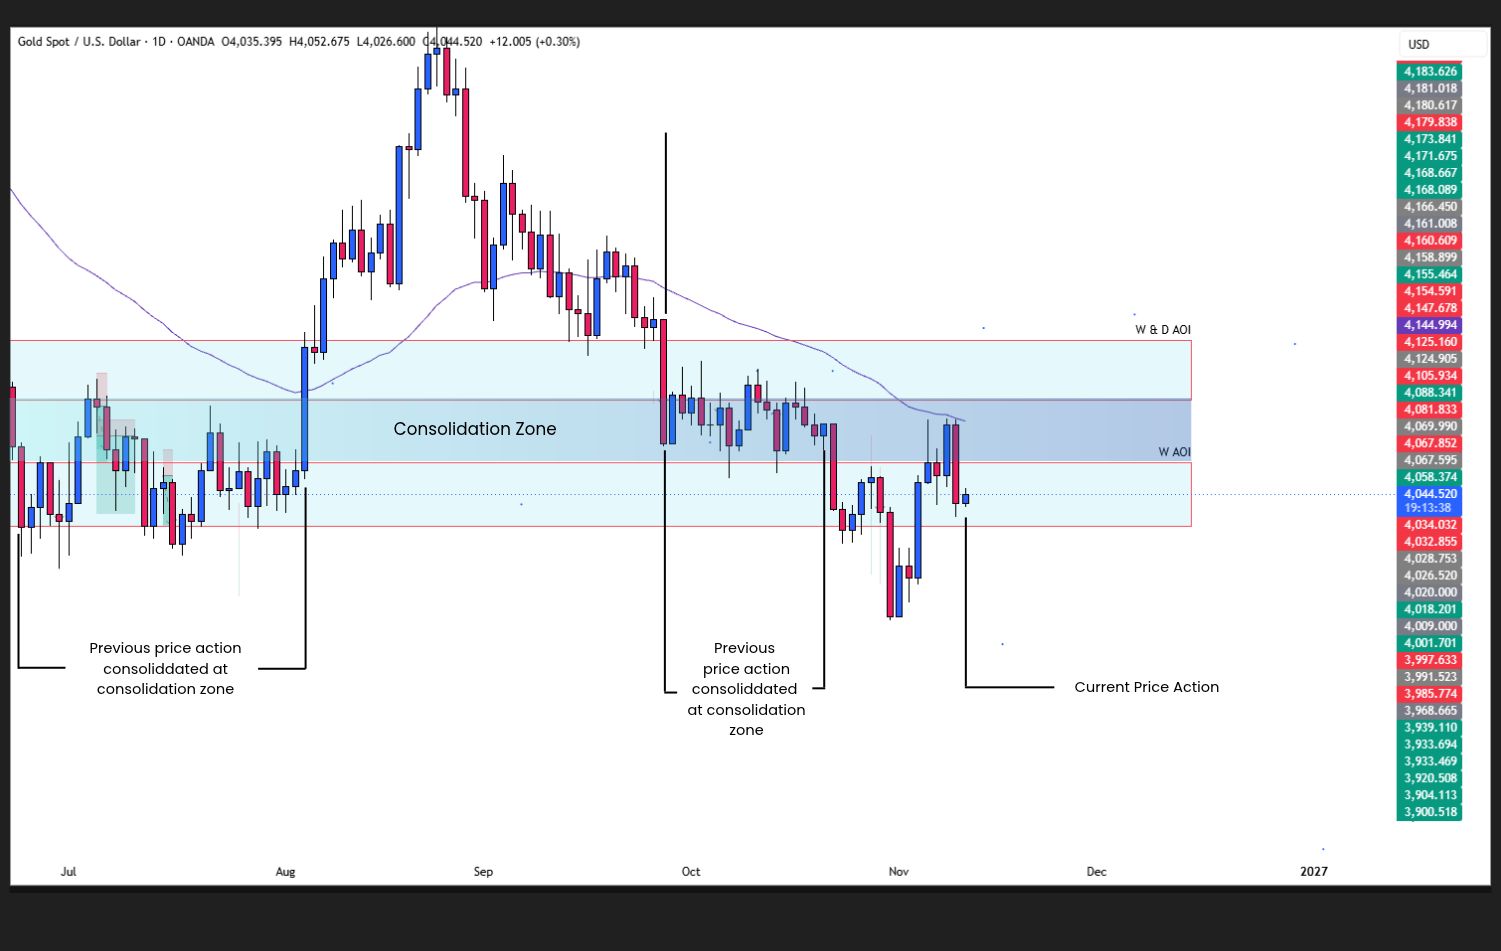
Daily Chart Price Action Analysis: Gold approaches its previous consolidation area, where overlapping price action highlights the potential for choppy movement between support and resistance.
Gold is also approaching the previous consolidation area. The earlier overlapping price action suggests that movement within this region could remain choppy, with repeated tests of support and resistance.
A bearish weekly bias alone does not confirm a daily sell setup. Sellers need a fresh breakdown and failed retest, while buyers need to clear the higher resistance zone to confirm the bullish alternative.
| Technical levelSignificance | |
| $4,000–$4,100 | Former weekly support, subsequent resistance and now reclaimed daily support |
| $4,000 | Lower boundary; a daily close below it begins the bearish confirmation sequence |
| $4,100 | Upper boundary; reclaiming and holding above it weakens a fresh bearish breakdown |
| $3,880 | Conditional downside target |
| $4,175–$4,250 | Combined weekly and daily resistance zone |
| $4,250 | Upper boundary to clear for bullish breakout confirmation |
| $4,375 | Conditional upside target |
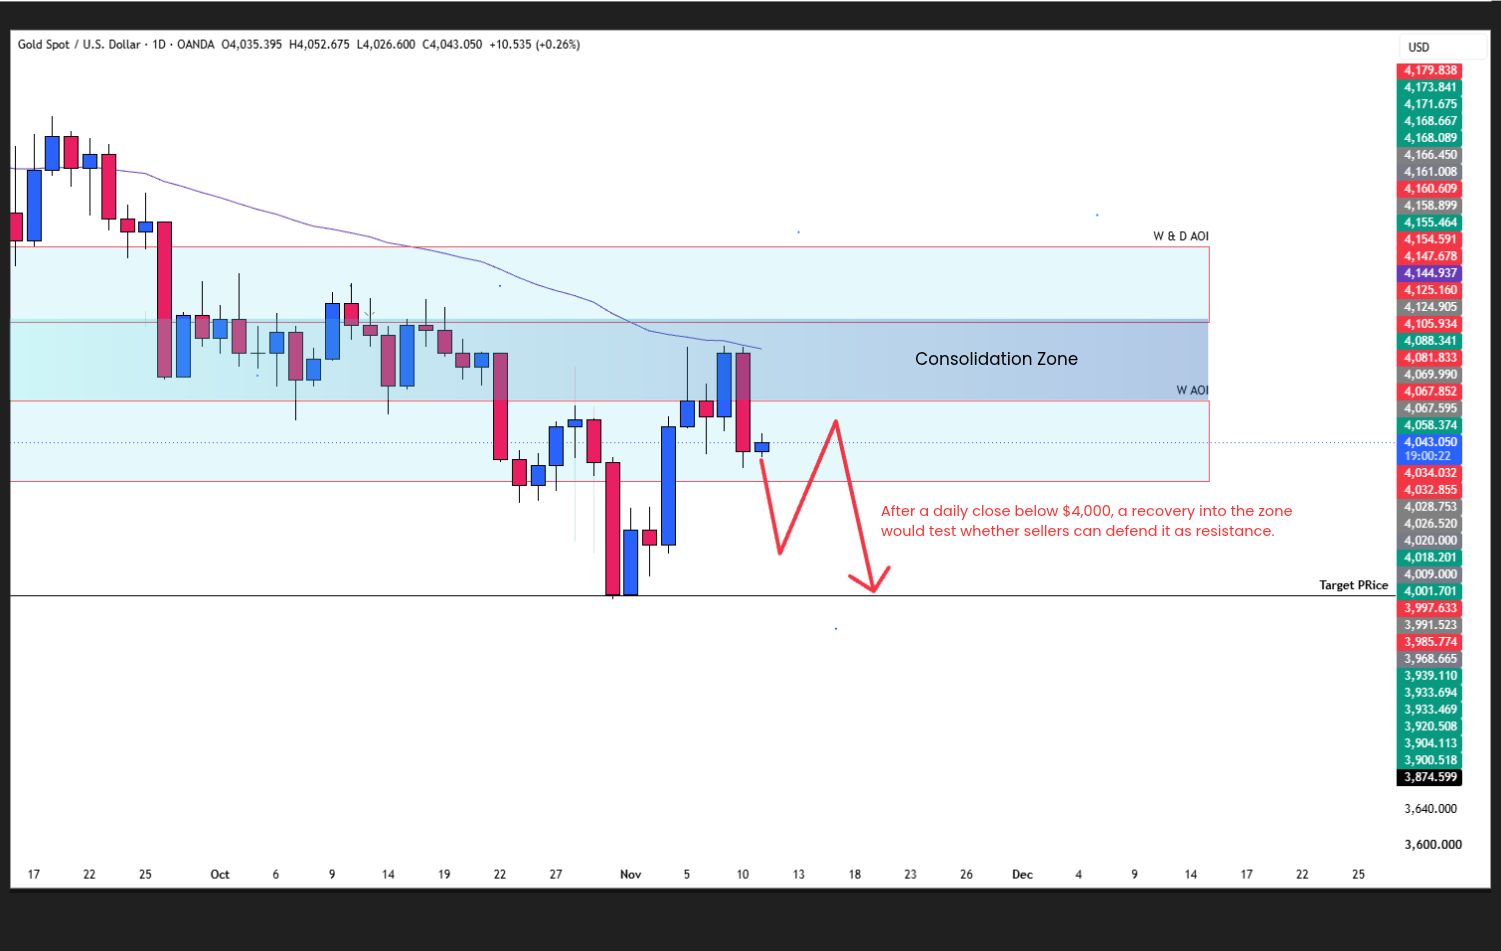
Daily Timeframe Price Action Analysis: Gold’s bearish setup requires a daily close below $4,000, followed by a failed retest of $4,000–$4,100 as resistance.
The bearish scenario requires Gold to lose the reclaimed $4,000–$4,100 support zone. A rejection at higher resistance alone would not complete this setup.
After a daily close below $4,000, a recovery into the zone would test whether sellers can defend it as resistance.
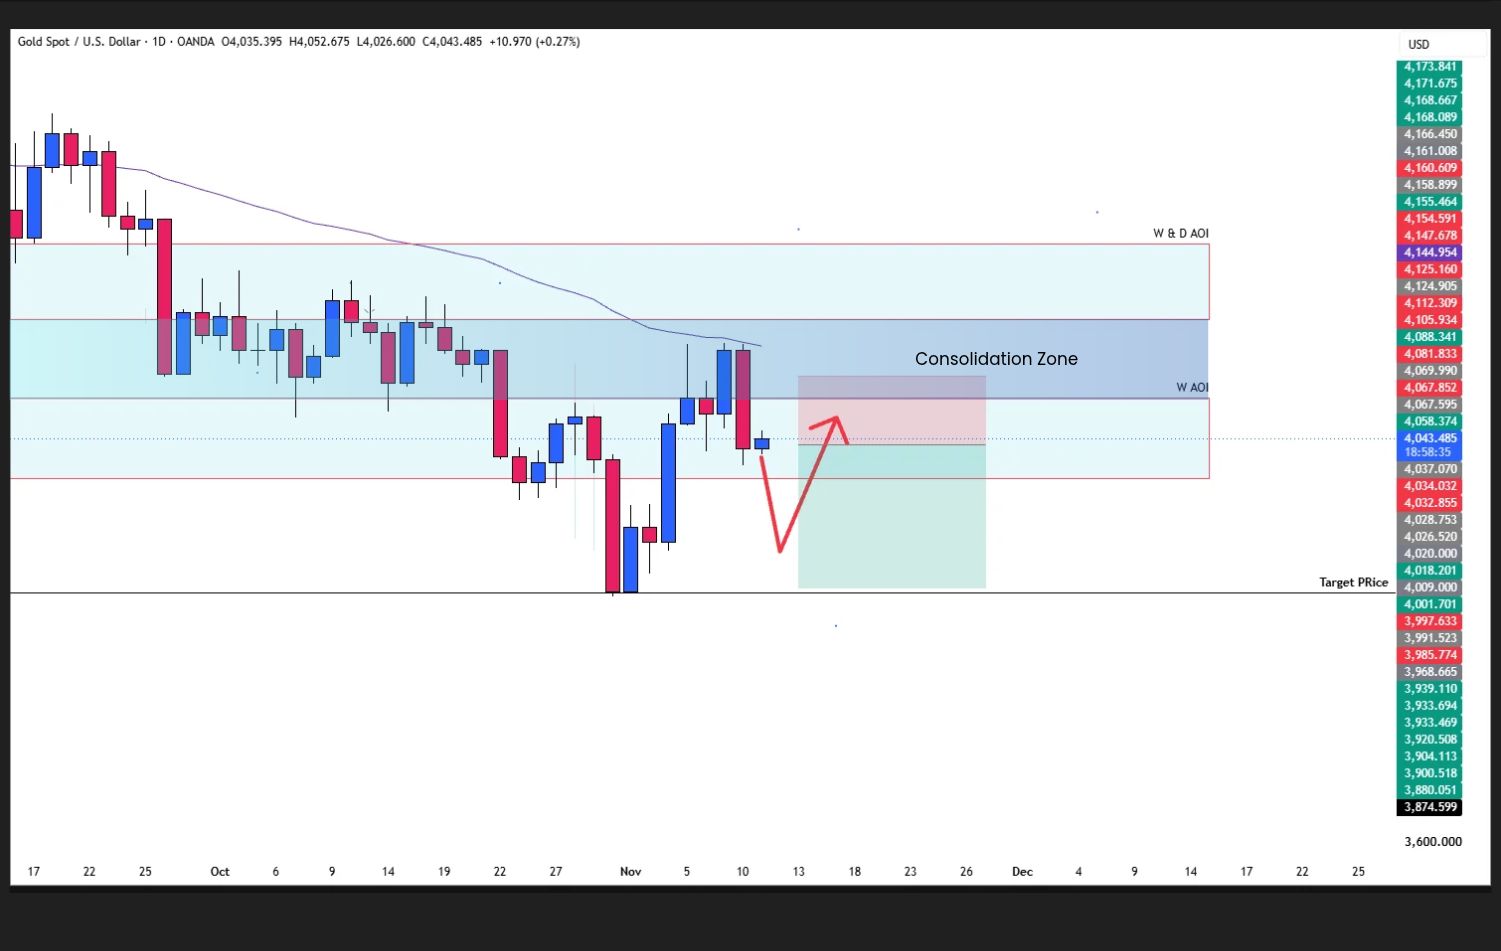
Daily Timeframe Price Action Analysis: A bearish rejection after the breakdown and retest, followed by a break of the rejection candle’s low, would support a potential decline toward $3,880.
Use candlestick confirmation at key levels to assess whether the retest supports renewed selling.
Downside target: $3,880.
A sustained recovery above $4,100, followed by a successful retest as support, would undermine the breakdown. A close back inside the zone would leave the bearish confirmation unresolved.
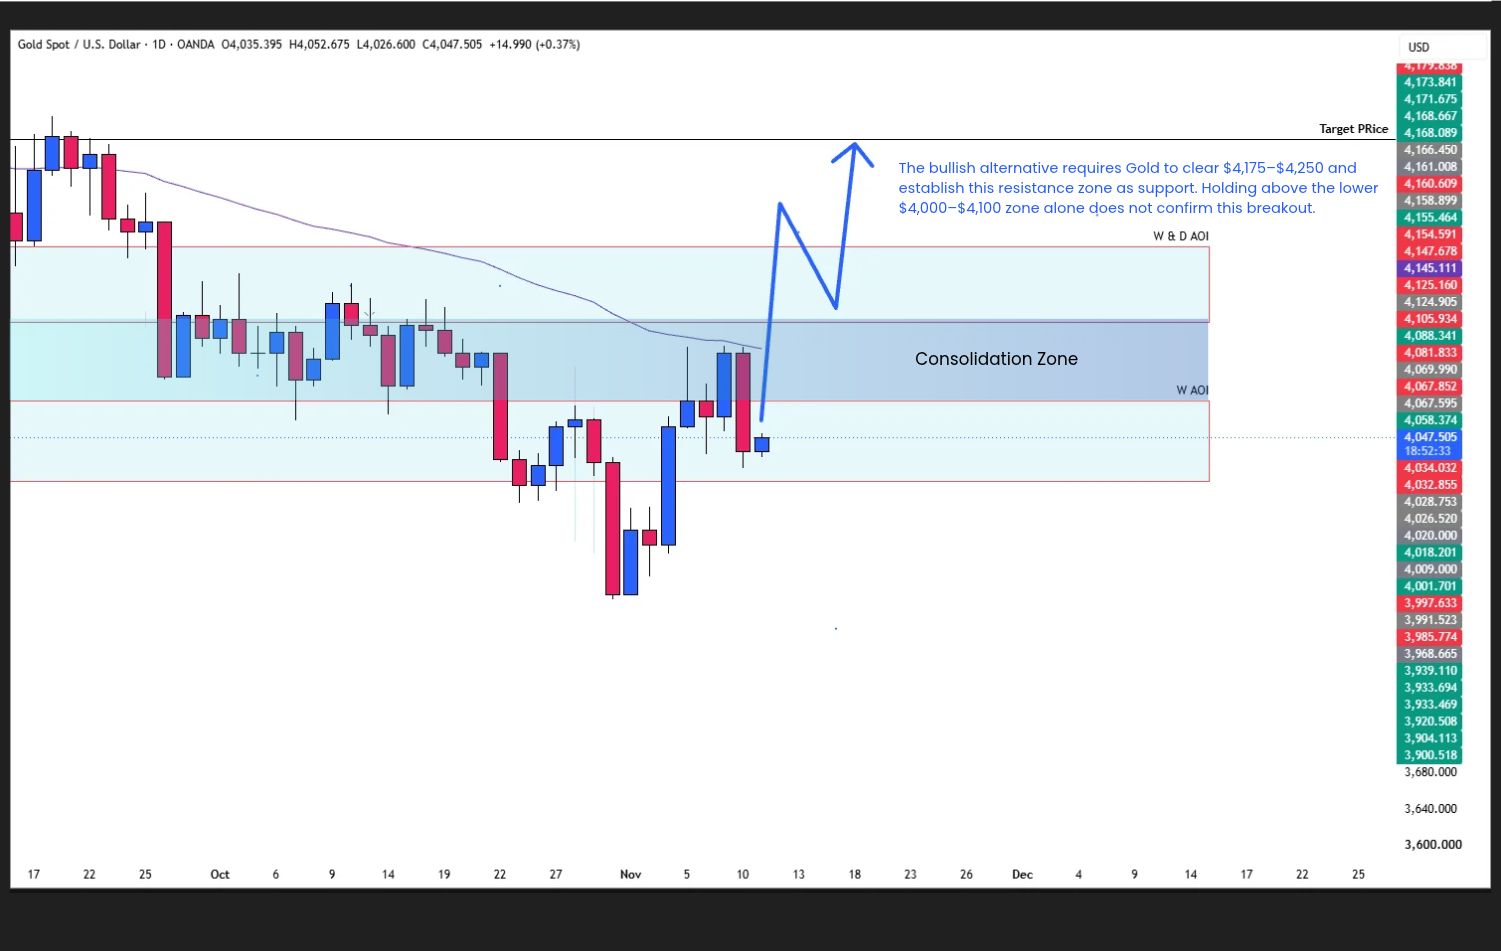
Daily Timeframe Price Action Analysis: Gold’s bullish setup requires a daily close above $4,250 and a successful retest of $4,175–$4,250 as support.
The bullish alternative requires Gold to clear $4,175–$4,250 and establish this resistance zone as support. Holding above the lower $4,000–$4,100 zone alone does not confirm this breakout.
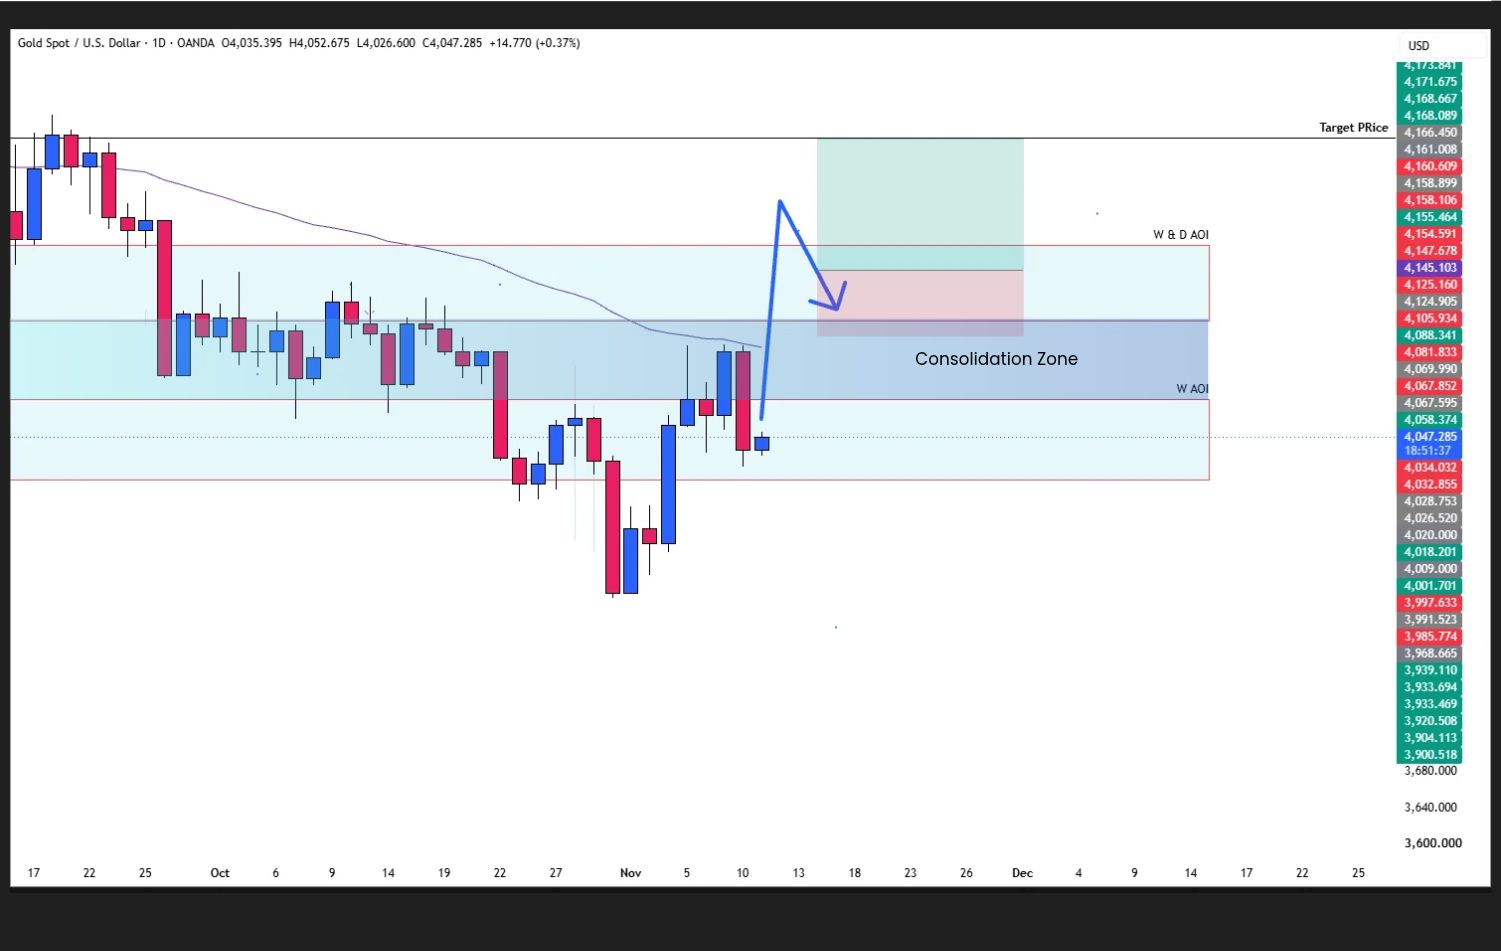
Daily Timeframe Price Action Analysis: A bullish rejection after the breakout and retest, followed by a break of the rejection candle’s high, would support a potential advance toward $4,375.
This break-and-retest pattern helps assess whether buyers are defending former resistance as support.
Upside target: $4,375.
A daily close back below $4,175 would undermine the breakout. A return inside the zone would leave the retest unresolved and raise the possibility of a false breakout.
$4,000–$4,100 is the key support test for the bearish continuation scenario. A daily close below $4,000, followed by a failed retest and downward follow-through, would bring $3,880 into focus.
The bullish alternative requires a daily close above $4,250 and a successful retest of $4,175–$4,250, with $4,375 as the conditional upside objective.
Until either sequence develops, the bearish weekly structure and bullish daily recovery leave Gold with mixed signals and potential consolidation.
_____________________________________________________________________________________
Move from learning price action to applying it in the real market.
Trade:
Access trading platforms and tools including ACY, MT4, MT5, and Copy Trading.
Create an Account and Start Live Trading
_____________________________________________________________________________________
Build your trading foundation with these step-by-step guides:
Learn to read price action and assess trading setups at key levels:
Learn to recognize bullish, bearish and sideways markets:
Learn to mark key levels and interpret price reactions:
Understand recurring price patterns, retests and false breakouts:
Learn to combine candlestick signals with price action analysis:
Learn to recognize patterns that may signal a change in market direction:
Explore how to combine the exponential moving average with price action:
Bring your technical analysis skills together through a gold swing trading guide:
Learn how risk management and position sizing fit into your trading plan:
Learn how to plan take-profit targets using market structure and risk-reward:
Develop discipline, emotional awareness and a more consistent trading process:
Explore the psychological habits behind a disciplined trading approach:
_____________________________________________________________________________________
Not sure where to begin? Here’s a simple roadmap to guide you:
By building step by step; from basics → real trading → mastering the craft, you’ll gain clarity, confidence, and steady progress without ever feeling overwhelmed.

_____________________________________________________________________________________
Follow Ruffy Grant B. Capacio for Gold analysis, Forex trading ideas, price action education, trading psychology, and market insights: LinkedIn
ACY Securities: Join the Discord Server
Disclaimer:
Trading Forex, Gold, CFDs, cryptocurrencies, commodities, indices, and other leveraged financial instruments involves a high degree of risk and may not be suitable for all investors or traders. Market conditions can change rapidly, and leveraged trading can result in losses that occur quickly.
Before trading, carefully consider your investment objectives, level of experience, and risk tolerance. Only trade with capital you can afford to lose and seek independent financial or professional advice where appropriate.
All market analysis, price forecasts, technical commentary, trading scenarios, educational materials, and opinions presented in this content are provided solely for general informational and educational purposes. They do not constitute financial advice, investment advice, a recommendation, solicitation, or an offer to buy or sell any financial instrument.
Past performance and historical price movements are not reliable indicators of future results. Any price levels, targets, scenarios, or market outlooks discussed should be viewed as analysis rather than guarantees of future market performance. November 11, 2026
ACY Securities is one of Australia's fastest growing multi-asset online trading providers, offering ultra-low-cost trading, rock-solid execution, technologically superior account management and premium market analysis.

Select the categories and companies you wish to follow directly to your person rss feed.
Create Custom RSS FeedSign up and join over 5,000 professional members who receive personalized news alerts, curated professional connections, and more for free!
Learn how to set up a day tradeusing price action with five simple steps covering market direction, key levels, entry confirmation, stop loss, and take profit.
Learn price action trading step by step, with beginner and advanced techniques covering market structure, key levels, entry confirmation, and risk management.
Gold price forecast: Will XAUUSD break $4,250 or lose $4,000 support? Explore bullish and bearish setups, with potential targets at $4,375 and $3,880.
smartTrade Technologies SAS has acquired Celoxica, a provider of ultra-low latency execution infrastructure for listed markets across 80+ venues worldwide. The deal extends the smartTrade Group’s reach from OTC to listed markets, and Celoxica General Manager Jean-Marc Bouhelier joins the smartTrade Executive Committee.
The collaboration adds outsourced dealing, real-time risk intelligence and trading-flow surveillance to STARPRIME's institutional liquidity offering.
MAS Markets has appointed Gareth Palmer as eFX Sales, bringing more than 20 years of financial services experience to develop the FCA-regulated liquidity provider’s electronic FX sales capabilities, strengthen institutional client relationships and expand its electronic trading offering across global markets.
Usio has reported third quarter 2026 revenue of $23.8 million, up 12%, with Adjusted EBITDA up 222% to $1.2 million, total payment dollars processed up 25% to $2.73 billion and a sixth consecutive quarterly record in ACH transactions, and has reiterated its guidance of 14% to 16% revenue growth for 2026.
Macquarie Bank has admitted failures in how it promoted its Welcome Rate offer for new savings account customers, with ASIC and Macquarie jointly proposing a $14 million penalty to the NSW Supreme Court, on top of $8.8 million in remediation that Macquarie has already paid to nearly 40,000 customers.
Alta, a new blockchain designed for banks and payment firms, has raised a $47.5 million Series A led by Index Ventures, with GV joining, taking total funding to $80 million. What caught my eye is that Airwallex CEO Jack Zhang is a co-founder and Airwallex is an early design partner, giving Alta access to fiat rails in around 200 countries from day one. Privacy and compliance built into the chain itself is exactly what institutions have been asking for.
DriveWealth, the embedded brokerage engine behind a long list of fintech apps, has secured MiCA authorisation from the Bank of Lithuania. Its EU entity already held a MiFID II licence, so one Vilnius-based firm can now offer partners securities and crypto-assets under a single regulatory roof, with crypto services due in the new year. Add the recent Ripple tie-up for RLUSD settlement and the direction is obvious: stocks, stablecoins and tokenised assets through one API. A shot across the bows for white-label brokerage rivals in Europe.