just now

Liquidity Finder Ltd is incorporated in England and Wales, company number 10610740, registered address 167-169 Great Portland Street, Fifth Floor, London W1W 5PF, United Kingdom.
Published: just now

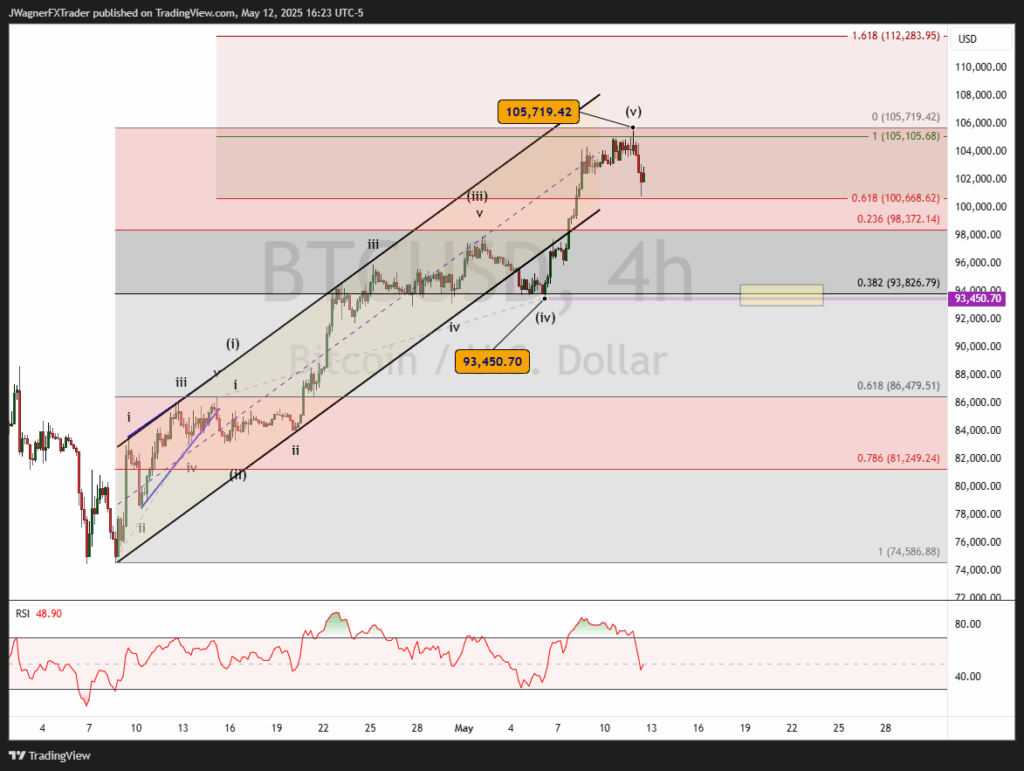
On Sunday, May 11, Bitcoin’s price appears to have completed a bullish Elliott Wave impulse pattern. There are a few scenarios to anticipate after a completed impulse. The majority of those scenarios point towards a complete retracement of the fifth wave of the impulse pattern.
For Bitcoin, this implies a decline back to $93,450.
The rally that began on April 8 to May 11 appears to be a completed impulse pattern consisting of five waves.
There is fairly strong wave geometry creating the impulse pattern.
We can use our Fibonacci extension tool to measure out the length of wave (v) relative to wave (i). Wave (v) is equal to the length of wave (i) near 105k which is a common wave relationship when the third wave is extended.
It appears that wave (v) topped out at 105,719, near the target zone.
Once the impulse pattern completes, oftentimes, the entire fifth wave of the sequence is retraced. This implies a decline to the wave (iv) extreme at $93,450 is a high probability trend.
Also, when we apply the Fibonacci retracement tool to the April 8 to May 11 uptrend, the 38% Fibonacci retracement level crosses right at the wave (iv) at $93,826. This is very common geometry within a bullish impulse pattern.
Notice in the chart above how there is a support shelf of prices near the same $93k. This $93k zone will likely act like a magnet and attract prices.
This does not mean you want to short the market in anticipation of falling prices. The bullish impulse pattern suggests the larger trend is still higher. Therefore, use the falling prices as a means to reload long positions at lower levels.
Prices do not have to stop at $93k. It is possible that a decline could dig deeper to $87k and that would be considered normal after a completed impulse pattern.
A print below the 78.6% Fibonacci retracement level will be an early warning signal that another pattern is developing.
Bitcoin appears to have completed a bullish impulse rally from April 8 to May 11.
A decline to $93,450 would be considered normal within a larger uptrend. The decline could dig deeper to $87k. Once the decline ends, we’re anticipating a new rally to develop to new all-time highs.
If Bitcoin drops below $81k then we’ll consider a different pattern is in development and we’ll need to reassess the wave count.
DISCLAIMER: For educational purposes only. Trading comes with substantial risk, leading to possible loss of your capital. Traders are advised to do their own due diligence before investing.
Alchemy Markets is a multi-asset brokerage providing retail traders with the same elite trading conditions, tools, and transparency typically reserved for institutions.
Select the categories and companies you wish to follow directly to your person rss feed.
Create Custom RSS FeedSign up and join over 5,000 professional members who receive personalized news alerts, curated professional connections, and more for free!
Sterling steadies after political uncertainty rattled gilt markets, while EUR/USD and EUR/GBP approach key technical levels ahead of today's European session.
GBP/AUD remains trapped in a well-defined bearish trend on both the weekly and daily timeframes.
Discover the key drivers, technical levels, and central bank expectations shaping the EUR/USD trend as the ECB prepares to hold rates and markets watch for a potential breakout.
Sydney-based multi-asset broker ACY Securities has introduced PAXGUSD, a new CFD instrument that allows clients to trade tokenised gold against the US Dollar 24 hours a day, seven days a week. The instrument is available across MetaTrader 4, MetaTrader 5, and the ACY Trading Platform.
Binance has lowered its VIP 3 Wallet Assets threshold from $3 million to $1 million and will now count OTC Spot Trading Volume at a 4x multiplier toward VIP qualification, removing the previous VIP 4 cap and allowing eligible users to progress through the full tier framework up to VIP 9.
Retail futures trading leader NinjaTrader Group has appointed Mark Omens as Senior Vice President, Commercial Strategy, bringing a 25-year veteran of derivatives marketplace CME Group into a newly created role focused on exchange partnerships and enterprise growth.
Gold Price Action Forecast: Will XAU/USD Drop to $3930? Meta Description: Read our Gold price action forecast to see if XAU/USD will drop to $3930.
BitDelta Securities Financial Services LLC (“BitDelta Securities”) today announced that it has received full regulatory approval from the Capital Market Authority (“CMA”) of the United Arab Emirates under the Category 5 — Arrangement and Advice license framework (License No. 20200000439). The approval follows the firm's receipt of In-Principal Approval earlier this year and represents the successful conclusion of the CMA's full licensing process, including the satisfaction of capital requirements, governance appointments, and operational setup.
Crypto.com has received a $400 million strategic investment from Citadel Securities, valuing the firm at $20 billion. It marks the first institutional funding round in the company's history, aimed at accelerating its expansion into tokenised securities, derivatives and other asset classes.
WTI’s pullback into $79–82 is the first major test of the bullish Elliott Wave count, with buyers targeting a renewed break above $85.


