just now

Liquidity Finder Ltd is incorporated in England and Wales, company number 10610740, registered address 167-169 Great Portland Street, Fifth Floor, London W1W 5PF, United Kingdom.
Published: just now
The U.S. Dollar Index (DXY) has taken a sharp dip this week, breaking below key trendline support. One major catalyst behind this movement is a credit rating downgrade by Moody’s, a top-tier credit rating agency. Let's break it down step-by-step so you can understand why this is such a big deal.
Moody’s issued a credit rating downgrade for the U.S. government. Think of this like your personal credit score dropping—from “excellent” to just “very good.” It’s not catastrophic, but it’s a warning sign.
The U.S. government has over $36 trillion in debt, and with plans for potential tax cuts and increased spending, that number could rise even higher. Moody’s is concerned about how the government plans to manage such a large amount of borrowing.
When a country's credit rating drops, it's seen as riskier to lend to. Investors then demand higher interest rates to compensate for that risk. That’s why yields on 30-year U.S. Treasury bonds have surged past 5%—a big and fast move.
As confidence drops, foreign investors begin to sell U.S. assets—including the dollar. This triggers a decline in dollar value compared to other currencies around the world.
“The U.S. just got a warning for having too much debt. Investors are now a bit more cautious, so they’re selling U.S. bonds and dollars—which is why the dollar’s been dropping this week.”
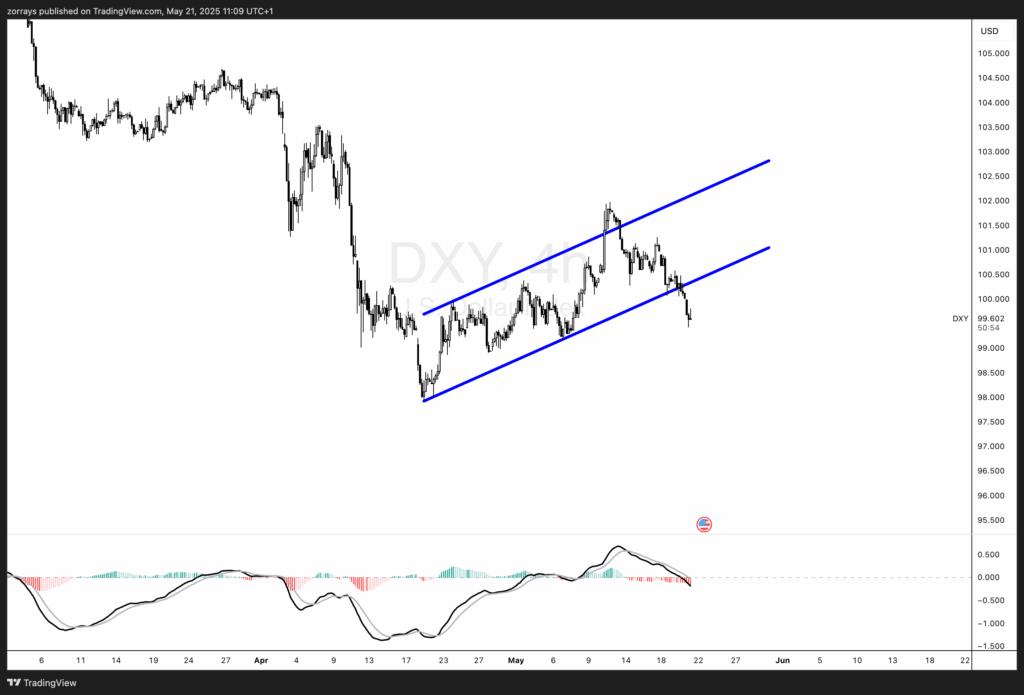
Looking at the 4-hour chart of the U.S. Dollar Index (DXY), we can see a clear breakdown of the rising channel (marked in blue). Here’s what stands out:
Given both the fundamental backdrop (credit rating fears, rising debt concerns) and technical confirmation (channel breakdown + bearish MACD), the dollar is set for further downside in the short to medium term.
Key levels to watch:
Alchemy Markets is a multi-asset brokerage providing retail traders with the same elite trading conditions, tools, and transparency typically reserved for institutions.
Select the categories and companies you wish to follow directly to your person rss feed.
Create Custom RSS FeedSign up and join over 5,000 professional members who receive personalized news alerts, curated professional connections, and more for free!
Gold Price Action Forecast: Will XAU/USD Drop to $3930? Meta Description: Read our Gold price action forecast to see if XAU/USD will drop to $3930.
BitDelta Securities Financial Services LLC (“BitDelta Securities”) today announced that it has received full regulatory approval from the Capital Market Authority (“CMA”) of the United Arab Emirates under the Category 5 — Arrangement and Advice license framework (License No. 20200000439). The approval follows the firm's receipt of In-Principal Approval earlier this year and represents the successful conclusion of the CMA's full licensing process, including the satisfaction of capital requirements, governance appointments, and operational setup.
Crypto.com has received a $400 million strategic investment from Citadel Securities, valuing the firm at $20 billion. It marks the first institutional funding round in the company's history, aimed at accelerating its expansion into tokenised securities, derivatives and other asset classes.
WTI’s pullback into $79–82 is the first major test of the bullish Elliott Wave count, with buyers targeting a renewed break above $85.

BitDelta Securities has secured a full CMA Category 5 licence in the UAE and opened a regulated office in Business Bay, Dubai. The firm operates as an introducing broker, connecting investors with licensed international brokers across multiple asset classes, with CEO Dr. Demetrios Zamboglou commenting on the milestone.
Index volatility is asleep while single stocks fight it out underneath, credit refuses to confirm the equity rally, and a bare macro calendar hands next week to oil.
Digital assets and FX brokerage GC Exchange FZE (GCEX) has appointed Mohammed A. Mulla as a Board Member of its Dubai-based entity, part of the wider GCEX Group.
Learn what Blockchain-as-a-Service is, how it works, and why businesses are using BaaS to build blockchain applications without managing infrastructure.
CFDs vs stocks compared on leverage, ownership, costs, dividends, taxes, and risk. Learn the differences between stocks and CFDs and discover which suits your investing or trading goals.
Want to master the markets? A winning trading mindset beats a perfect strategy. Learn how emotional discipline helps you conquer fear and avoid heavy losses.


