just now

Liquidity Finder Ltd is incorporated in England and Wales, company number 10610740, registered address 167-169 Great Portland Street, Fifth Floor, London W1W 5PF, United Kingdom.
Published: just now


Key Takeaways (TL;DR):
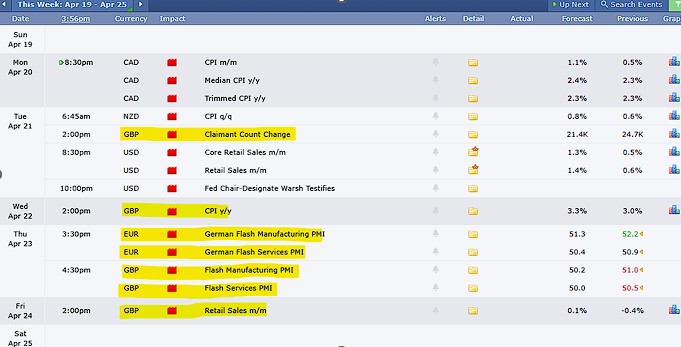
Key upcoming and recent high-impact events influencing EUR/GBP include:
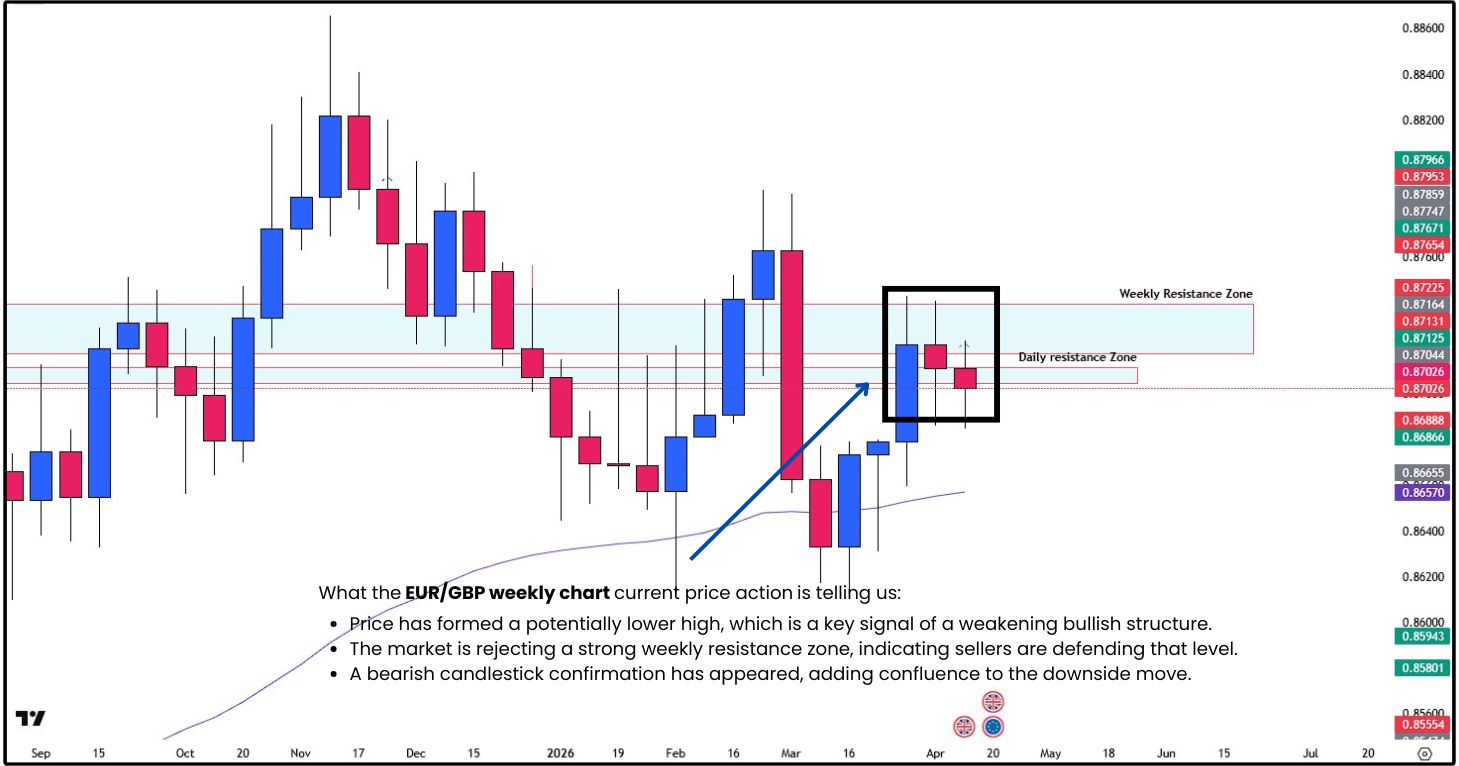
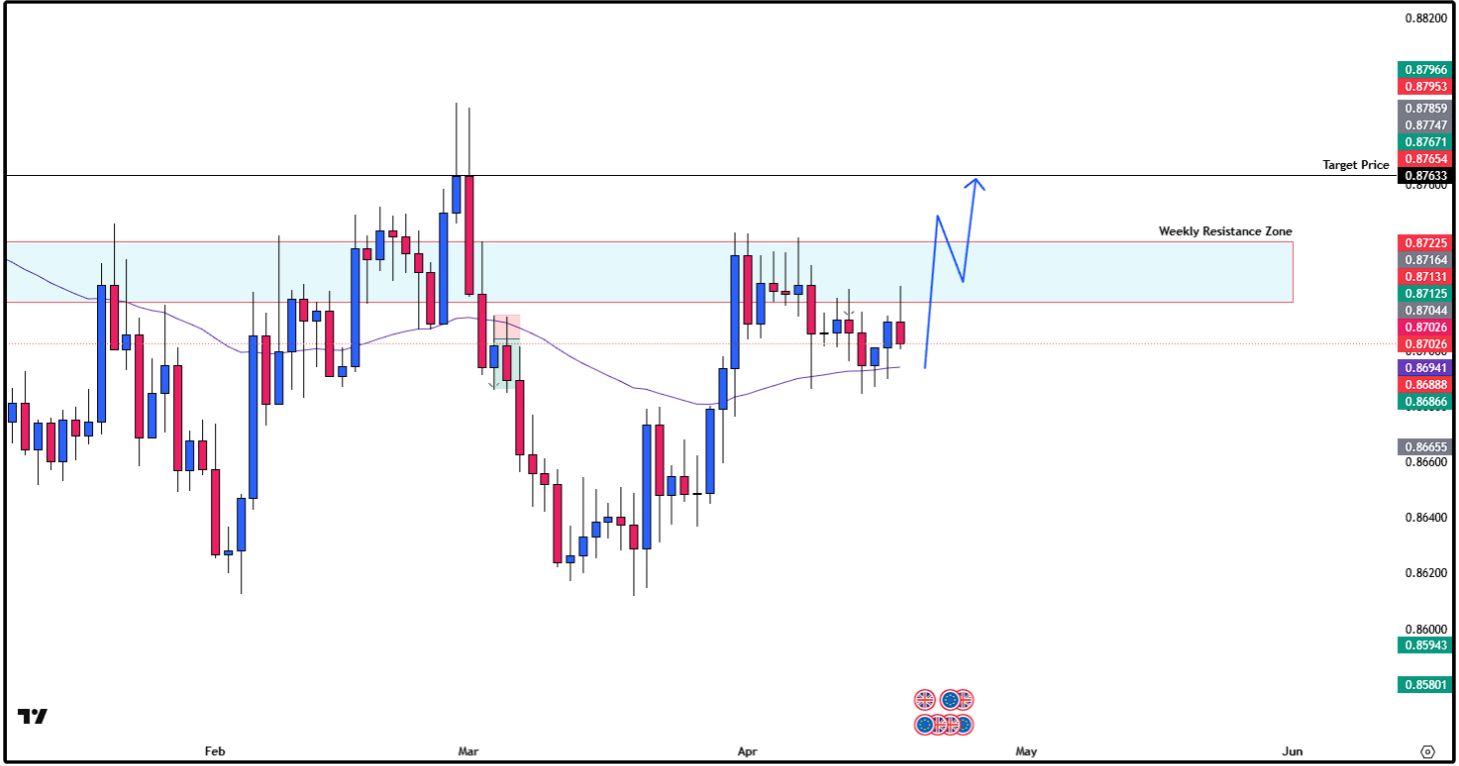
From a simple pure technical perspective, the EUR/GBP weekly chart is showing clear signs of bearish trend. The market structure and candlestick behavior both support a downside bias, especially for traders who rely on simple support and resistance analysis.
What the chart is telling us:
In simple terms, when price fails to go higher and starts turning down from resistance, it often means buyers are losing control and sellers are stepping in. This increases the probability of a downward move.
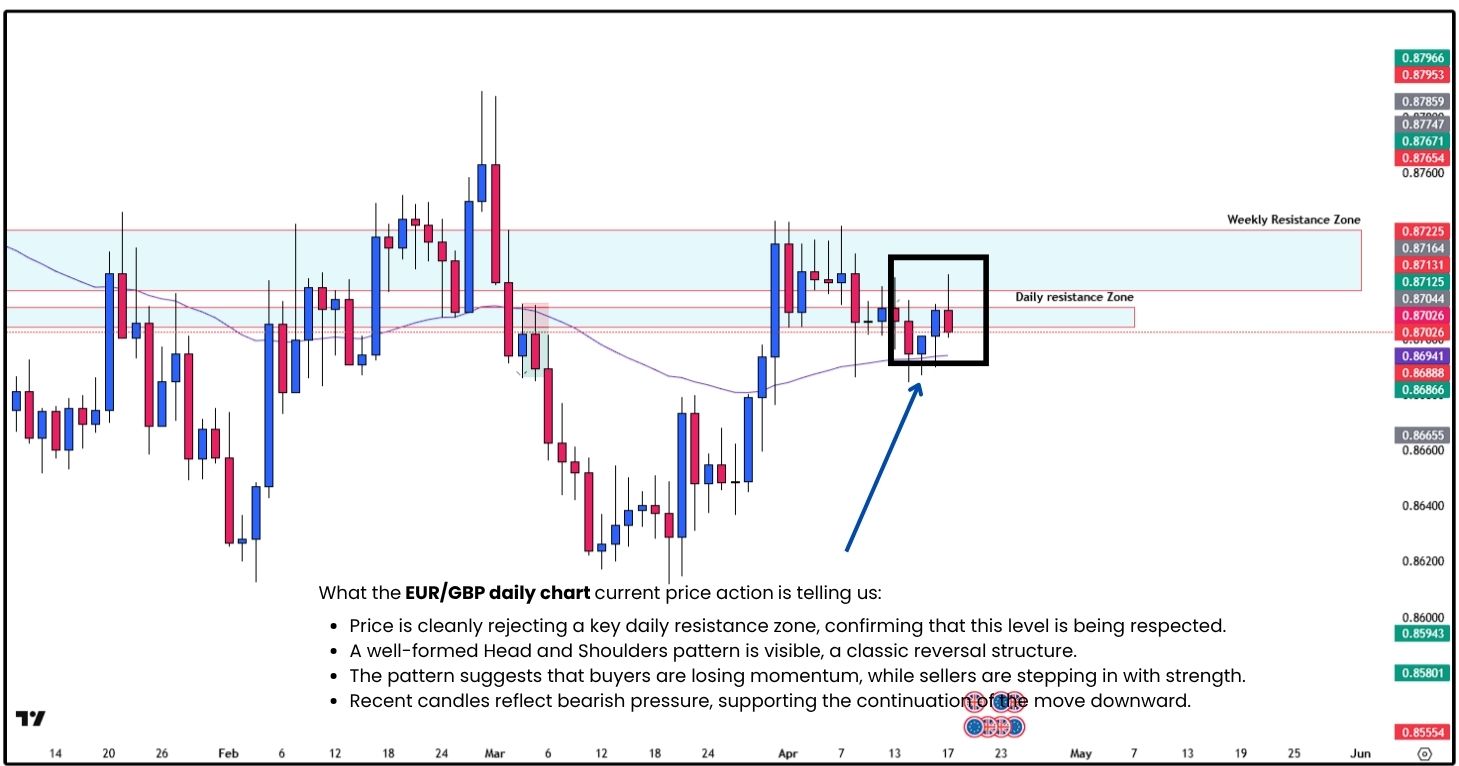
On the EUR/GBP daily chart, the market continues to align with the bearish bias seen on the higher timeframe. Price action is clean and structured, showing clear signs of distribution and seller dominance.
What the daily chart is showing:
EUR/GBP remains bearish bias if:
This is the higher-probability setup since it aligns with the overall trend.
EUR/GBP remains bullish bias if:
Note: Trading against the trend is generally much less favorable counter -trend trade generally carries lower probability and less favorable risk-to-reward conditions.
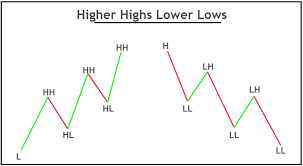
In a bullish trend, a higher low often signals a potential buy opportunity; price is pulling back, but buyers are still stepping in stronger than before.
In a bearish trend, a lower high can signal a potential sell opportunity; price tries to rise, but sellers keep pushing it lower.
Simply put:

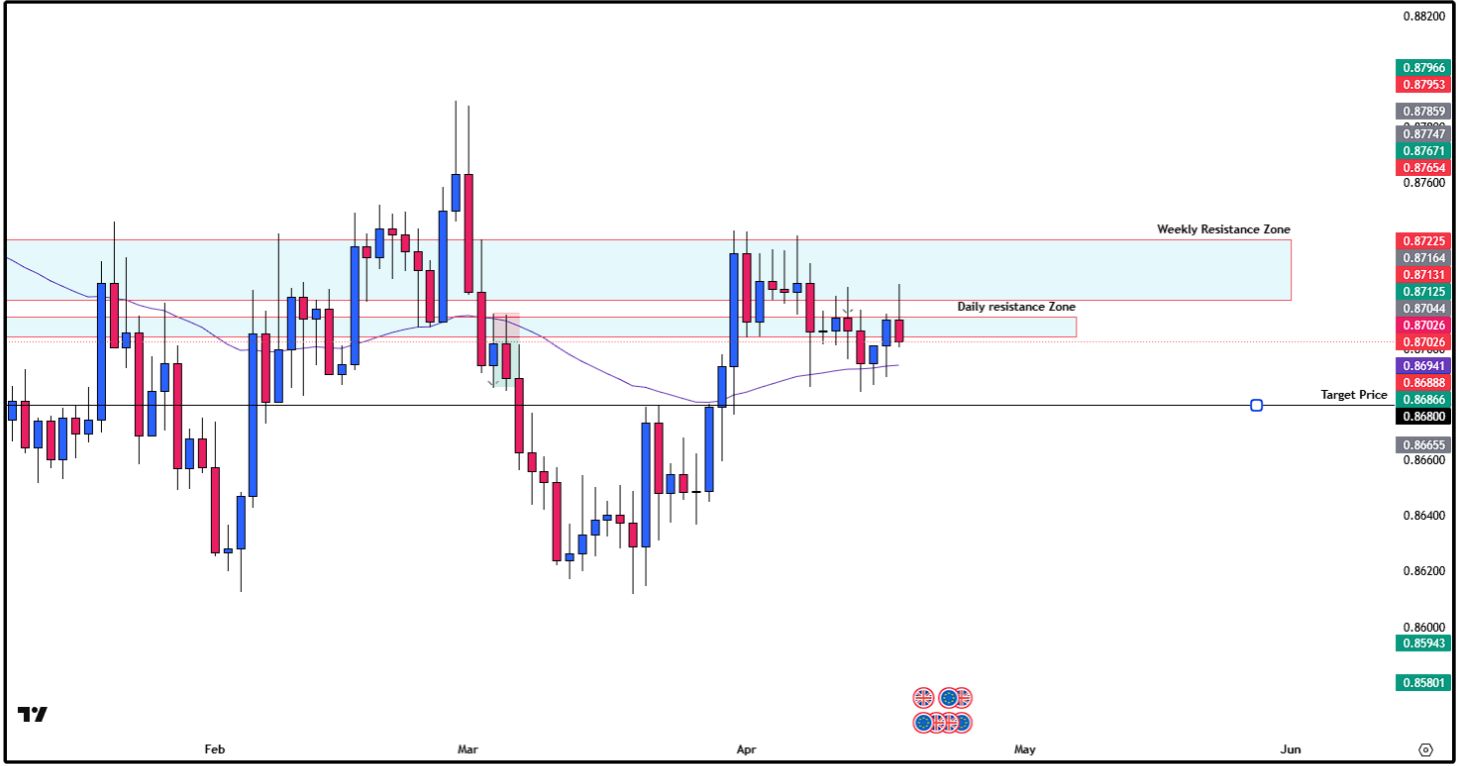
EUR/GBP is still bearish as long as price stays below 0.87116 - 0.87395. If resistance holds, the move toward 0.86800 is likely.
But if price breaks above 0.87395, bias shifts bullish toward 0.87629.
The key lesson here is simple.
Don’t force the direction.
Let the market show you the path!
Good trading is not about forcing, it’s about reacting with patience and clarity.
Start your live trading journey today!
• Trade Forex, indices, gold, crypto and other global markets
• Access powerful platforms including ACY, MT4, MT5, and Copy Trading tools
Move from learning simple price action to executing it in the real market with confidence!
Create an Account. Start Your Live Trading Now!
Ready to learn simple price action strategy? Here’s how to do it step by step:
Gold is still one of the most traded assets, here’s how to trade it with confidence:
Your mindset is what separates steady growth from costly mistakes. Focus on these essentials:
Not sure where to begin? Here’s a simple roadmap to guide you:
By building step by step; from basics → real trading → mastering the craft, you’ll gain clarity, confidence, and steady progress without ever feeling overwhelmed.
Follow me for more daily market insights!
Ruffy Grant B. Capacio - LinkedIn
Disclaimer:
Trading forex and derivative instruments involves substantial risk and may not be suitable for all individuals. Only use funds that you are prepared to lose. It is important to understand how these markets work and the risks involved before trading, and to seek independent financial advice if needed. All market analysis and insights shared are intended for educational and informational purposes only and should not be considered financial or investment advice. April 20, 2026
ACY Securities is one of Australia's fastest growing multi-asset online trading providers, offering ultra-low-cost trading, rock-solid execution, technologically superior account management and premium market analysis.
Select the categories and companies you wish to follow directly to your person rss feed.
Create Custom RSS FeedSign up and join over 5,000 professional members who receive personalized news alerts, curated professional connections, and more for free!
Sterling steadies after political uncertainty rattled gilt markets, while EUR/USD and EUR/GBP approach key technical levels ahead of today's European session.
GBP/AUD remains trapped in a well-defined bearish trend on both the weekly and daily timeframes.
Discover the key drivers, technical levels, and central bank expectations shaping the EUR/USD trend as the ECB prepares to hold rates and markets watch for a potential breakout.
Sydney-based multi-asset broker ACY Securities has introduced PAXGUSD, a new CFD instrument that allows clients to trade tokenised gold against the US Dollar 24 hours a day, seven days a week. The instrument is available across MetaTrader 4, MetaTrader 5, and the ACY Trading Platform.
Binance has lowered its VIP 3 Wallet Assets threshold from $3 million to $1 million and will now count OTC Spot Trading Volume at a 4x multiplier toward VIP qualification, removing the previous VIP 4 cap and allowing eligible users to progress through the full tier framework up to VIP 9.
Retail futures trading leader NinjaTrader Group has appointed Mark Omens as Senior Vice President, Commercial Strategy, bringing a 25-year veteran of derivatives marketplace CME Group into a newly created role focused on exchange partnerships and enterprise growth.
Gold Price Action Forecast: Will XAU/USD Drop to $3930? Meta Description: Read our Gold price action forecast to see if XAU/USD will drop to $3930.
BitDelta Securities Financial Services LLC (“BitDelta Securities”) today announced that it has received full regulatory approval from the Capital Market Authority (“CMA”) of the United Arab Emirates under the Category 5 — Arrangement and Advice license framework (License No. 20200000439). The approval follows the firm's receipt of In-Principal Approval earlier this year and represents the successful conclusion of the CMA's full licensing process, including the satisfaction of capital requirements, governance appointments, and operational setup.
Crypto.com has received a $400 million strategic investment from Citadel Securities, valuing the firm at $20 billion. It marks the first institutional funding round in the company's history, aimed at accelerating its expansion into tokenised securities, derivatives and other asset classes.
WTI’s pullback into $79–82 is the first major test of the bullish Elliott Wave count, with buyers targeting a renewed break above $85.


