just now

Liquidity Finder Ltd is incorporated in England and Wales, company number 10610740, registered address 167-169 Great Portland Street, Fifth Floor, London W1W 5PF, United Kingdom.
Published: just now

EURUSD is sitting at a technical and macro crossroads. Shorter-term price action shows compression inside aa daily triangle, while the weekly structure highlights a larger ascending channel capped by a long-term descending trendline.
At the same time, rate-cut expectations in the United States are building, but incoming data this week will guide how credible that path truly is.
This creates an environment where the outlook is not strongly bearish or bullish, but instead defined by caution and the need for confirmation.
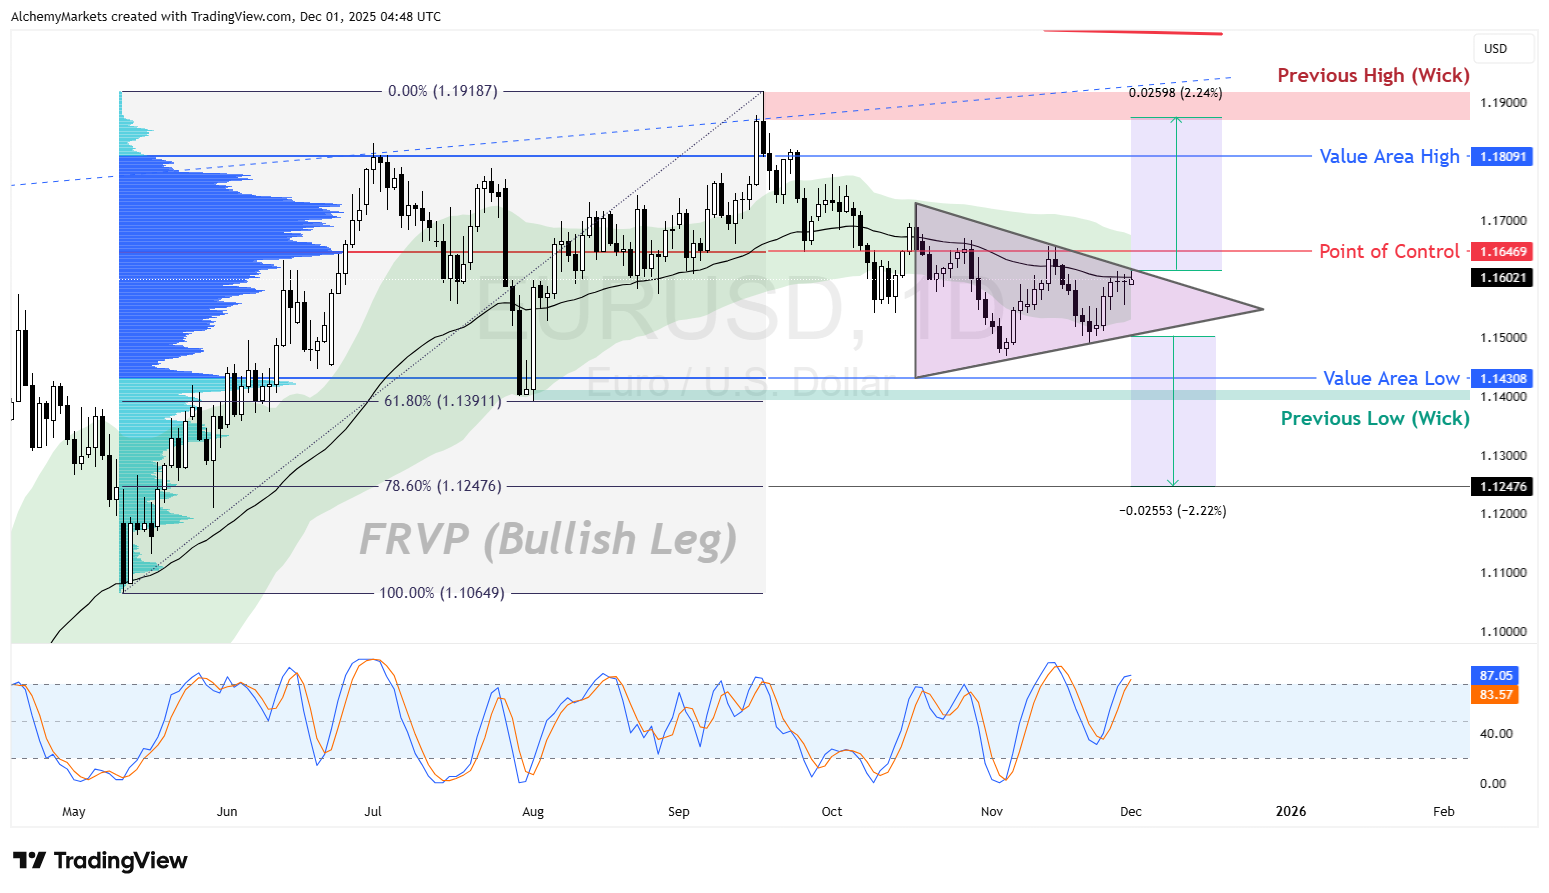
EURUSD is trading within a symmetrical triangle after breaking below the 1D 50 EMA.
We’re using the Bollinger Bands® with 1 standard deviation to capture deviations from the 50 EMA, as long as the price has not broken the upper or lower band, the trend remains intact.
For now, the price has broken down from the bands, which sets our analysed daily trend to short term bearish. But, deviations from the mean have been contained, and the slope of the EMA has softened, which keeps the pair in a neutral stance.
This signals that the market has shifted to a more cautious tone, but has not entered a disorderly downtrend.
Key levels stand out clearly:
Price is sitting just below the EMA midline, so short-term trend pressure leans lower, but the structure still allows for a rebound toward the POC if USD data softens.
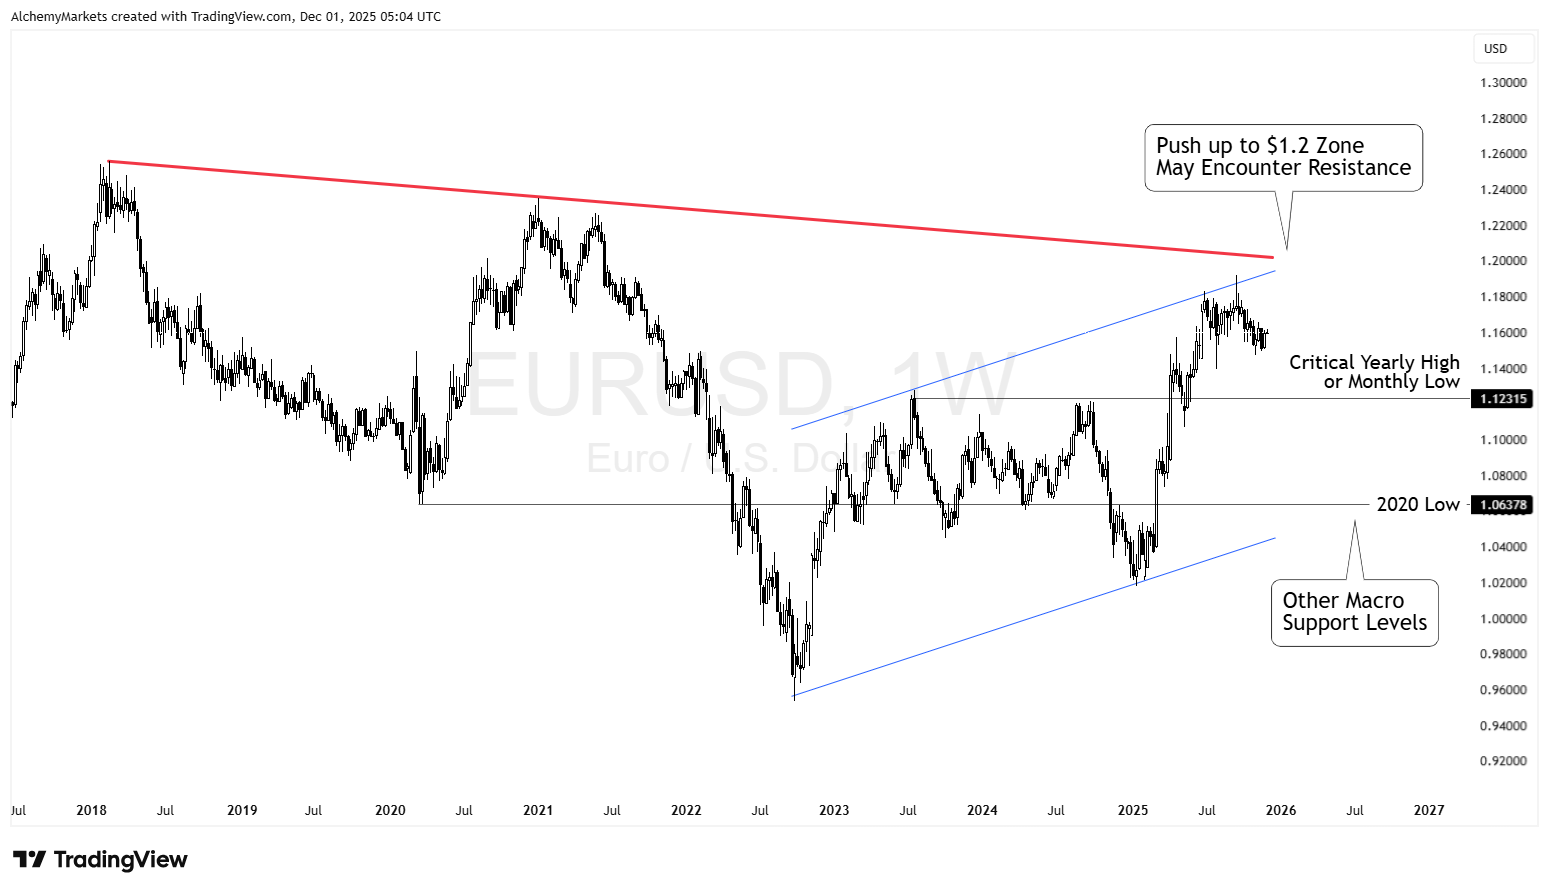
The weekly chart shows EURUSD climbing within a well-defined ascending channel since the 2022 lows.
This shows an improving medium-term tone, but the pair remains capped by a long-term descending trendline from the 2018 highs. The clash between these two structures creates a zone of heavy resistance near the 1.20 region.
Important weekly levels include:
This broader context shows that EURUSD has room to move inside the channel, but meaningful upside requires clearing long-term resistance, which has rejected price multiple times over the past six years.
Markets are gradually pricing in Fed rate cuts for 2026. This is supportive for EURUSD because a softer USD environment naturally lifts the pair. However, this view still depends on incoming data.
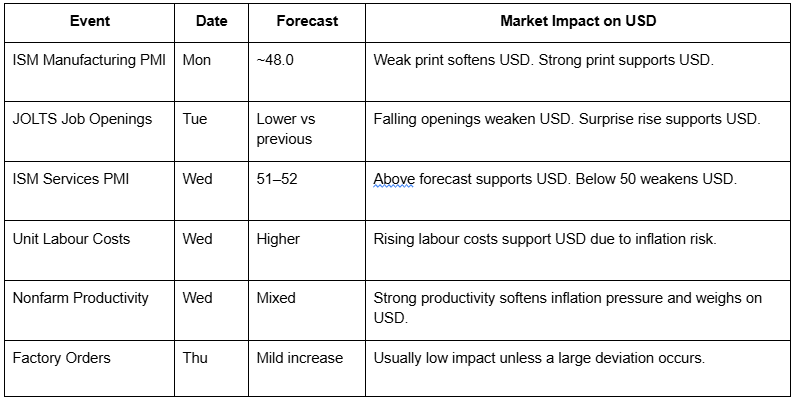
This week brings JOLTS, ISM Manufacturing, ISM Services, and labour-cost figures. These will help determine if the Federal Reserve can maintain a path toward easing or if inflation-linked components remain sticky.
If the data remains firm, the USD can strengthen temporarily, and EURUSD may stay inside the lower part of the daily triangle. If the figures soften, the pair may rebound into the POC and retest upper levels of the compression pattern.
Since the ECB does not have major events this week, the euro remains reactive to USD movements rather than driven by its own catalysts.
Overall, EURUSD sits in a neutral but sensitive zone. The daily triangle shows that momentum is compressing, while the weekly chart highlights significant resistance above and well-defined support below.
The macro landscape leans toward a weaker USD over the medium term, but the near-term trend remains dependent on how this week’s data shifts rate expectations.
Upside moves face layered resistance, and downside swings have clear support levels. With both charts signalling equilibrium rather than a defined trend, patience is warranted until price breaks from the daily triangle or macro data provides a clearer signal of whether the easing cycle is progressing or being pushed back again.
DISCLAIMER: For educational purposes only. Trading comes with substantial risk, leading to possible loss of your capital. Traders are advised to do their own due diligence before investing.
You might also be interested in:
Silver’s Shining Moment: A Cup, a Handle, and a Big Week Ahead for Markets
Alchemy Markets is a multi-asset brokerage providing retail traders with the same elite trading conditions, tools, and transparency typically reserved for institutions.
Select the categories and companies you wish to follow directly to your person rss feed.
Create Custom RSS FeedSign up and join over 5,000 professional members who receive personalized news alerts, curated professional connections, and more for free!
Sydney-based multi-asset broker ACY Securities has introduced PAXGUSD, a new CFD instrument that allows clients to trade tokenised gold against the US Dollar 24 hours a day, seven days a week. The instrument is available across MetaTrader 4, MetaTrader 5, and the ACY Trading Platform.
Binance has lowered its VIP 3 Wallet Assets threshold from $3 million to $1 million and will now count OTC Spot Trading Volume at a 4x multiplier toward VIP qualification, removing the previous VIP 4 cap and allowing eligible users to progress through the full tier framework up to VIP 9.
Retail futures trading leader NinjaTrader Group has appointed Mark Omens as Senior Vice President, Commercial Strategy, bringing a 25-year veteran of derivatives marketplace CME Group into a newly created role focused on exchange partnerships and enterprise growth.
Gold Price Action Forecast: Will XAU/USD Drop to $3930? Meta Description: Read our Gold price action forecast to see if XAU/USD will drop to $3930.
BitDelta Securities Financial Services LLC (“BitDelta Securities”) today announced that it has received full regulatory approval from the Capital Market Authority (“CMA”) of the United Arab Emirates under the Category 5 — Arrangement and Advice license framework (License No. 20200000439). The approval follows the firm's receipt of In-Principal Approval earlier this year and represents the successful conclusion of the CMA's full licensing process, including the satisfaction of capital requirements, governance appointments, and operational setup.
Crypto.com has received a $400 million strategic investment from Citadel Securities, valuing the firm at $20 billion. It marks the first institutional funding round in the company's history, aimed at accelerating its expansion into tokenised securities, derivatives and other asset classes.
WTI’s pullback into $79–82 is the first major test of the bullish Elliott Wave count, with buyers targeting a renewed break above $85.

BitDelta Securities has secured a full CMA Category 5 licence in the UAE and opened a regulated office in Business Bay, Dubai. The firm operates as an introducing broker, connecting investors with licensed international brokers across multiple asset classes, with CEO Dr. Demetrios Zamboglou commenting on the milestone.
Index volatility is asleep while single stocks fight it out underneath, credit refuses to confirm the equity rally, and a bare macro calendar hands next week to oil.
Digital assets and FX brokerage GC Exchange FZE (GCEX) has appointed Mohammed A. Mulla as a Board Member of its Dubai-based entity, part of the wider GCEX Group.


