


Explore Companies BySectors & Categories
Explore Companies ByUse Cases
Explore Companies ByProducts & Services
Explore Companies ByRankings & Reviews
Featured NewsCompaniesMarketsCryptoTechRegulatoryCommentaryUKUSWorldMore

    Latest Wires

      Daily Newsletter

      LF Daily News

      Daily industry focused newsletter giving you an overview for the financial & finTech industry.

      See All Newsletters
      By clicking "Sign Up" you are agreeing to our Terms of Service and Privacy Policy

      GBPUSD Price Action Forecast: Weekly Resistance Caps Recovery as Bears Watch 1.33055

      Published: just now

      GBPUSD Price Action Forecast: Weekly Resistance Caps Recovery as Bears Watch 1.33055

      Post illustration


      GBPUSD Price Action Market Narrative


      The GBPUSD price forecast carries a bearish weekly bias, with price rejecting 1.34080–1.34590 and trading below the 50-week EMA. However, the daily market structure remains bullish, leaving a potential bearish reversal unconfirmed.

      The main setup requires a break below 1.33055–1.33240, followed by a retest of this daily support zone as resistance. A bearish rejection and downward follow-through would strengthen the case for a decline toward 1.32181.

      Alternatively, a confirmed break above 1.34080–1.34590, followed by a successful retest as support, would weaken the weekly bearish outlook and bring 1.35455 into focus.


      Key Takeaways

      1. Weekly market structure shifted bearish approximately seven weekly candles ago, according to the supplied analysis.
      2. 1.34080–1.34590 is the major weekly resistance zone.
      3. Price is below the 50-week and 50-day EMAs, but the daily structure remains bullish.
      4. The bearish setup requires a confirmed break and retest of 1.33055–1.33240.
      5. 1.32181 is the conditional downside target.
      6. 1.35455 is the bullish objective after a confirmed breakout above 1.34590 and successful retest.


      Red Folder Events: What High-Impact News Could Move GBPUSD?


      GBPUSD reflects the pound’s value against the US dollar, making developments in both economies relevant. Interest rate decisions and changes in policy expectations can influence exchange rates, as explained by the Bank of England.

      Key releases and announcements to monitor include:

      1. UK inflation: CPI releases may change expectations for Bank of England policy.
      2. UK employment and wage data: Labour market conditions can influence the interest rate outlook.
      3. UK GDP: Growth figures provide context for the strength of the economy.
      4. Bank of England announcements: Rate decisions, voting patterns and policy guidance can affect sterling.
      5. US CPI and PCE inflation: Inflation reports can change expectations for Federal Reserve policy.
      6. US Non-Farm Payrolls: Employment data can influence the US dollar and the interest rate outlook.
      7. Federal Reserve announcements: Rate decisions and policy commentary can affect dollar demand.


      Check the Finlogix Economic Calendar for upcoming releases and scheduled times.

      Watch how price reacts around 1.33055–1.33240 and 1.34080–1.34590 after major news. A brief move through either zone is less convincing than a daily close followed by a successful retest.

      News can act as a catalyst, but both scenarios still require price confirmation at the marked levels.

      GBPUSD Technical Analysis: What Does Price Action Show?


      Weekly Chart: Resistance Rejection Supports the Bearish Bias

      Post illustration

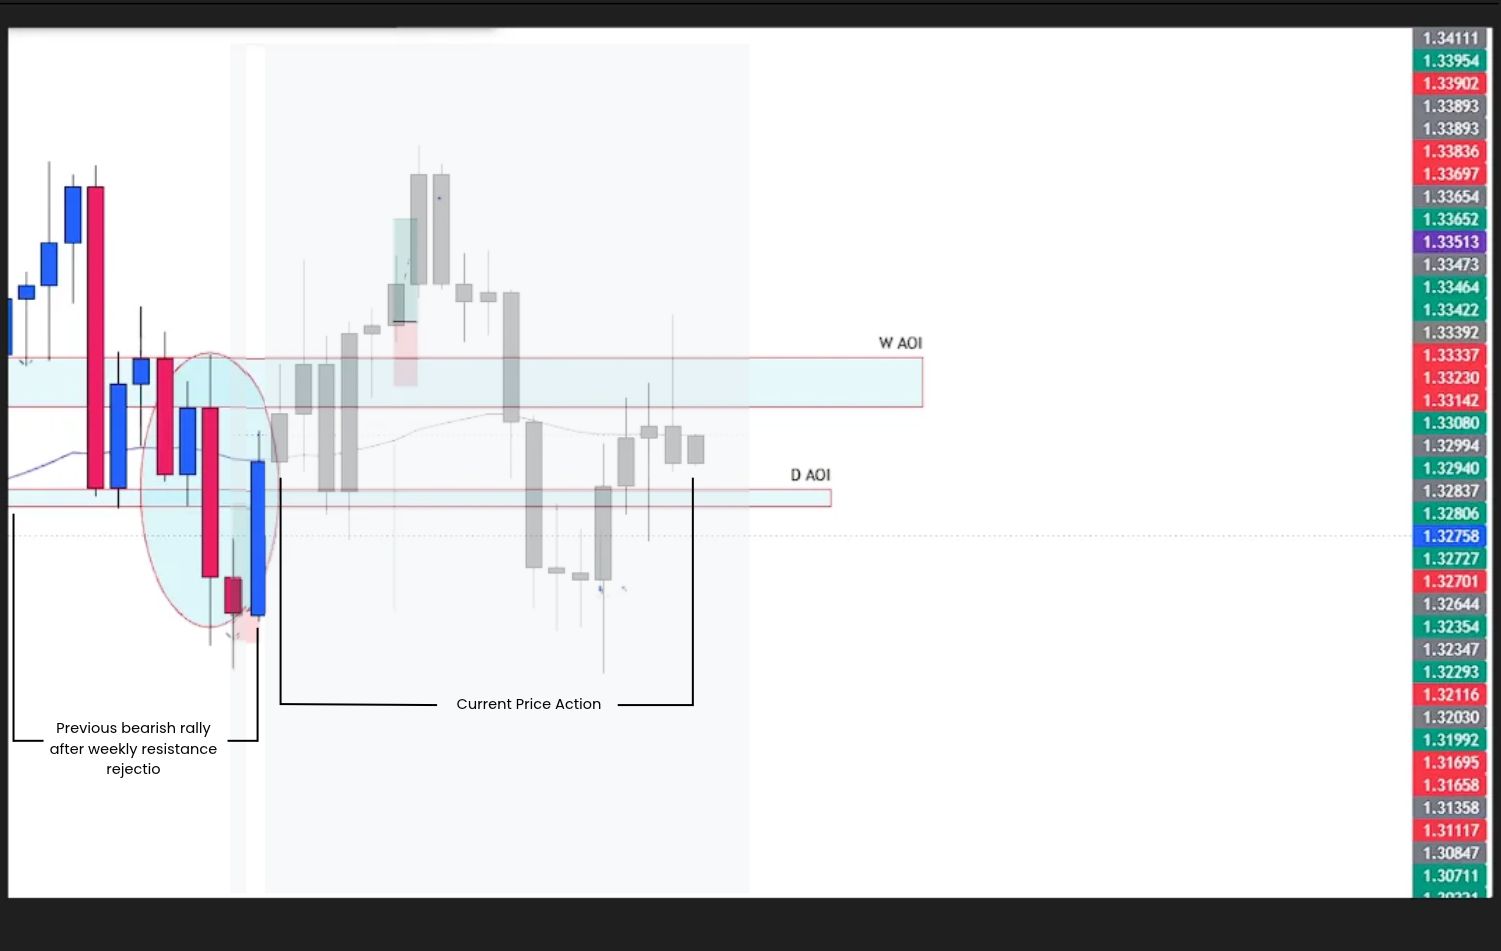
      Weekly Chart Price Action Analysis: GBPUSD rejects 1.34080–1.34590 beneath the 50-week EMA, supporting a bearish weekly bias.

      The supplied weekly analysis identifies a bearish shift approximately seven weekly candles ago. Price is now rejecting 1.34080–1.34590, an area associated with strong selling in the chart history described.
      Post illustration

      Weekly Support and Resistance Analysis: GBPUSD tests the 1.34080–1.34590 resistance zone, where previous selling pressure highlights a key area to watch for bearish continuation.

      That previous reaction makes the zone relevant, but it does not guarantee another decline of the same size.

      1. Weekly market structure supports a bearish bias.
      2. Price shows bearish rejection at 1.34080–1.34590.
      3. The 50-week EMA sits above price and may act as secondary resistance.


      The combination supports watching for a continuation setup. However, the EMA is a reference for trend and price behavior; it does not cause selling, or guarantee resistance will hold.

      Understanding how to identify support and resistance helps place this rejection within the broader structure.

      Daily Chart: Bullish Structure Faces Pressure From Weekly Resistance

      Post illustration

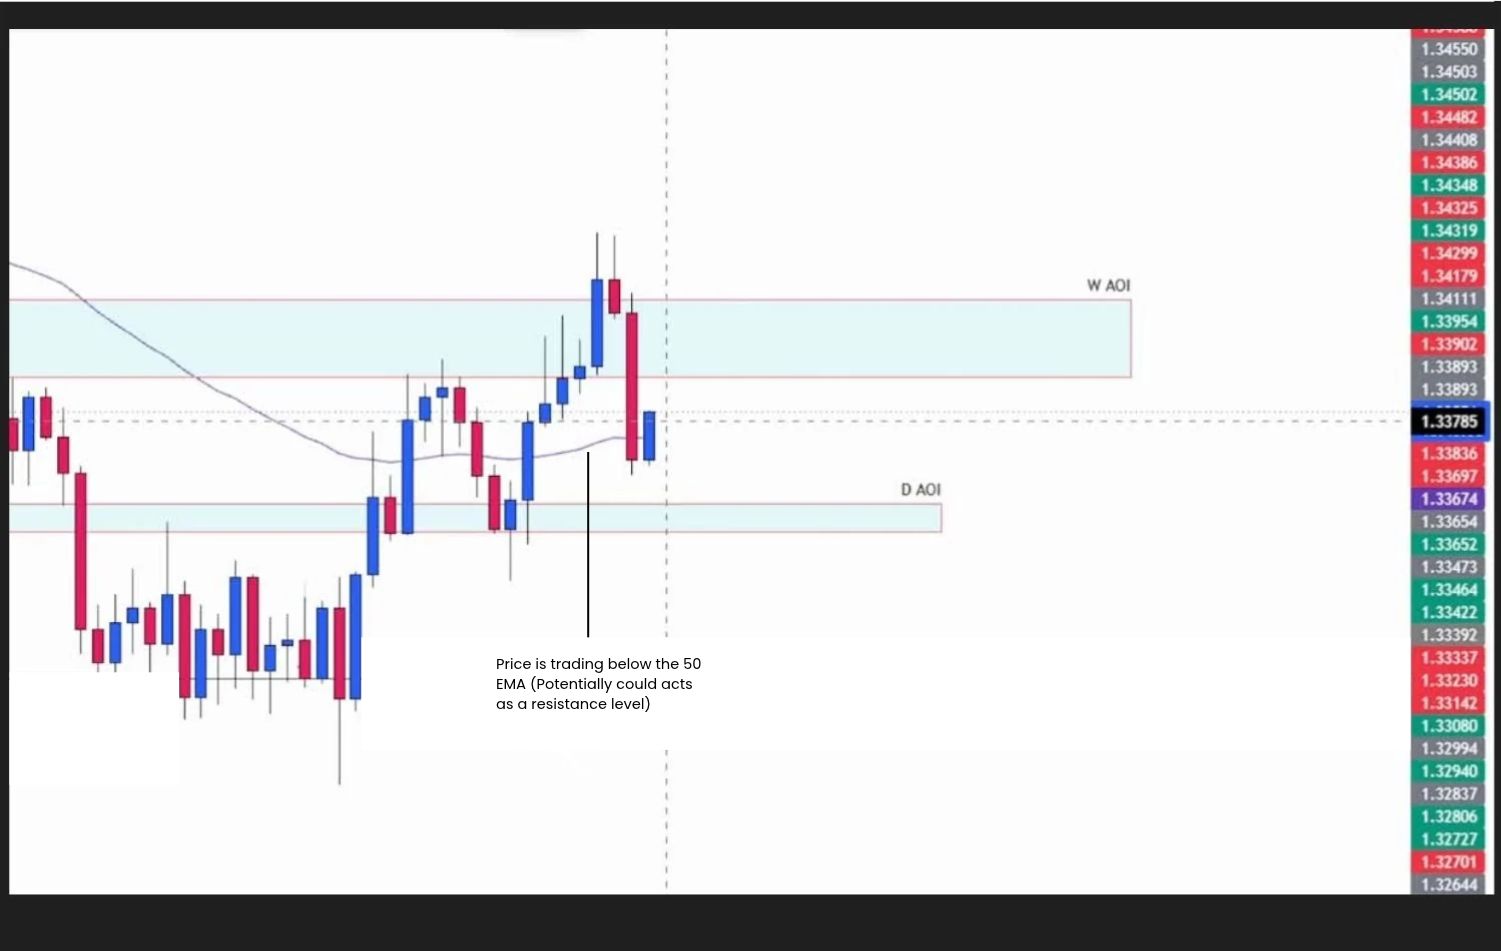
      Daily Chart Price Action Analysis: GBPUSD retains a bullish daily structure despite trading below the 50-day EMA, with 1.33055–1.33240 as the key support zone to watch.

      The daily chart remains structurally bullish despite the bearish weekly backdrop. This is the main reason to wait for confirmation before treating the current rejection as a daily reversal.

      Rejection at weekly resistance suggests selling pressure is emerging, while price below the 50-day EMA adds a bearish trend signal. Neither observation alone confirms that the daily bullish structure has broken.

      The key test is 1.33055–1.33240:

      1. Holding this support zone would keep the potential for another daily bullish recovery alive.
      2. A daily body close below 1.33055 would break the marked support zone.
      3. A failed retest from below, followed by further selling, would strengthen the case for a daily bearish shift.


      The weekly chart provides context, while the daily chart provides the setup confirmation. A higher timeframe does not automatically override a lower timeframe.

      Combining the EMA indicator with price action analysis helps distinguish trend signals from an actual break in structure.


      GBPUSD Support and Resistance Levels to Watch

      Technical levelSignificance
      1.34080–1.34590Major weekly resistance; potential support after a confirmed breakout
      1.34590Upper boundary to clear for the bullish scenario
      1.33055–1.33240Daily support; potential resistance only after a confirmed breakdown
      1.33055Lower boundary to break for the bearish scenario
      1.32181Next identified support and conditional downside target
      1.35455Next identified resistance and conditional upside target

      GBPUSD Price Forecast: Bearish and Bullish Scenarios


      Bearish Scenario: Support Break Could Bring 1.32181 Into Focus

      Post illustration

      Daily Timeframe Price Action Analysis: GBPUSD bearish confirmation requires a daily close below 1.33055, followed by a failed retest of 1.33055–1.33240 as resistance.

      The bearish setup requires daily support at 1.33055–1.33240 to fail. Until that happens, selling pressure at weekly resistance remains an early warning rather than a confirmed daily reversal.


      Bearish confirmation checklist:

      Post illustration

      Daily Timeframe Price Action Analysis: GBPUSD’s conditional downside target is 1.32181 after a confirmed support breakdown, bearish retest rejection and a break of the rejection candle’s low.

      1. A daily candle closes below 1.33055, breaking the support zone.
      2. Price retests 1.33055–1.33240 from below.
      3. A bearish rejection candle closes back below 1.33055.
      4. Price breaks the rejection candle’s low, providing downward follow-through.


      An upper wick alone would leave the setup incomplete. Use candlestick confirmation at key levels to assess the rejection alongside the broader structure.

      Downside target: 1.32180.

      This objective is based on the next identified support area. A sustained recovery above 1.33240 after the breakdown would weaken the immediate bearish setup, especially if the zone holds as support again.


      Bullish Scenario: Reclaiming 1.34590 Could Open a Move Toward 1.35455

      Post illustration

      Daily Timeframe Price Action Analysis: GBPUSD bullish confirmation requires a daily close above 1.34590 and a successful retest of 1.34080–1.34590 as support.

      The bullish alternative requires price to overcome weekly resistance at 1.34080–1.34590. A bounce from daily support alone would not confirm this breakout scenario.


      Bullish confirmation checklist:

      Post illustration

      Daily Timeframe Price Action Analysis: GBPUSD’s conditional upside target is 1.35455 after a confirmed resistance breakout, successful retest and a break of the bullish rejection candle’s high.

      1. A daily candle closes above 1.34590, clearing the resistance zone.
      2. Price retests 1.34080–1.34590 from above.
      3. A bullish rejection candle closes back above 1.34590.
      4. Price breaks the rejection candle’s high, providing upward follow-through.

      This break-and-retest pattern helps assess whether former resistance is becoming support.

      Upside target: 1.35455.

      A daily close back below 1.34080 would undermine the breakout. A weekly close above the resistance zone would add higher-timeframe evidence, though a broader weekly trend reversal would still depend on subsequent structure.

      Waiting for the retest can help assess a potential false breakout, but cannot eliminate that risk.

      GBPUSD Outlook: What to Watch Next

      1.33055–1.33240 is the immediate confirmation zone for sellers. A break below it, failed retest and bearish follow-through would support a potential move toward 1.32181.

      While daily support holds, the daily bullish structure remains relevant. Buyers would need a confirmed break and successful retest above 1.34590 to activate the alternative scenario toward 1.35455.

      _____________________________________________________________________________________

      Start Your Live Trading Journey

      Move from learning price action to applying it in the real market.

      Trade:

      1. Forex
      2. Gold
      3. Indices
      4. Crypto
      5. Commodities

      Access trading platforms and tools including ACY, MT4, MT5, and Copy Trading.

      Create an Account and Start Live Trading

      _____________________________________________________________________________________

      Beginner’s Path

      Build your trading foundation with these step-by-step guides:

      1. Beginner Trading Steps: 4 Rules to Follow Before You Trade
      2. Beginner Trading Steps: Mistakes That Can Slow Down Your Progress—and How to Avoid Them
      3. The 1% Risk Rule: Common Trading Mistakes to Avoid
      4. Habits of Successful Traders: 4 Ways to Build Discipline in Trading
      5. Beginner Trading Guide: A Step-by-Step Roadmap to Smarter Trading
      6. A Beginner’s Guide to Technical Trading Systems for Gold, Forex, Crypto, Commodities and Indices
      7. Trading Performance: 6 Skills Every Consistent Trader Must Master
      8. Trading Preparation Checklist: 7 Steps Before You Trade

      Mastering Price Action Trading

      Learn to read price action and assess trading setups at key levels:

      1. Why Price Action Trading Works: A Simple Framework for Any Market
      2. Mastering Price Action at Key Levels: How to Identify and Trade High-Probability Setups
      3. Nasdaq 100 Price Action Forecast Recap: NAS100 Falls After Support Break

      Identifying Market Trends and Structure

      Learn to recognize bullish, bearish and sideways markets:

      1. How to Master Market Trends with a Price Action Strategy
      2. Understanding Market Structure: The Structure of a Market Trend
      3. How to Trade Market Structure with Support and Resistance: A Step-by-Step Guide

      Identifying Support and Resistance

      Learn to mark key levels and interpret price reactions:

      1. How to Identify Support and Resistance Levels
      2. Combining Market Structure with Support and Resistance
      3. XAUUSD Support and Resistance: How to Mark Key Gold Levels

      Mastering Break and Retest Patterns

      Understand recurring price patterns, retests and false breakouts:

      1. Break and Retest: A Simple, Repetitive Price Action Pattern
      2. Break and Retest: How to Trade Repetitive Market Patterns
      3. EUR/JPY Price Action Case Study: Retesting a Reversal Pattern
      4. False Breakouts: How to Avoid Breakout Traps and Trade Smarter

      Candlestick Confirmation and Patterns

      Learn to combine candlestick signals with price action analysis:

      1. Top Japanese Candlestick Patterns: Combining Candlestick Confirmation with Price Action
      2. How to Use the Engulfing Candlestick as an Entry Signal
      3. Bullish and Bearish Pin Bars: A Guide to Reversal Candlestick Confirmations

      Trading Trend Reversal Patterns

      Learn to recognize patterns that may signal a change in market direction:

      1. Reversal Chart Patterns: A Complete Guide to Bullish and Bearish Trend Reversals

      Mastering the 50 EMA

      Explore how to combine the exponential moving average with price action:

      1. How to Trade Using the EMA Indicator with Price Action Analysis

      Swing Trading 101

      Bring your technical analysis skills together through a gold swing trading guide:

      1. How to Swing Trade Gold (XAU/USD) with Technical Price Action Analysis: Step by Step

      How to Start Trading Gold

      1. How to Swing Trade Gold (XAU/USD) with Technical Price Action Analysis: Step by Step
      2. XAUUSD Support and Resistance: How to Mark Key Gold Levels
      3. XAUUSD Support and Resistance: How to Mark Gold Levels on the Weekly Chart?
      4. XAUUSD Support and Resistance: Gold Levels Explained for Beginners
      5. XAUUSD Supply and Demand Zones: Gold Trading Price Action Strategy
      6. Gold Market Structure: How to Identify XAUUSD Trends
      7. Best Time to Trade Gold (XAU/USD): A Beginner’s Guide to Trading Sessions

      Risk Management and Position Sizing

      Learn how risk management and position sizing fit into your trading plan:

      1. Risk Management in Trading: The 20% That Determines Long-Term Trading Success
      2. Master Position Sizing in Trading: 5 Rules to Protect Your Capital and Grow Your Account Consistently
      3. The 1% Risk Rule: Common Trading Mistakes to Avoid

      Take-Profit Targets

      Learn how to plan take-profit targets using market structure and risk-reward:

      1. What Is a Target Price? A Beginner’s Trading Guide
      2. Take-Profit Order (TP): A Beginner’s Guide to Better TP Targets

      Stop-loss Placement Guide

      1. What Is a Stop Loss? A Beginner’s Guide

      Mastering the Trader’s Mindset

      Develop discipline, emotional awareness and a more consistent trading process:

      1. Trading Mindset: Why Trading Exposes Who You Really Are
      2. Consistency in Trading: Why Discipline Beats Intelligence
      3. Overtrading: Why More Trades Do Not Mean More Profits
      4. Trading Wick Outs: How to Handle Fake Outs and Market Losses
      5. Trading Psychology: The Truth About Trading Success
      6. Deliberate Practice in Trading: Why Intentional Practice Beats More Screen Time
      7. Trading Psychology: Why Most Traders Struggle with Consistency—and How to Fix It
      8. The Three Pillars of Profitable Trading: Risk Management, Strategy and Psychology
      9. The Mental Game of Trading: Overcoming Hesitation and Executing with Confidence
      10. Emotional Neutrality in Trading: Building Consistency and Discipline
      11. How to Become an Anti-Fragile Trader: Turn Losses, Drawdowns and Pressure into Strength
      12. Building an Anti-Fragile Trading Mindset: Build Discipline and Manage Risk
      13. Trading Psychology: Build Confidence With a Trading Memory Bank
      14. Trading Psychology: Detach From Outcomes, Control Your Process
      15. Trading Psychology: Build Discipline and Day Trading Consistency
      16. Decision Fatigue in Trading: Causes and Solutions

      Professional Trader’s Mindset Masterclass

      Explore the psychological habits behind a disciplined trading approach:

      1. Trading Psychology: What Sets the Profitable Trader’s Mindset Apart
      2. The Professional Trader’s Mindset: 6 Psychological Traits Every Consistently Profitable Trader Needs

      _____________________________________________________________________________________

      Beginner Trading Roadmap

      Not sure where to begin? Here’s a simple roadmap to guide you:

      1. Common beginner Traders Mistakes → avoid overtrading, revenge trading, and chasing the market.
      2. Master Traders Psychology → build discipline, patience, and emotional control
      3. Mastering Risk Management → learn how to have a sustainable trading.
      4. Master Simple Technical strategies & Indicators → especially price action, key levels, and market structure.
      5. Applying to Real Market → forex, crypto and indices.

      By building step by step; from basics → real trading → mastering the craft, you’ll gain clarity, confidence, and steady progress without ever feeling overwhelmed.

      Illustration

      _____________________________________________________________________________________

      Follow for More Market Analysis

      Follow Ruffy Grant B. Capacio for Gold analysis, Forex trading ideas, price action education, trading psychology, and market insights: LinkedIn

      ACY Securities: Join the Discord Server

      Disclaimer:

      Trading Forex, Gold, CFDs, cryptocurrencies, commodities, indices, and other leveraged financial instruments involves a high degree of risk and may not be suitable for all investors or traders. Market conditions can change rapidly, and leveraged trading can result in losses that occur quickly.

      Before trading, carefully consider your investment objectives, level of experience, and risk tolerance. Only trade with capital you can afford to lose and seek independent financial or professional advice where appropriate.

      All market analysis, price forecasts, technical commentary, trading scenarios, educational materials, and opinions presented in this content are provided solely for general informational and educational purposes. They do not constitute financial advice, investment advice, a recommendation, solicitation, or an offer to buy or sell any financial instrument.

      Past performance and historical price movements are not reliable indicators of future results. Any price levels, targets, scenarios, or market outlooks discussed should be viewed as analysis rather than guarantees of future market performance. November 9, 2026

      ACY Securities is one of Australia's fastest growing multi-asset online trading providers, offering ultra-low-cost trading, rock-solid execution, technologically superior account management and premium market analysis.

      This content may have been written by a third party. LiquidityFinder makes no representation or warranty and assumes no liability as to the accuracy or completeness of the information provided, nor any loss arising from any investment based on a recommendation, forecast or other information supplies by any third-party. This content is information only, and does not constitute financial, investment or other advice on which you can rely.
      Comments
      Most Recent
      Written By
      profile image formember on LiquidityFinder
      Technical Trading Analyst, ACY Securities

      Ruffy Grant Capacio is a Technical Trading Analyst at ACY Securities. He focuses on forex and cryptocurrency markets, combining price action, market structure and risk management.

      Daily Newsletter

      LF Daily News

      Daily industry focused newsletter giving you an overview for the financial & finTech industry.

      See All Newsletters
      By clicking "Sign Up" you are agreeing to our Terms of Service and Privacy Policy
      RSS Feeds

      Create a custom RSS Feed

      Select the categories and companies you wish to follow directly to your person rss feed.

      Create Custom RSS Feed

      Related Categories:

      Related Tags:

      #TradingPlatform#MarketNews#ProviderNews#FinTech

      Related Articles:

      Find The Right Partners for
      Your Trading Business

      Sign up and join over 5,000 professional members who receive personalized news alerts, curated professional connections, and more for free!

      Create Your FREE Account
      Get access to latest news, updates, real-time data, brokerage and trading firm insights and customized information feeds.

      Learn what a target price is, how to set a simple profit target, and how to compare potential profit with risk before entering a trade.

      just now

      Learn how decision fatigue in trading affects trading psychology, risk management, and discipline, plus practical ways to prevent overtrading and emotional mistakes.

      just now

      GBPUSD faces weekly resistance at 1.34080–1.34590. A confirmed break below daily support could bring 1.32181 into focus. See both scenarios.

      just now

      NAS 100 stays bearish as traders watch resistance at 26,715–27,185. Explore the confirmation signals for a potential decline toward 26,000.

      just now

      Barclays has opened a new office in Riyadh's King Abdullah Financial District after receiving its CMA operational licence, and appointed former State Street Saudi Arabia CEO Majed Al Hassoun as Chief Executive Officer and Head of Investment Banking, Barclays Capital Saudi, alongside several senior hires in the Kingdom.

      just now

      Crédit Agricole has proposed merging Banco BPM with Crédit Agricole Italia to create Italy's third-largest bank, offering Banco BPM shareholders a 20% premium and a €1bn extraordinary dividend, with Crédit Agricole's stake rising to about 45% and completion targeted for the second half of 2027, subject to approvals.

      just now

      Kudo has appointed Felice Digennaro as Head of Prop at Kudo Funded. He joins from FunderPro, where he was Head of Affiliates, and will lead the prop business as Kudo pursues diversification and growth plans. Finley Wilkinson, Chief Operating Officer at Kudo, and Digennaro commented on the appointment.

      just now

      Explore gold trading sessions, the London–New York overlap and time zone considerations to understand when to watch XAU/USD.

      just now

      Learn what a stop loss is, how it works, and how to set one. Explore examples, stop-limit comparisons, trailing stops, benefits, and risks.

      just now

      AUDCAD reached the 0.97900 bearish target after rejecting 0.98500–0.98750 resistance. Review the weekly structure, daily 50 EMA and retest setup.


      just now
      Feed