just now

Liquidity Finder Ltd is incorporated in England and Wales, company number 10610740, registered address 167-169 Great Portland Street, Fifth Floor, London W1W 5PF, United Kingdom.
Published: just now


Key Takeaways:
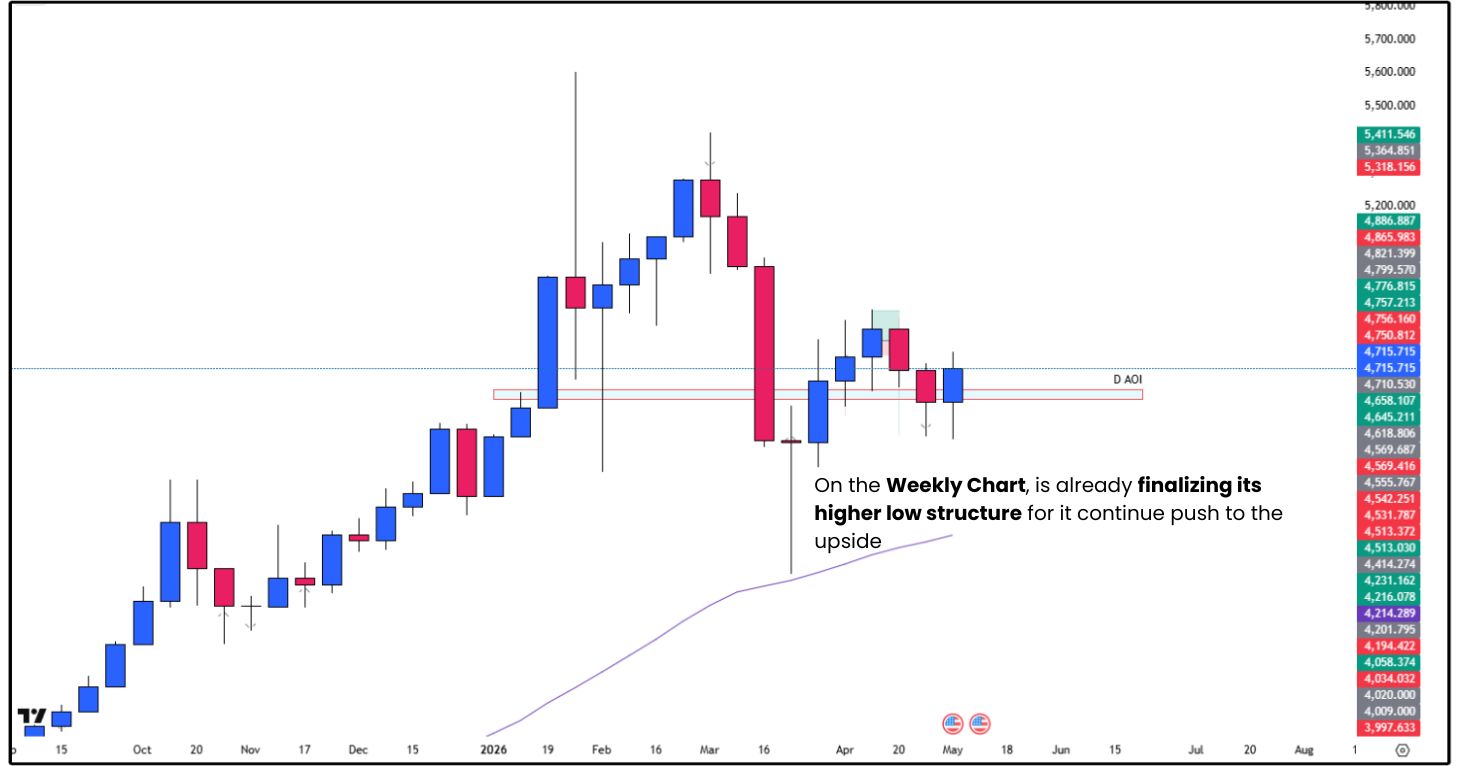
The weekly chart on Gold (XAU/USD), it continues to show a strong bullish structure, with price potentially forming a final higher low before another push to the upside.
Here is what I notice on the weekly timeframe:
How Does the daily chart on Gold shift in momentum?
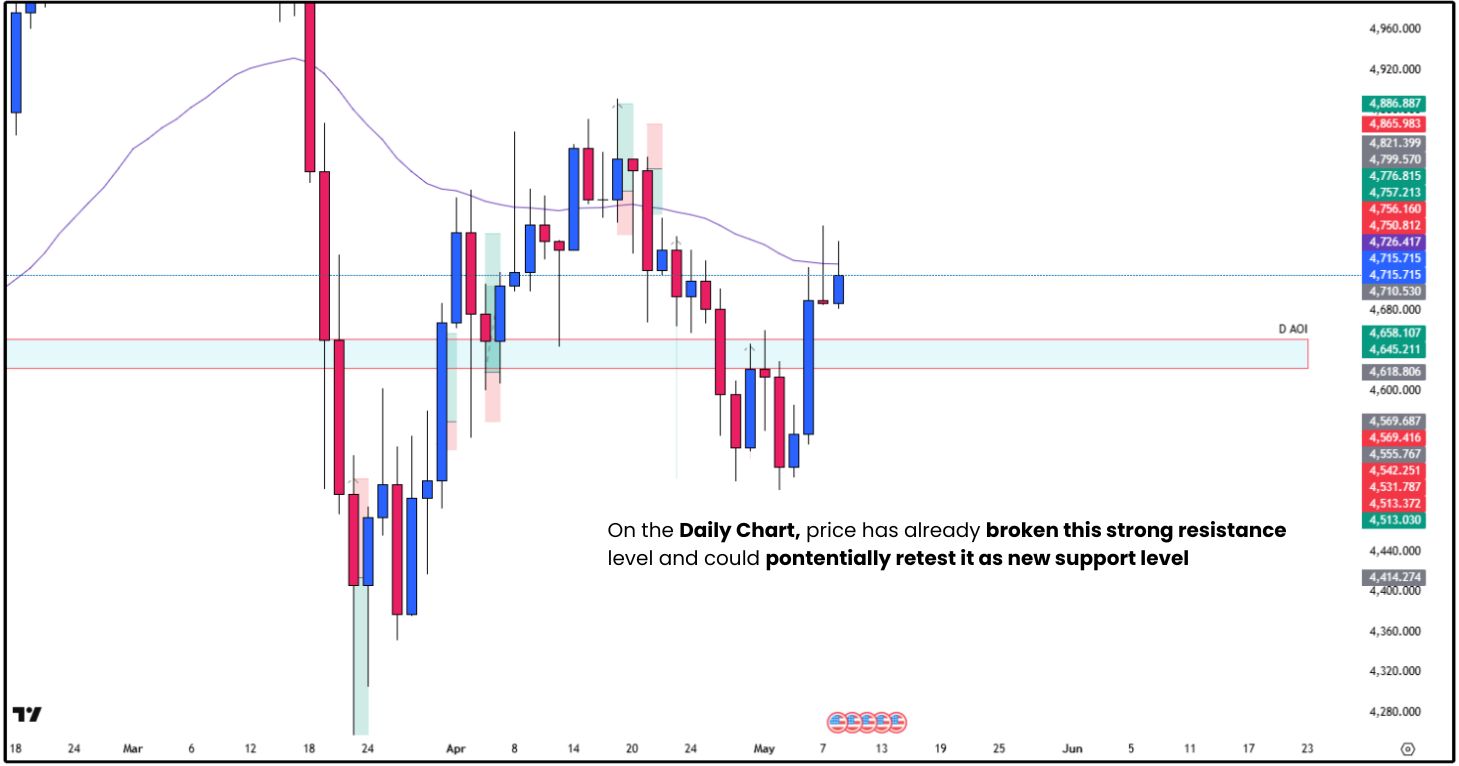
On the daily chart, momentum remains bullish as price breaks above a key resistance zone. A potential retest of this area as new support, combined with the double bottom reversal pattern, adds stronger confirmation for a possible move higher.
Here is what I notice on the daily timeframe:
The classic break and retest pattern simplifies trading setups by focusing on a simple and repetitive market behavior. In USD/CAD price action, a breakout above resistance followed by a retest as support often provides a higher-probability continuation setup for beginners and experienced traders alike.
Why is the break and retest strategy so effective?
Because this method offers a high-probability continuation setup for Gold price action, and also simplifying the overall price action movement making it simplier and repititive to read. All you had to is just to wait for the market to prove its direction before risking your capital.
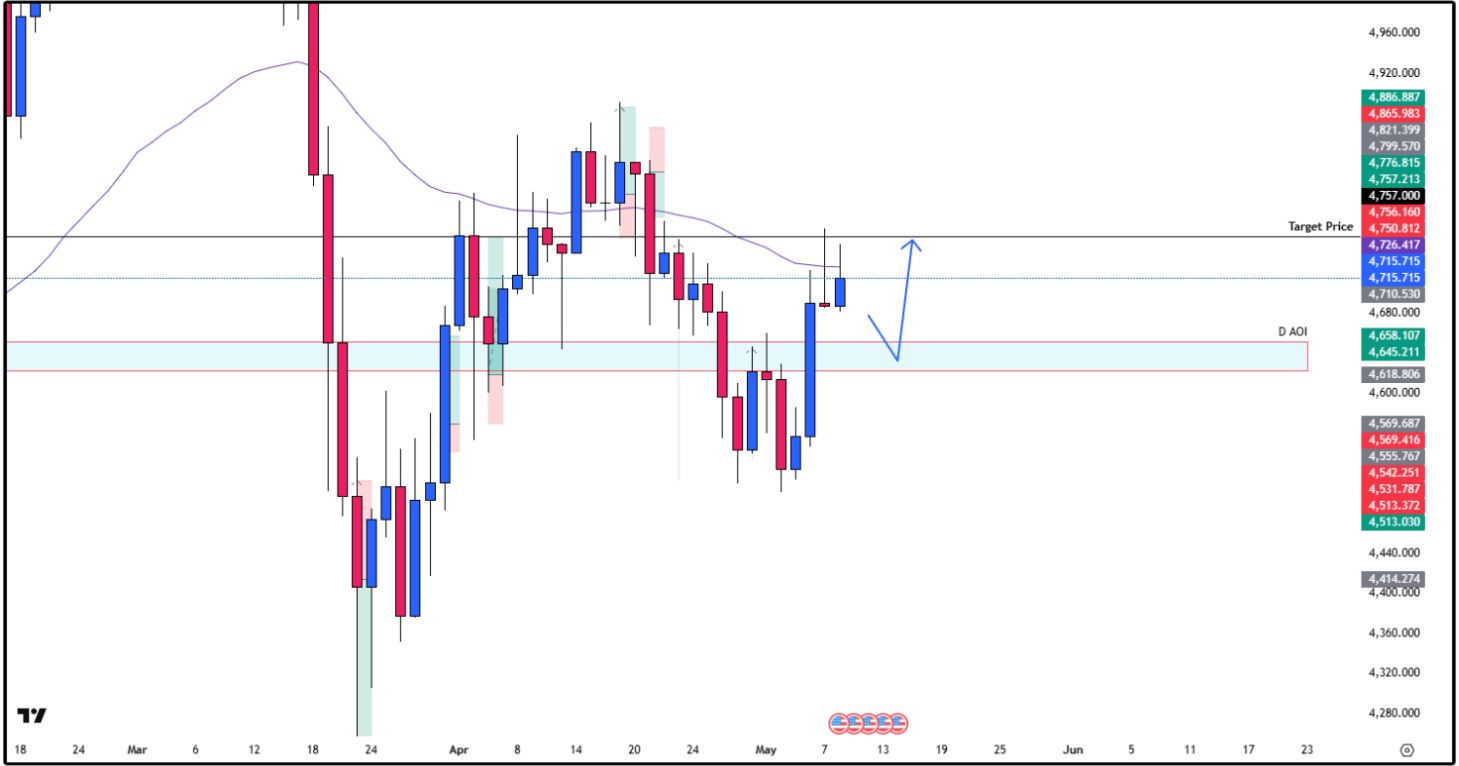
Gold could potentially rally to the upside if:
Note: This trade is considered a higher-probability setup since it aligns with the overall trend.
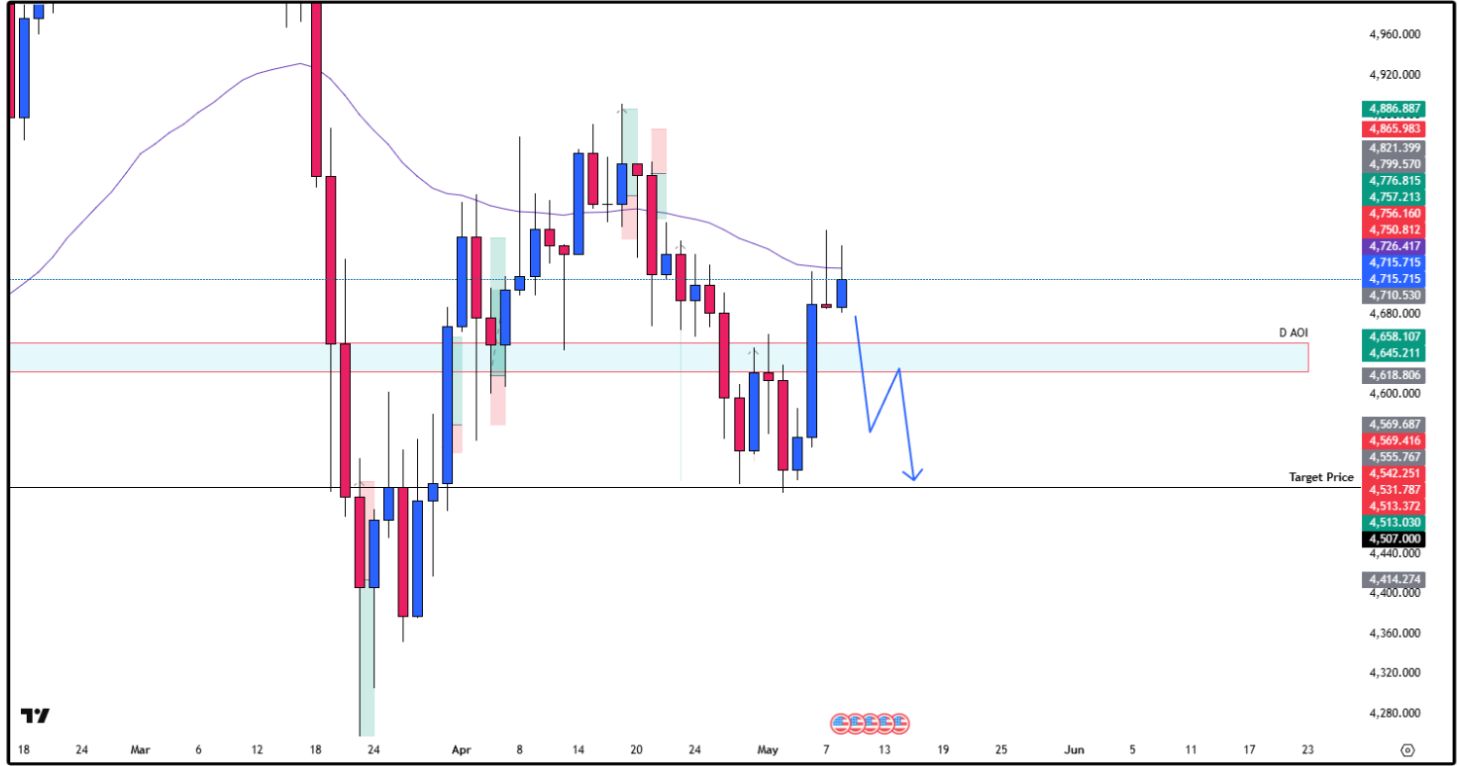
Gold could potentially move to the downside if:
Note: High-risk trade is less favorable, could get you a low probability trade and tighter risk reward ratio.

If you’re watching gold, the charts are showing a clear story. XAU/USD is still leaning bullish, with buyers slowly taking control on both the weekly and daily timeframes.
For new traders, the key is not to overthink.
Focus on simple price action support, resistance, and break-and-retest setups. The market moves in patterns and constantly repeating, and your job is to wait for confirmation.
Stay patient, stay disciplined, and let the charts do the talking.
Discord Server - ACY Securities Server
Start your live trading journey today!
• Trade Forex, indices, gold, crypto and other global markets
• Access powerful platforms including ACY, MT4, MT5, and Copy Trading tools
Move from learning simple price action to executing it in the real market with confidence!
Create an Account. Start Your Live Trading Now!
Ready to learn simple price action strategy? Here’s how to do it step by step:
Gold is still one of the most traded assets, here’s how to trade it with confidence:
Your mindset is what separates steady growth from costly mistakes. Focus on these essentials:
Not sure where to begin? Here’s a simple roadmap to guide you:
By building step by step; from basics → real trading → mastering the craft, you’ll gain clarity, confidence, and steady progress without ever feeling overwhelmed.
Follow me for more daily market insights!
Ruffy Grant B. Capacio - LinkedIn
Disclaimer:
Trading forex and derivative instruments involves substantial risk and may not be suitable for all individuals. Only use funds that you are prepared to lose. It is important to understand how these markets work and the risks involved before trading, and to seek independent financial advice if needed. All market analysis and insights shared are intended for educational and informational purposes only and should not be considered financial or investment advice. May 11, 2026
ACY Securities is one of Australia's fastest growing multi-asset online trading providers, offering ultra-low-cost trading, rock-solid execution, technologically superior account management and premium market analysis.
Select the categories and companies you wish to follow directly to your person rss feed.
Create Custom RSS FeedSign up and join over 5,000 professional members who receive personalized news alerts, curated professional connections, and more for free!
Gold Price Action Forecast: Will XAU/USD Drop to $3930? Meta Description: Read our Gold price action forecast to see if XAU/USD will drop to $3930.
BitDelta Securities Financial Services LLC (“BitDelta Securities”) today announced that it has received full regulatory approval from the Capital Market Authority (“CMA”) of the United Arab Emirates under the Category 5 — Arrangement and Advice license framework (License No. 20200000439). The approval follows the firm's receipt of In-Principal Approval earlier this year and represents the successful conclusion of the CMA's full licensing process, including the satisfaction of capital requirements, governance appointments, and operational setup.
Crypto.com has received a $400 million strategic investment from Citadel Securities, valuing the firm at $20 billion. It marks the first institutional funding round in the company's history, aimed at accelerating its expansion into tokenised securities, derivatives and other asset classes.
WTI’s pullback into $79–82 is the first major test of the bullish Elliott Wave count, with buyers targeting a renewed break above $85.

BitDelta Securities has secured a full CMA Category 5 licence in the UAE and opened a regulated office in Business Bay, Dubai. The firm operates as an introducing broker, connecting investors with licensed international brokers across multiple asset classes, with CEO Dr. Demetrios Zamboglou commenting on the milestone.
Index volatility is asleep while single stocks fight it out underneath, credit refuses to confirm the equity rally, and a bare macro calendar hands next week to oil.
Digital assets and FX brokerage GC Exchange FZE (GCEX) has appointed Mohammed A. Mulla as a Board Member of its Dubai-based entity, part of the wider GCEX Group.
Learn what Blockchain-as-a-Service is, how it works, and why businesses are using BaaS to build blockchain applications without managing infrastructure.
CFDs vs stocks compared on leverage, ownership, costs, dividends, taxes, and risk. Learn the differences between stocks and CFDs and discover which suits your investing or trading goals.
Want to master the markets? A winning trading mindset beats a perfect strategy. Learn how emotional discipline helps you conquer fear and avoid heavy losses.