just now
Liquidity Finder Ltd is incorporated in England and Wales, company number 10610740, registered address 167-169 Great Portland Street, Fifth Floor, London W1W 5PF, United Kingdom.
Published: just now

By the time traders reach this stage in their learning, most have already experienced frustration with indicators - especially MACD.
They’ve seen moments where:
The problem is not MACD.
The problem is asking MACD to do the job of price.
This part of the series is where MACD stops being a signal generator and becomes what it was always meant to be:
a confirmation tool that works alongside price action and market structure.
Professionals do not trade indicators.
They trade context, structure, and momentum alignment.
Price action and market structure answer one critical question:
Where is the market trying to go?
MACD answers a different question:
How strong is the current movement?
Retail traders often reverse this order. They let MACD:
This creates late entries, emotional exits, and constant second-guessing.
Professional execution follows a strict hierarchy:
If MACD disagrees with structure, structure wins - every time.
Before looking at MACD, traders must first read structure.
Ask these questions:
In this environment:
Here:
In these conditions, MACD signals lose reliability.
This is where most traders overtrade - and where professionals stay patient.
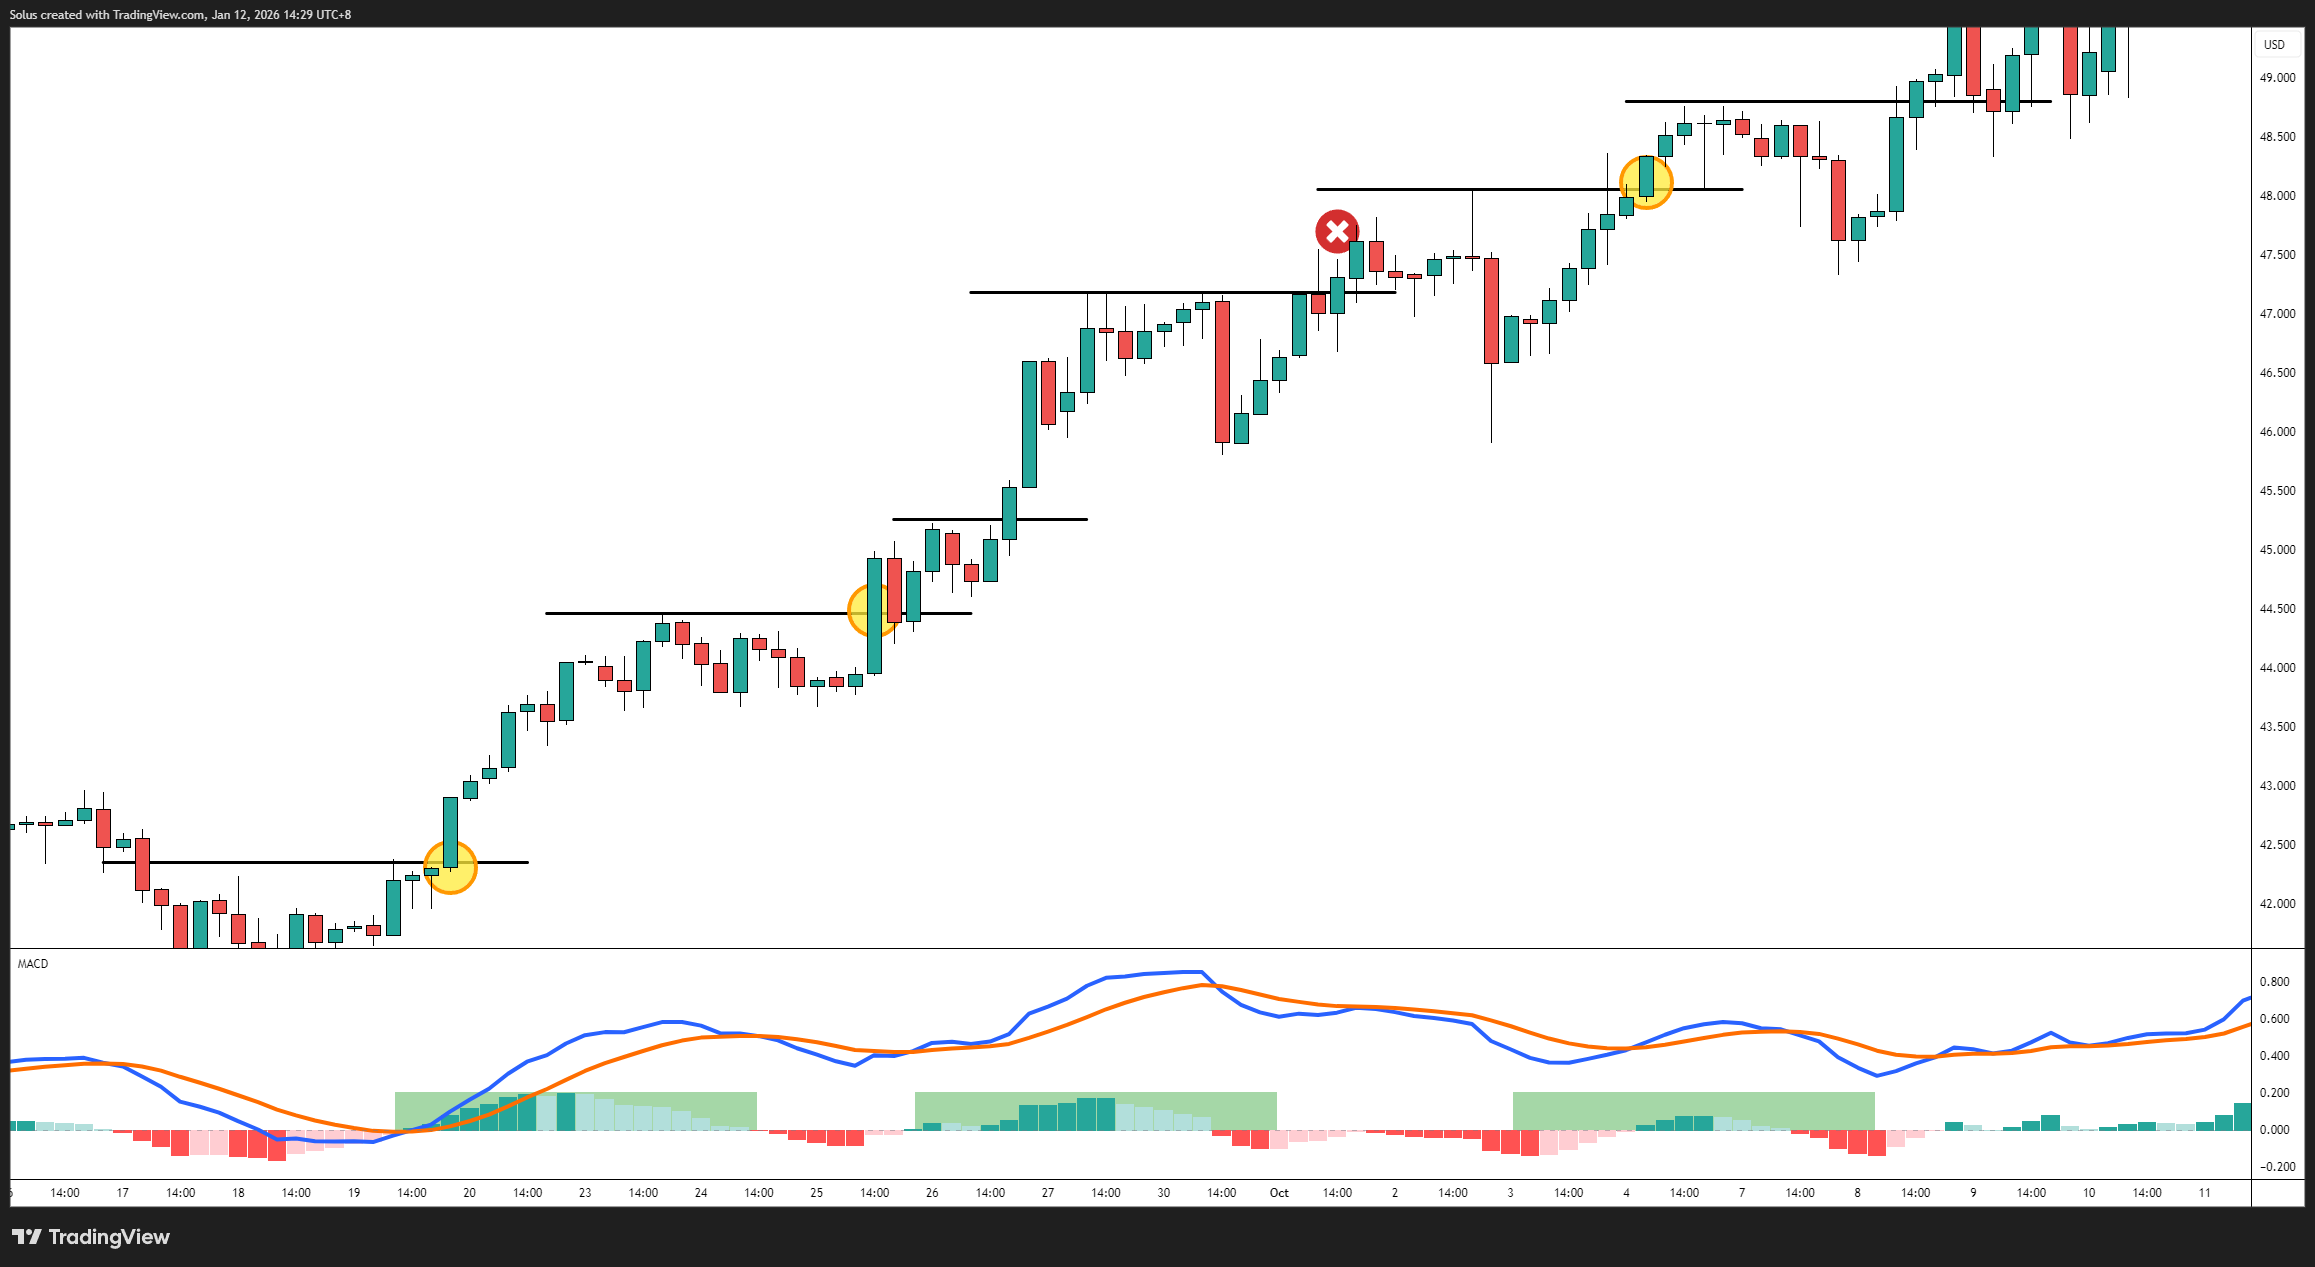
Breakouts are one of the most misread market events.
Price breaking a level does not automatically mean continuation.
What matters is momentum behavior during the break.
This signals acceptance beyond the level.
These often result in false breaks and stop hunts.
MACD doesn’t predict breakouts - it confirms whether they are being supported by real momentum.
One of MACD’s most underrated uses is trend continuation filtering.
In healthy trends:
What professionals look for:
This helps traders:
Strong trends rarely reverse with strong momentum still intact.
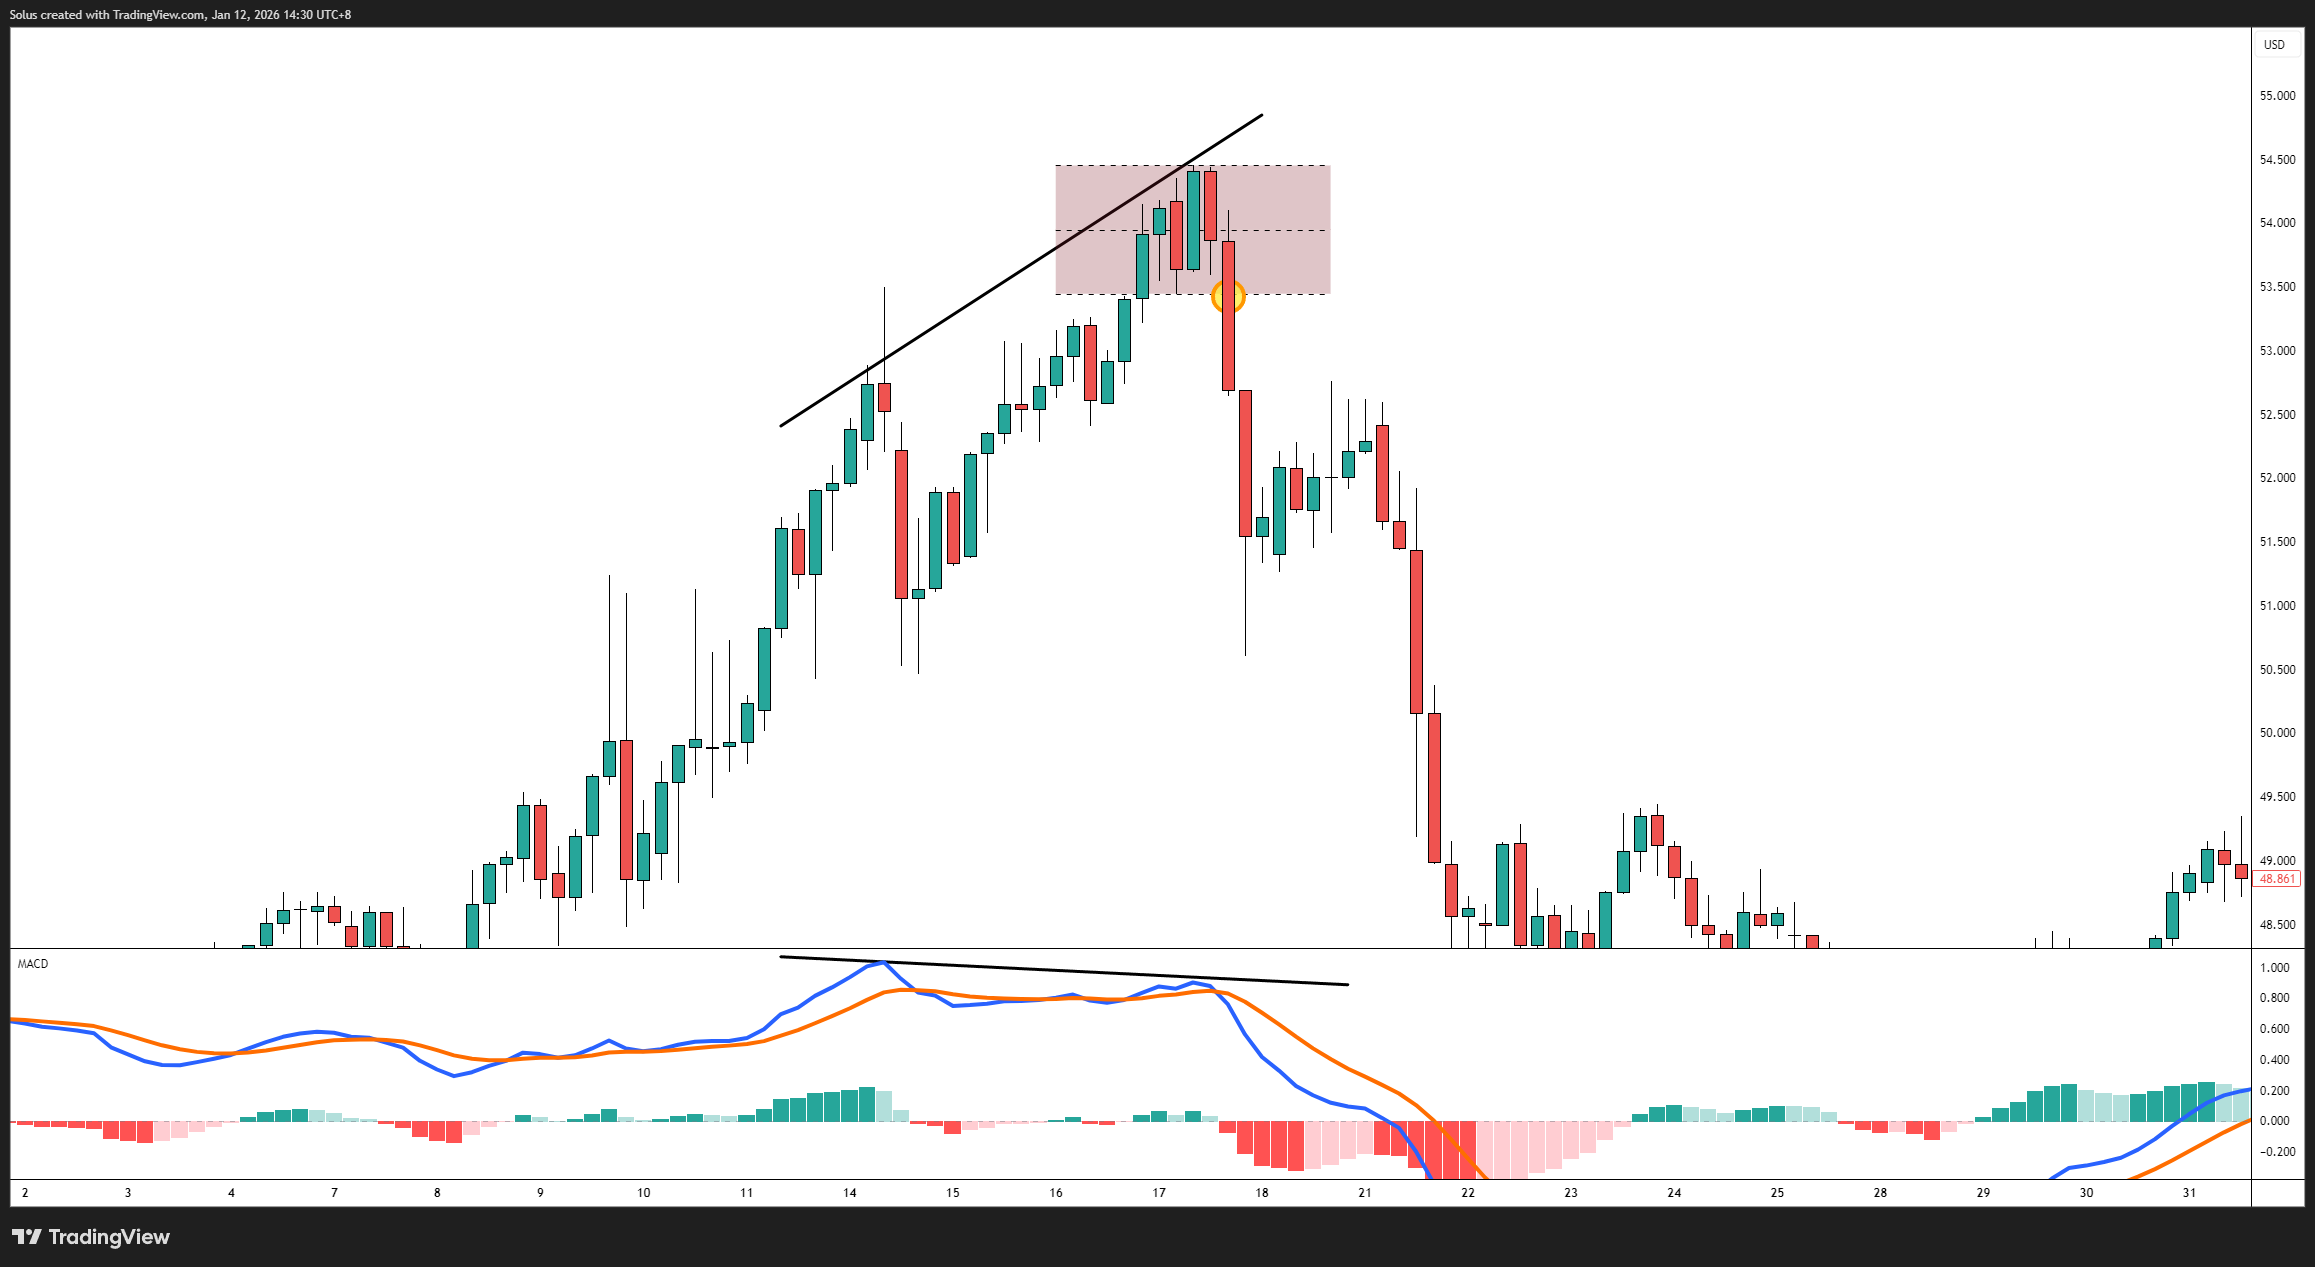
A critical rule:
MACD does not override broken structure.
Common mistakes:
Once structure is invalidated:
Indicators lag.
Structure changes first.
Professionals exit based on price invalidation, not indicator hesitation.
When used correctly, MACD provides:
When used incorrectly, it becomes:
The difference is not the indicator -
it’s the trader’s framework.
Think of trading like navigation:
You don’t choose a destination based on weather.
You use weather to decide how aggressively or cautiously to travel.
When traders let MACD lead, they’re driving blind.
MACD becomes truly effective only when traders stop treating it as a signal and start treating it as confirmation.
Price tells you where.
Structure tells you why.
MACD tells you how strong.
When all three align, trades feel calmer, clearer, and more controlled.
When they don’t, discipline means standing aside - not forcing execution.
The goal is not more trades.
The goal is better alignment.
It’s time to go from theory to execution!
Create an Account. Start Your Live Trading Now!
Looking for step-by-step approaches you can plug straight into the charts? Start here:
Sharpen your edge with proven tools and frameworks:
News moves markets fast. Learn how to keep pace with SMC-based playbooks:
From NASDAQ opens to DAX trends, here’s how to approach indices like a pro:
Gold remains one of the most traded assets - here’s how to approach it with confidence:
Candlesticks are the building blocks of price action. Master the most powerful ones:
Ready to go intraday? Here’s how to build consistency step by step:
Markets swing between calm and chaos. Learn to read risk-on vs risk-off like a pro:
Step inside the playbook of institutional traders with SMC concepts explained:
Forex pairs aren’t created equal - some are stable, some are volatile, others tied to commodities or sessions.
If you’ve ever been stopped out right before the market reverses - this is why:
Mindset is the deciding factor between growth and blowups. Explore these essentials:
The real edge in trading isn’t strategy - it’s how you protect your capital:
If you’re not sure where to start, follow this roadmap:
This way, you’ll grow from foundation → application → mastery, instead of jumping around randomly.
Follow me for more daily market insights!
Jasper Osita - LinkedIn - FXStreet - YouTube
This content may have been written by a third party. ACY makes no representation or warranty and assumes no liability as to the accuracy or completeness of the information provided, nor any loss arising from any investment based on a recommendation, forecast or other information supplies by any third-party. This content is information only, and does not constitute financial, investment or other advice on which you can rely.
ACY Securities is one of Australia's fastest growing multi-asset online trading providers, offering ultra-low-cost trading, rock-solid execution, technologically superior account management and premium market analysis.
Select the categories and companies you wish to follow directly to your person rss feed.
Create Custom RSS FeedSign up and join over 5,000 professional members who receive personalized news alerts, curated professional connections, and more for free!
Sterling steadies after political uncertainty rattled gilt markets, while EUR/USD and EUR/GBP approach key technical levels ahead of today's European session.
GBP/AUD remains trapped in a well-defined bearish trend on both the weekly and daily timeframes.
Discover the key drivers, technical levels, and central bank expectations shaping the EUR/USD trend as the ECB prepares to hold rates and markets watch for a potential breakout.
Sydney-based multi-asset broker ACY Securities has introduced PAXGUSD, a new CFD instrument that allows clients to trade tokenised gold against the US Dollar 24 hours a day, seven days a week. The instrument is available across MetaTrader 4, MetaTrader 5, and the ACY Trading Platform.
Binance has lowered its VIP 3 Wallet Assets threshold from $3 million to $1 million and will now count OTC Spot Trading Volume at a 4x multiplier toward VIP qualification, removing the previous VIP 4 cap and allowing eligible users to progress through the full tier framework up to VIP 9.
Retail futures trading leader NinjaTrader Group has appointed Mark Omens as Senior Vice President, Commercial Strategy, bringing a 25-year veteran of derivatives marketplace CME Group into a newly created role focused on exchange partnerships and enterprise growth.
Gold Price Action Forecast: Will XAU/USD Drop to $3930? Meta Description: Read our Gold price action forecast to see if XAU/USD will drop to $3930.
BitDelta Securities Financial Services LLC (“BitDelta Securities”) today announced that it has received full regulatory approval from the Capital Market Authority (“CMA”) of the United Arab Emirates under the Category 5 — Arrangement and Advice license framework (License No. 20200000439). The approval follows the firm's receipt of In-Principal Approval earlier this year and represents the successful conclusion of the CMA's full licensing process, including the satisfaction of capital requirements, governance appointments, and operational setup.
Crypto.com has received a $400 million strategic investment from Citadel Securities, valuing the firm at $20 billion. It marks the first institutional funding round in the company's history, aimed at accelerating its expansion into tokenised securities, derivatives and other asset classes.
WTI’s pullback into $79–82 is the first major test of the bullish Elliott Wave count, with buyers targeting a renewed break above $85.


