Explore Companies BySectors & Categories
Explore Companies ByUse Cases
Explore Companies ByProducts & Services
Explore Companies ByRankings & Reviews
Featured NewsCompaniesMarketsCryptoTechRegulatoryCommentaryUKUSWorldMore

    Latest Wires

      Daily Newsletter

      LF Daily News

      Daily industry focused newsletter giving you an overview for the financial & finTech industry.

      See All Newsletters
      By clicking "Sign Up" you are agreeing to our Terms of Service and Privacy Policy

      A Guide to Master a Strategy that Works in Any Market: How to Identify Support and Resistance Levels?

      Published: just now

      A Guide to Master a Strategy that Works in Any Market: How to Identify Support and Resistance Levels?

      Post illustration


      Support and resistance levels are more than just lines on a chart; they represent areas where buyers and sellers have repeatedly battled for control.


      By understanding these key price zones through a price action framework, traders can identify where the market is likely to react, spot potential opportunities, and make more informed trading decisions.


      Goal of this lesson


      At the end of this lesson, you will be able to:


      1. Understand what support and resistance levels are
      2. Identify areas where buyers and sellers are likely to react
      3. Read the story behind key price zones
      4. Recognize potential reversal and continuation areas
      5. Make trading decisions based on price action instead of emotions


      Understanding support and resistance


      Support and resistance levels tell the story behind price movements. They are key areas where buyers and sellers have previously reacted and may react again.


      By focusing on these price zones and using pure price action, traders can better understand what the market is actually doing instead of simply guessing.


      To better understand how key support and resistance levels works watch this educational video:


      What defines a support level?


      Post illustration

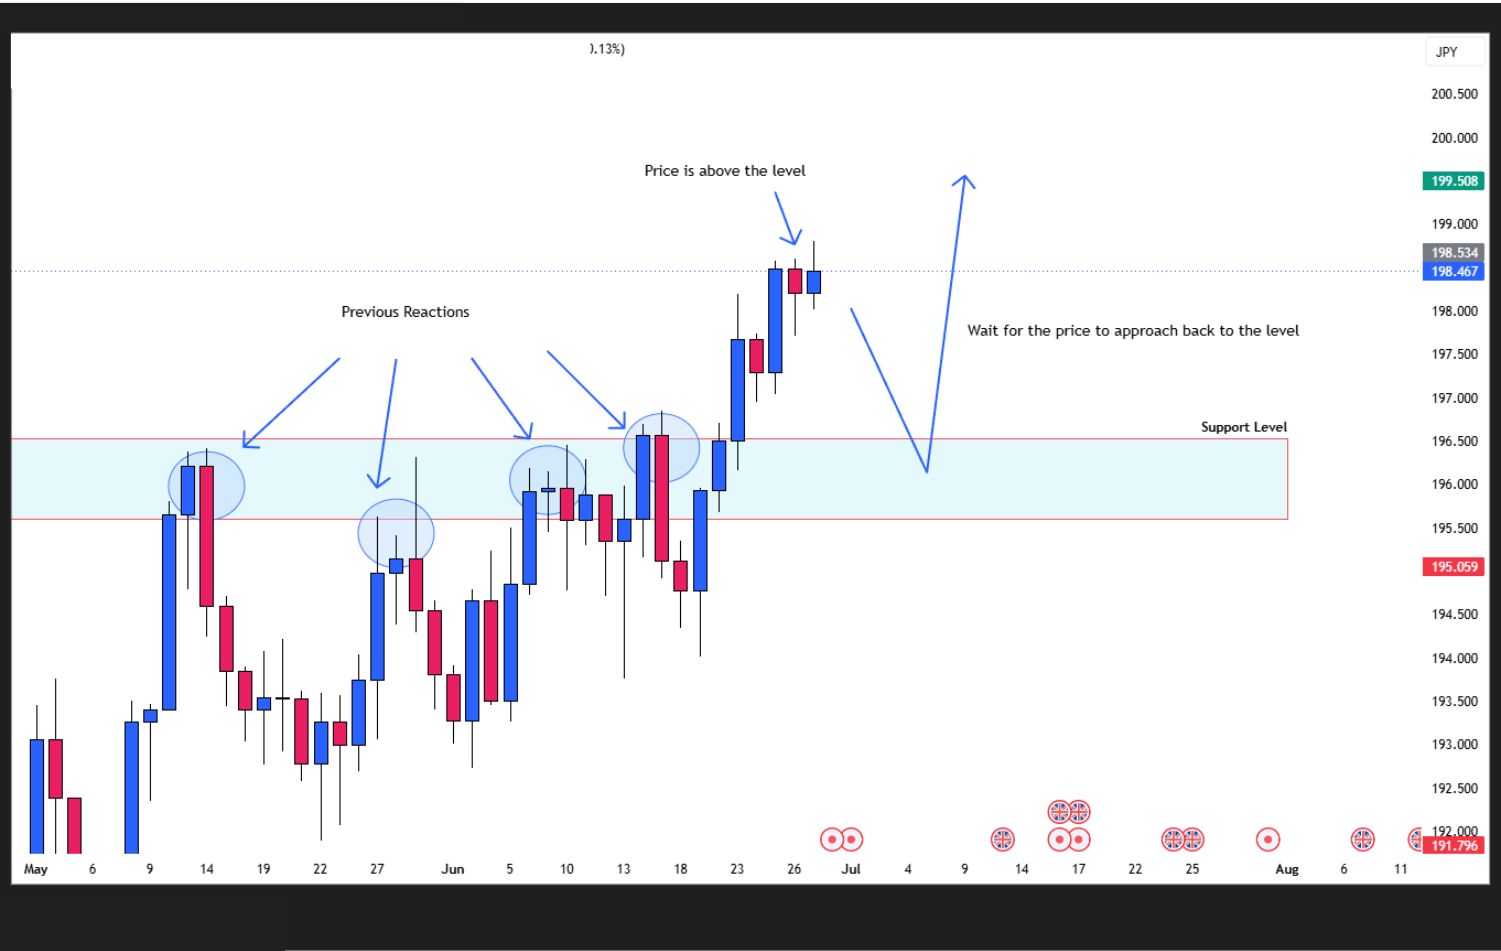
      Daily Chart Simple Price Action Analysis. Price is Above the Support Level


      A support level occurs when price repeatedly finds buyers at a particular area, causing the market to bounce higher.


      Characteristics:

      1. Price is above the key level
      2. Price reacts and moves upward from the level
      3. Buyers show increasing interest
      4. Selling momentum begins to weaken
      5. Potential area for bullish opportunities


      Support + price action analysis

      Post illustration

      Daily Chart Simple Price Action Analysis. Rejection at the Support Level


      Scene Idea: Price pulls back into a support level and forms a bullish rejection candlestick. Buyers defend the level and push the market higher, continuing the upward move.


      (Note: Past performance is not a reliable indicator of future results.)


      If you want to master how to pair support and resistance with candlestick confirmations, checkout these blogs:

      1. The Top Japanese Candlestick Patterns to Trade: Mastering Japanese Candlestick Confirmation + Pairing with Price Action Analysis
      2. The Top Japanese Candlestick Patterns to Trade: How to Use the Engulfing Candlestick as a High-Probability Entry Signal


      What defines a resistance level?


      Post illustration

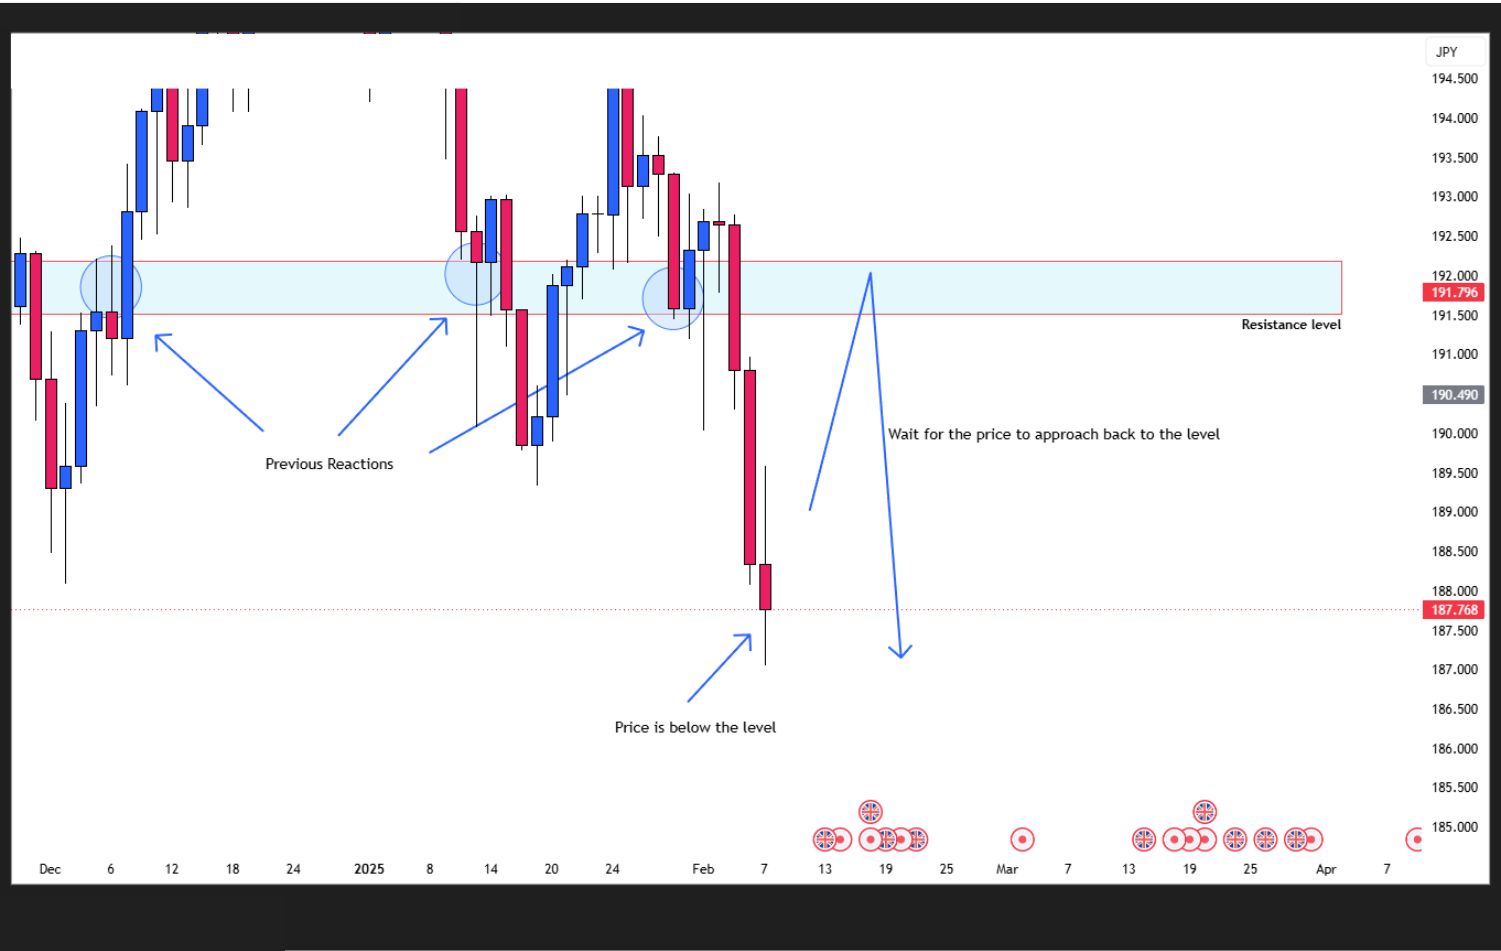
      Daily Chart Simple Price Action Analysis. Price is Below the Resistance Level


      A resistance level occurs when price repeatedly finds sellers at a particular area, causing the market to move lower.


      Characteristics:


      1. Price is below the key level
      2. Price reacts and moves downward from the level
      3. Sellers show increasing interest
      4. Buying momentum begins to weaken
      5. Potential area for bearish opportunities


      Resistance + Price Action analysis


      Post illustration

      Daily Chart Simple Price Action Analysis. Rejection at the Resistance Level


      Scene Idea: Price rallies into a resistance level and forms a bearish rejection candlestick. Sellers defend the level and drive the market lower.


      (Note: Past performance is not a reliable indicator of future results.)


      Real-life analogy


      Post illustration


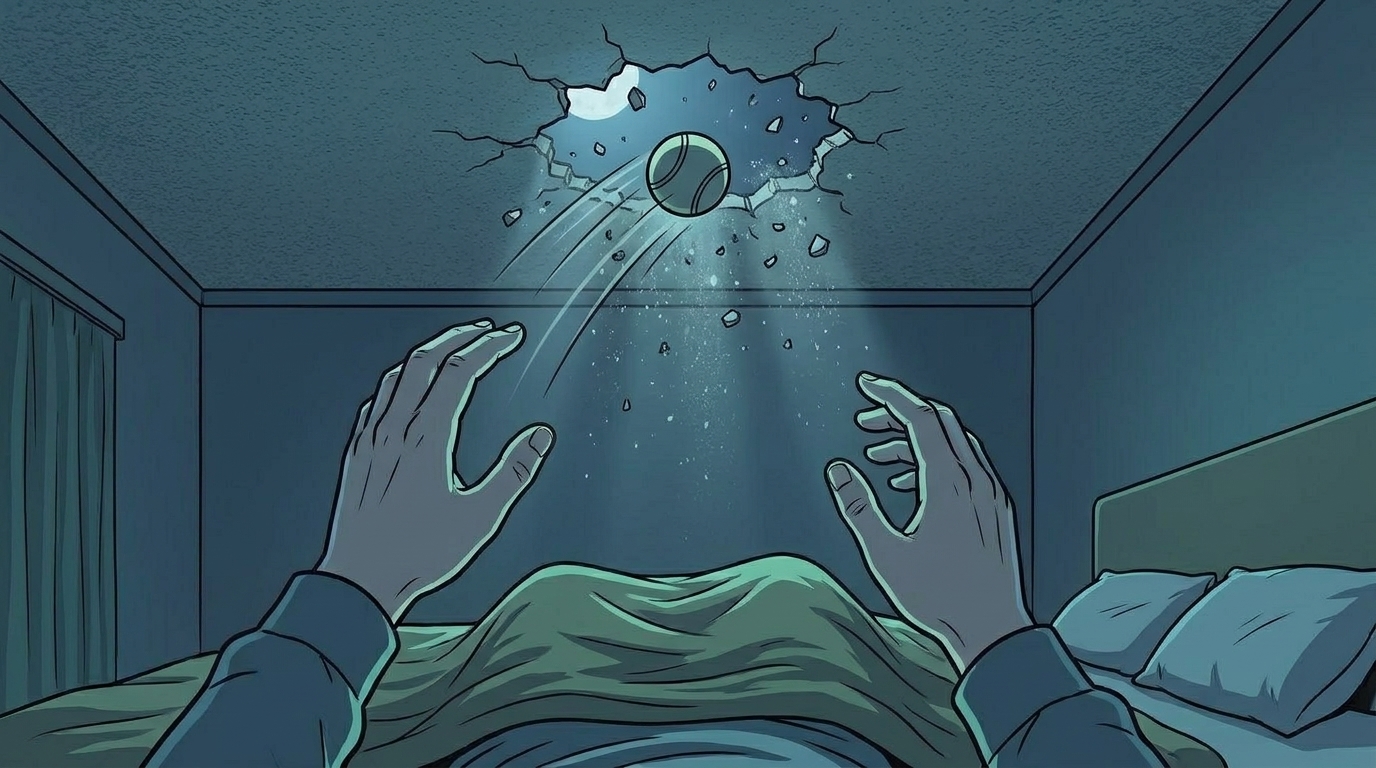
      Support and resistance are like the floors and ceilings inside a building.


      A ball dropped from above will often bounce when it reaches the floor (support).


      If the ball is thrown upward, it may hit the ceiling (resistance) and fall back down.

      Eventually, enough force may break through the floor or ceiling, causing the ball to move to the next level.


      Markets behave in a very similar way. Prices repeatedly react at important areas until buyers or sellers gain enough strength to break through and establish a new price zone.


      Why key levels important in trading?


      Support and resistance levels help traders:


      1. Identify potential reversal areas
      2. Find better trade entries and exits
      3. Manage risk more effectively
      4. Understand where buyers and sellers are active
      5. Avoid emotional and impulsive decisions


      Why support and resistance are not enough?


      Post illustration


      However, support and resistance should not be traded blindly!


      The highest-probability setups occur when these levels are combined with:


      1. Market structure
      2. Candlestick confirmation
      3. Trend analysis
      4. The 50 EMA indicator


      To learn how these concepts work together, check out these blogs:


      1. A Guide to Master Price Action Strategy that Works in Any Market: How to Master the Trend in Trading Any Market
      2. A Guide to Master a Strategy that Works in any Market: The Structure of a Market Trend
      3. The Top Japanese Candlestick Patterns to Trade: Mastering Japanese Candlestick Confirmation + Pairing with Price Action Analysis
      4. The Top Japanese Candlestick Patterns to Trade: How to Use the Engulfing Candlestick as a High-Probability Entry Signal
      5. Master Exponential Moving Average: How to Trade using EMA Indicator with Price Action Analysis?


      Final thoughts


      Post illustration


      The key to mastering price action is learning to identify where buyers and sellers are most active.


      By understanding support and resistance levels, you can read the story behind price movements, recognize important market zones, and make decisions based on what price is showing rather than emotions or predictions.


      The goal isn't to predict exactly where the market will go next, it's to identify the areas that matter most and patiently wait for price action to reveal the next opportunity.


      Now that you already understand on why support and resistance is important in trading then,


      Your next step is:


      1. To know trader’s beginner steps before your trade
      2. Mastering your psychology
      3. Mastering the simple price action strategy
      4. Mastering Repetitive Patterns in Trading
      5. Trading live using this simple price action strategy


      For more in-depth market breakdowns, real-time analysis, and structured learning content, you can join our Discord community inside ACY Server:

      Discord Server - ACY Securities Server


      Start your live trading journey today!


      • Trade Forex, indices, gold, crypto and other global markets

      • Access powerful platforms including ACY, MT4, MT5, and Copy Trading tools

      Move from learning simple price action to executing it in the real market with confidence!


      Create an Account. Start Your Live Trading Now!


      Check out my contents:


      Beginners path:

      1. Beginner Trading Steps: 4 Rules to Follow Before You Trade
      2. The 1% Risk Rule: The Most Common Mistakes That Quietly Destroys 90% of Traders

      Mastering popular forex pairs using simple price action strategy

      Ready to learn simple price action strategy? Here’s how to do it step by step:

      1. USD/JPY Analysis Today: Simple Trades, Clear Moves, for Beginners Using Price Action
      2. Simple Day Trade Price Action On EUR/USD: Why the Drop to 1.14190?
      3. Simple Price Action Analysis on EUR/CAD: EURCAD the Pair for the Week?
      4. Simple Price Action Strategy on USD/ CHF: 0.80000 the Key Ceiling for USD/CHF Sell?
      5. Price Action Analysis for GBPCAD Trade: A Potential Trade for This Week or Next Week?
      6. EUR/GBP Trading Guide: How to Spot High-Probability Setup a Week Ahead Using Simple Price Action Strategy?
      7. Simple Price Action Trade on CAD/JPY: 115.000 the Key Floor for CAD/JPY Buy?
      8. USD/JPY Price Action Outlook: Is 158.500 the Key Floor for a Potential New High?
      9. CAD/JPY Price Action Breakdown: We Anticipated the Move Twice to 116.500, Is Price Action Really the King?
      10. GBP/NZD Trade Ideas Using Simple Price Action Strategy: Will Price Drops to 2.28000?
      11. USD/JPY Technical Forecast: 158.500 Floor Retest for Preparing for New Highs?
      12. GBP/CHF Price Action Ideas: Is 1.05500 the Ceiling for a New Low?
      13. GBP/CAD Simple Forex Price Action Ideas: Is the 1.84500 Support Level Holding?
      14. AUD/USD Simple Price Action Forecast: Why Buy at 0.71700 Support Area?
      15. GBP/NZD Price Action Idea: Is GPB/NZD 2.3000 Key Floor for Bullish Continuation?
      16. GBP/USD Price Action: Trade Setups on a Ranging Market?
      17. USD/CAD Simple Price Action: Is 1.36500 the Key Bullish Floor?
      18. USD/CAD Price Action Ideas: Setting Up for the Next Bullish Push?
      19. EUR/JPY Price Action: Is It Retesting a Reversal Pattern?
      20. NZD/USD Forecast: Potential Consolidation Breakout on NZD/USD?
      21. AUD/JPY Price Action Forecast: Is AUD/JPY Setting Up for a Massive Sell?
      22. NZD/USD Price Action Forecast: Is a Reverse Double Top Pattern Forming?
      23. NZD/USD Price Action Forecast: Is a Reverse Double Top Pattern Forming?
      24. AUD/CHF Forex Price Action Idea: Are Sellers Defending the 0.56504–0.56200 Key Level?

      Master how to identify market trend

      1. A Guide to Master Price Action Strategy that Works in Any Market: How to Master the Trend in Trading Any Market
      2. A Guide to Master a Strategy that Works in any Market: The Structure of a Market Trend

      Master how to use break & retest pattern

      Ready to learn and capitalize the repetitive patterns in the markets? Here’s how to do it step by step:

      1. Break and Retest: A Simple Repetitive Price Action Pattern?
      2. Break and Retest: How to Capitalize Repetitive Patterns in Trading?
      3. EUR/JPY Price Action: Is It Retesting a Reversal Pattern?

      Master how to use candlestick confirmation & patterns

      1. The Top Japanese Candlestick Patterns to Trade: Mastering Japanese Candlestick Confirmation + Pairing with Price Action Analysis
      2. The Top Japanese Candlestick Patterns to Trade: How to Use the Engulfing Candlestick as a High-Probability Entry Signal

      Mastering the 50 EMA

      1. Master Exponential Moving Average: How to Trade using EMA Indicator with Price Action Analysis?

      Learn how to trade Gold

      Gold is still one of the most traded assets, here’s how to trade it with confidence:

      1. XAUUSD Price Action: A Beginner Buy Setup for Next Week
      2. How to Trade Gold Using Simple Price Action Outlook: 4500 the Key Zone for XAUUSD Buys?
      3. The Simplest Way to Trade XAU/USD Using Price Action Analysis: Buy and Sell Anticipation on Gold?
      4. XAU/USD Price Action: Will Gold Rally to $4,900 Today?
      5. Gold (XAU/USD) Price Action Forecast: Will XAU/USD Drop to $4650?
      6. Gold (XAU/USD) Trade Ideas: A Simple Price Action Analysis on Gold This Week?
      7. Gold (XAU/USD) Price Action Idea: A High-Probability Trade Setup on Gold?
      8. Gold XAU/USD Price Action Idea: Is a Bullish Momentum Coming?
      9. Gold (XAU/USD) Price Action Ideas: Will News Trigger a Breakout or Consolidation on Gold?
      10. How to Step-by-Step Swing Trade Gold (XAU/USD) with Pure Technical Price Action Analysis?
      11. Gold XAU/USD Price Action Forecast: Anticipating a Consolidation Breakout on Gold Again?

      Swing trading 101

      1. How to Step-by-Step Swing Trade Gold (XAU/USD) with Pure Technical Price Action Analysis?

      Learn how to trade crypto with price action strategy

      1. Bitcoin BTC/USD Price Action: Could Bitcoin Still Keep Dropping?

      Mastering traders mindset

      Your mindset is what separates steady growth from costly mistakes. Focus on these essentials:

      1. Trading Mindset: Why Trading Exposes Who you Really Are?
      2. Consistency in Trading is Key: Why Discipline Beats Intelligence?
      3. Overtrading: Why More Trades Do Not Mean More Profits?
      4. Trading Wick Outs: How to Handle Fake Outs and Market Losses?
      5. Trading Psychology: The Truth About Trading Success

      Beginner trading roadmap

      Not sure where to begin? Here’s a simple roadmap to guide you:

      1. Common beginner Traders Mistakes → avoid overtrading, revenge trading, and chasing the market.
      2. Master Traders Psychology → build discipline, patience, and emotional control
      3. Mastering Risk Management → learn how to have a sustainable trading.
      4. Master Simple Technical strategies & Indicators → especially price action, key levels, and market structure.
      5. Applying to Real Market → forex, crypto and indices.

      By building step by step; from basicsreal tradingmastering the craft, you’ll gain clarity, confidence, and steady progress without ever feeling overwhelmed.

      Follow me for more daily market and educational insights!

      Ruffy Grant B. Capacio - LinkedIn

      Acy Securities - Discord

      Disclaimer:

      Trading forex and derivative instruments involves substantial risk and may not be suitable for all individuals. Only use funds that you are prepared to lose. It is important to understand how these markets work and the risks involved before trading, and to seek independent financial advice if needed. All market analysis and insights shared are intended for educational and informational purposes only and should not be considered financial or investment advice. June 24, 2026

      ACY Securities is one of Australia's fastest growing multi-asset online trading providers, offering ultra-low-cost trading, rock-solid execution, technologically superior account management and premium market analysis.

      This content may have been written by a third party. LiquidityFinder makes no representation or warranty and assumes no liability as to the accuracy or completeness of the information provided, nor any loss arising from any investment based on a recommendation, forecast or other information supplies by any third-party. This content is information only, and does not constitute financial, investment or other advice on which you can rely.
      Comments
      Most Recent
      Written By
      Daily Newsletter

      LF Daily News

      Daily industry focused newsletter giving you an overview for the financial & finTech industry.

      See All Newsletters
      By clicking "Sign Up" you are agreeing to our Terms of Service and Privacy Policy
      RSS Feeds

      Create a custom RSS Feed

      Select the categories and companies you wish to follow directly to your person rss feed.

      Create Custom RSS Feed

      Related Categories:

      Related Tags:

      #ProviderNews#TradingPlatform#FinTech#MarketNews

      Related Articles:

      Find The Right Partners for
      Your Trading Business

      Sign up and join over 5,000 professional members who receive personalized news alerts, curated professional connections, and more for free!

      Create Your FREE Account
      Get access to latest news, updates, real-time data, brokerage and trading firm insights and customized information feeds.

      iSAM Securities Apex has integrated with CMC Markets, giving brokers access to CMC's institutional liquidity through Apex's ultra-low latency technology stack. The integration expands liquidity choice while helping brokers optimise execution, manage risk and protect P&L.

      just now

      Cboe Global Markets has launched Cboe Predicts℠, a binary options suite based on the Mini-S&P 500 Index (XSP). Contracts are live on Interactive Brokers and cleared through OCC, with Charles Schwab access expected in the coming months.

      just now

      Want to master trading? Support and resistance levels show where buyers and sellers battle. Learn pure price action to find key price zones.

      just now

      Learn how industry group rotation and interest-sensitive stocks guide smart stock selection.

      just now

      Clear Street has executed the first Bitcoin Depositary Receipt trades through a traditional prime brokerage platform, settling via DTC with institutional clients UTXO Management and GTS. RDC served as Depositary, with Bitcoin held at Anchorage Digital Bank N.A.

      just now

      Eurozone PMI ticked up to 49.5 in June, but a third straight sub-50 print with the drag sitting in services hands the ECB cover to stay patient, and EUR/USD was already leaning into its descending channel before the survey crossed.

      just now

      Spotware's cTrader has partnered with global prop trading firm Hola Prime, giving its traders access to the platform's transparency-focused tools, AI-compatible MCP servers, and the cTrader Store marketplace of trading indicators and plugins.

      just now

      BingX reports a 700% surge in daily TradFi Stocks trading volume over five days, with cumulative stock trading exceeding $2.7 billion and index trading surpassing $8 billion over two months, as demand for unified multi-asset trading platforms continues to rise.

      just now

      The Bank of England has published its policy statement and draft Code of Practice for systemic stablecoin issuers, setting out the rules that will govern sterling-denominated stablecoins large enough to matter to the UK financial system.

      just now

      Capital.com has received dual regulatory approval from South Africa's FSCA, authorising the firm as an Over-the-Counter Derivatives Provider and Category 1 FSP. The group will offer CFDs across 5,000+ markets and has appointed Travis Robson as CEO for South Africa.

      just now
      Feed