just now

Liquidity Finder Ltd is incorporated in England and Wales, company number 10610740, registered address 167-169 Great Portland Street, Fifth Floor, London W1W 5PF, United Kingdom.
Published: just now


By the end of this lesson, you will be able to analyze Gold (XAU/USD), identify high-probability swing trading setups, and manage trades using simple price action and risk management principles.

Traders like gold because it moves well, offers trading opportunities, and is often trusted during market uncertainty.
There are four main reasons why Gold is currently dominates the markets:
| Feature | Gold | Forex |
| Primary Drivers | Inflation, interest rates, safe-haven demand, central bank buying | Interest rates, economic data, central bank policies |
| Best For | Traders seeking trend and macro-driven moves | Traders seeking frequent opportunities and currency exposure |
| Market Focus | Fragmented across many exchanges | Concentrated interbank network |
| Safe-Haven Status | Strong safe-haven asset | Depends on the currency (e.g., USD, CHF, JPY) |
| Volatility Profile | Moderate to high, especially during major news events | Largest and most liquid financial market globally |
A pure price action strategy is a simple way to trade Gold by focusing only on price movement on the chart, without relying on indicators. One of the most common setups in this approach is the break and retest pattern, which happens when price breaks a key support or resistance level, then pulls back to retest that same level before continuing in the same direction.
Start by identifying the overall direction of the market on higher timeframes.
Time frame to look at:
Then determine what structure the market is forming:
Checkout my blog on Identifying market trend and market analysis on gold:
Gold Price Action: Is Gold (XAU/USD) Forming a Potential Double Bottom?
This helps you understand where you are in the market cycle and avoid trading blindly.
In simple terms:
Know the trend → identify the structure → understand your position in the market.
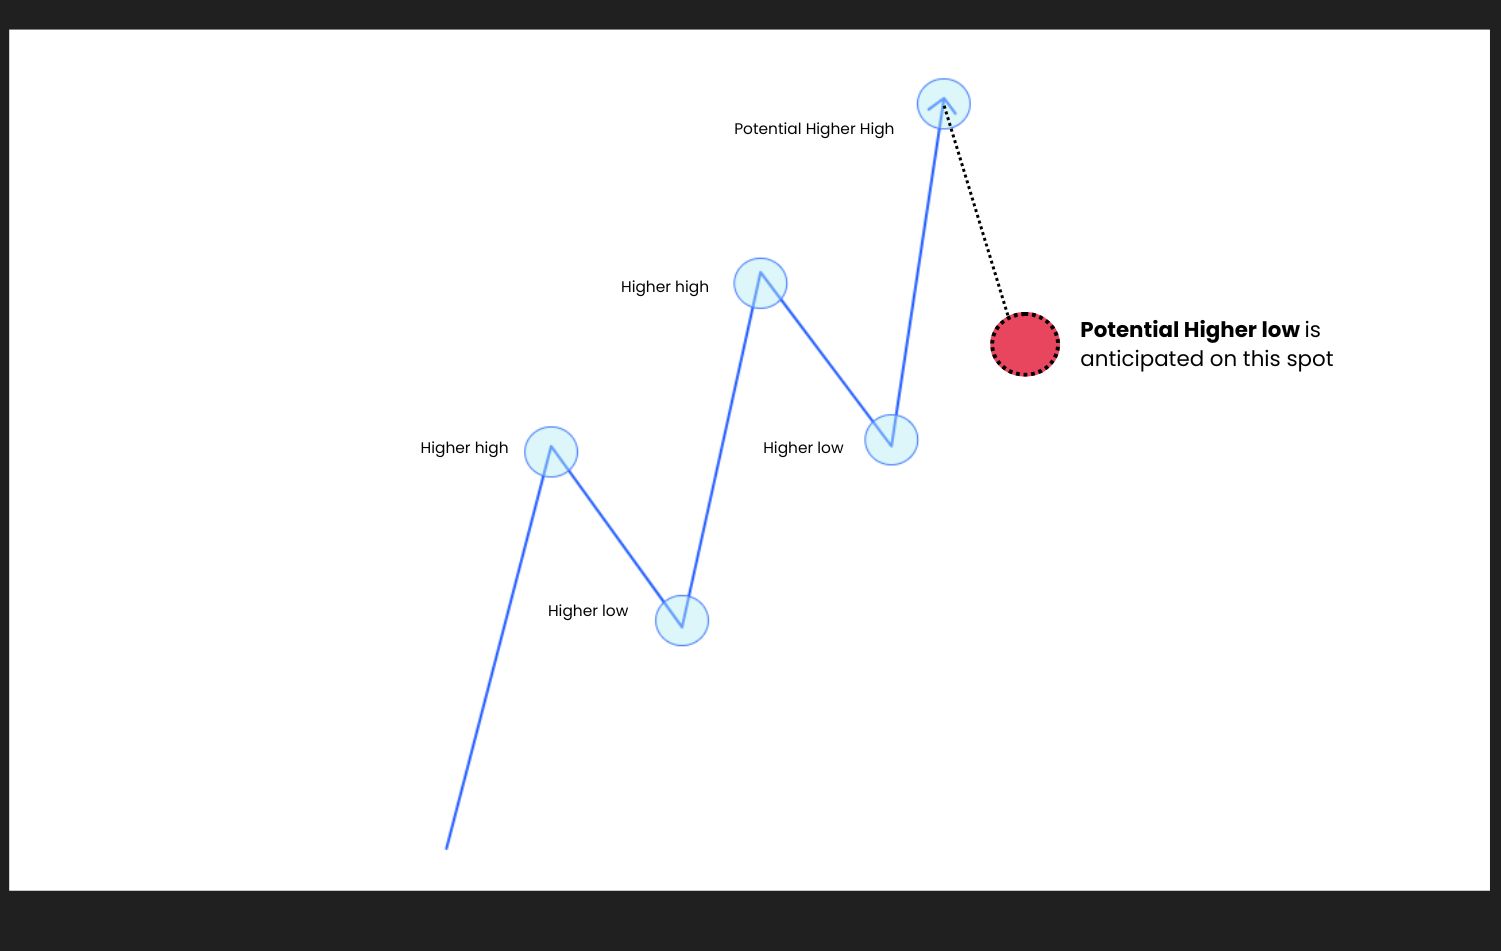
Bullish Market Structure
Bullish market structure consist of higher high and higher low points (elbows). In order for it to continuing bullish momentum push to the upside, it needs to create those higher low structures.
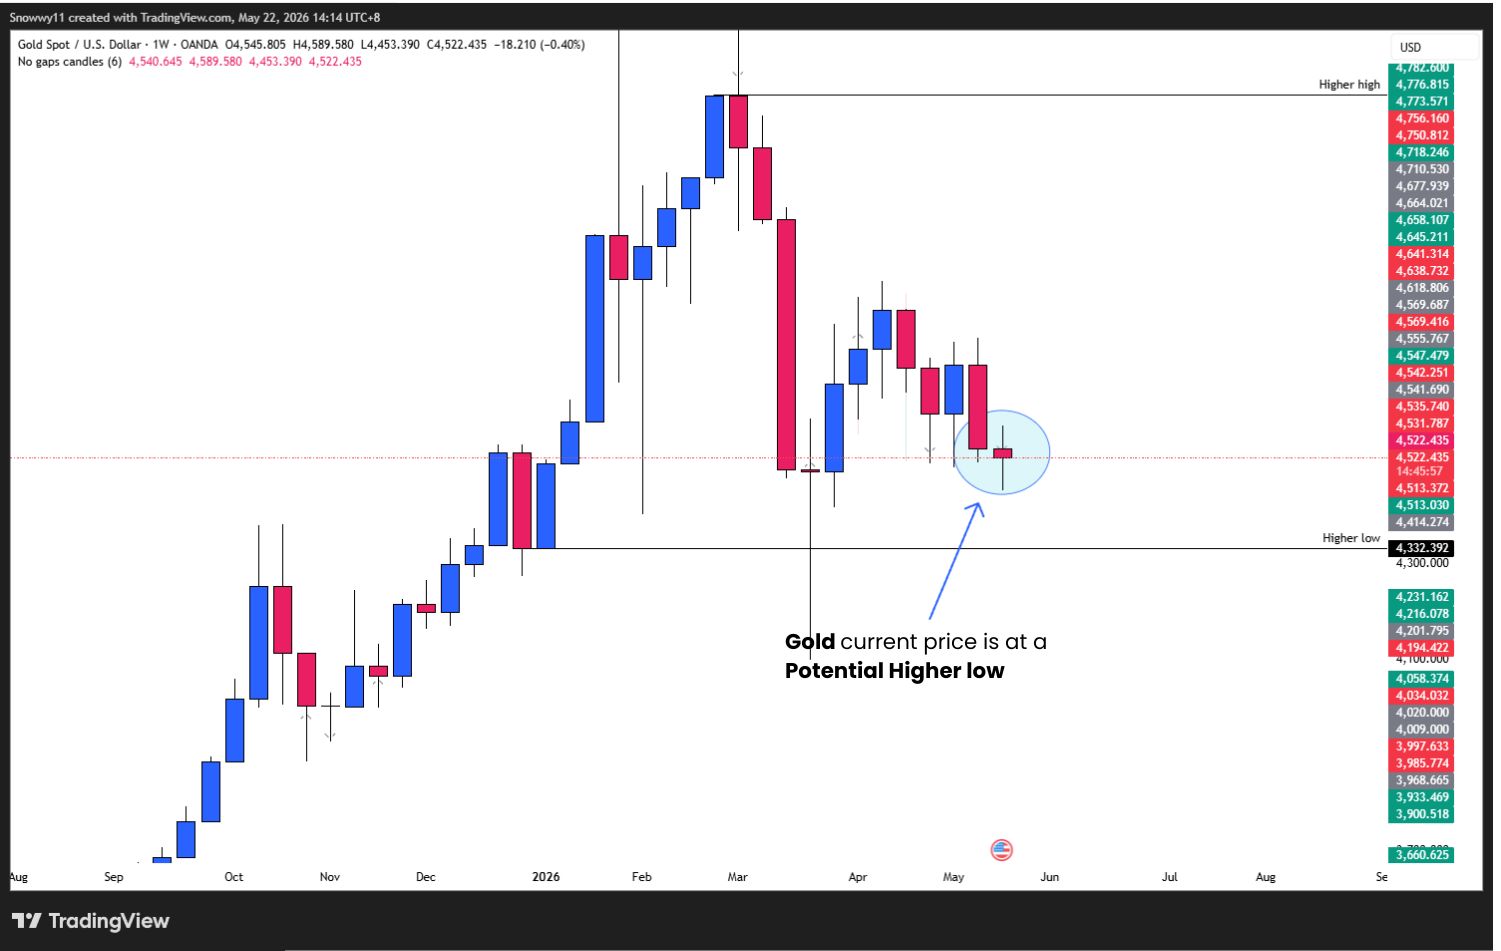
Gold Weekly Chart Price Action Analysis. Identifying Market Structure
Current price action on Gold (XAU/USD) in the weekly timeframe is clearly in a bullish trend (market trend). The current markets structure of gold is also at a potential higher low (potential higher low is formed before bullish momentum push).
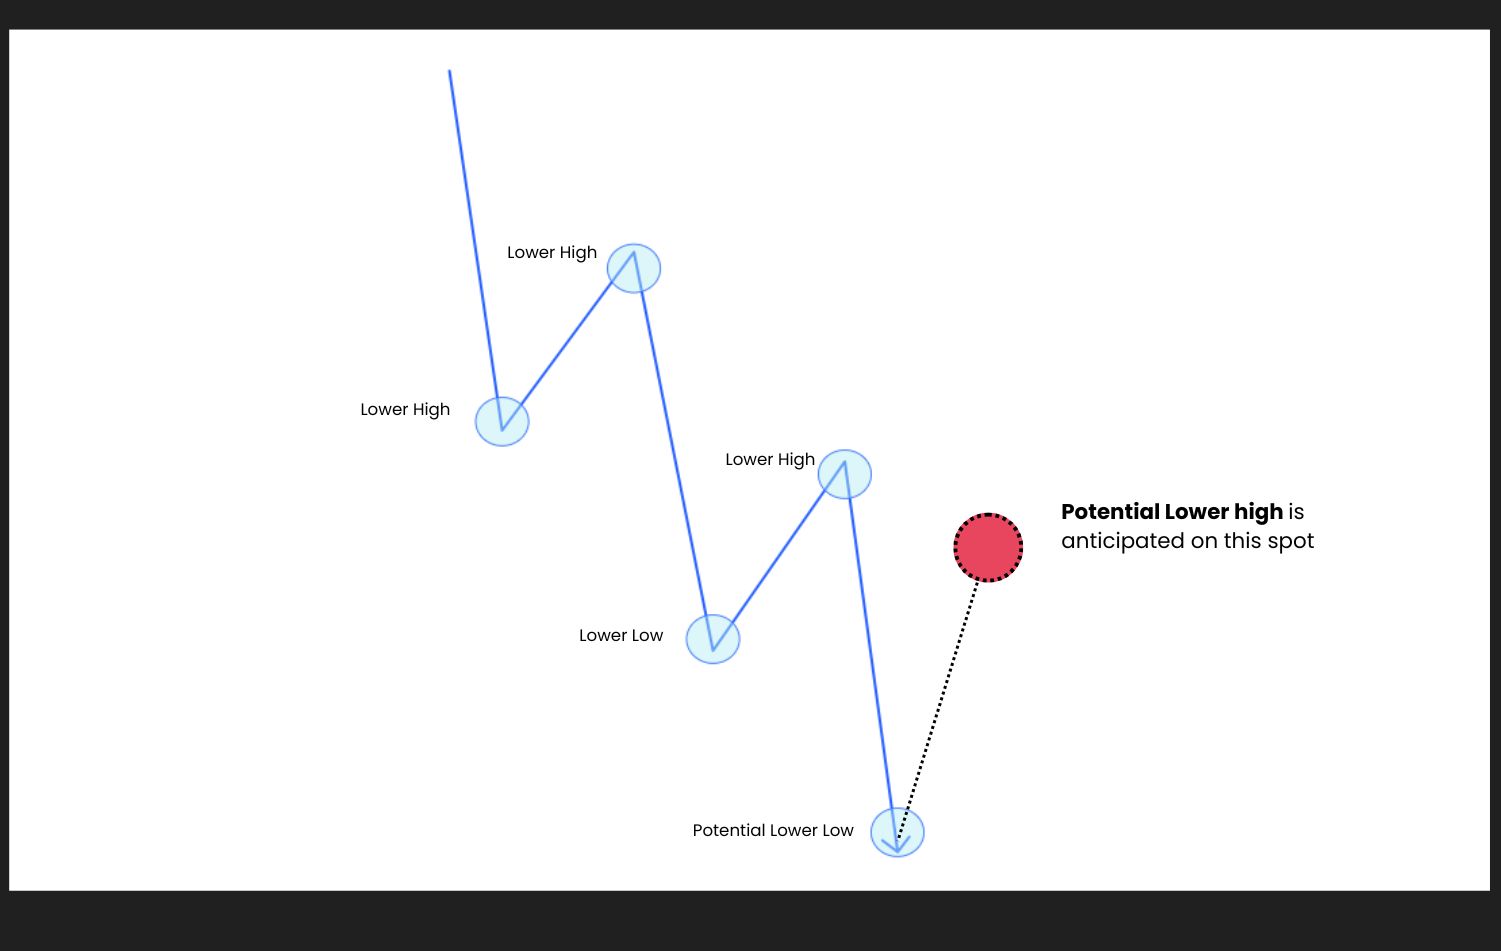
Bearish Market Structure
Bearish market structure consist of lower high and lower low structure (points or elbows). In order for it to continue to push its bearish momentum to the downside, it needs to create those lower high structures.
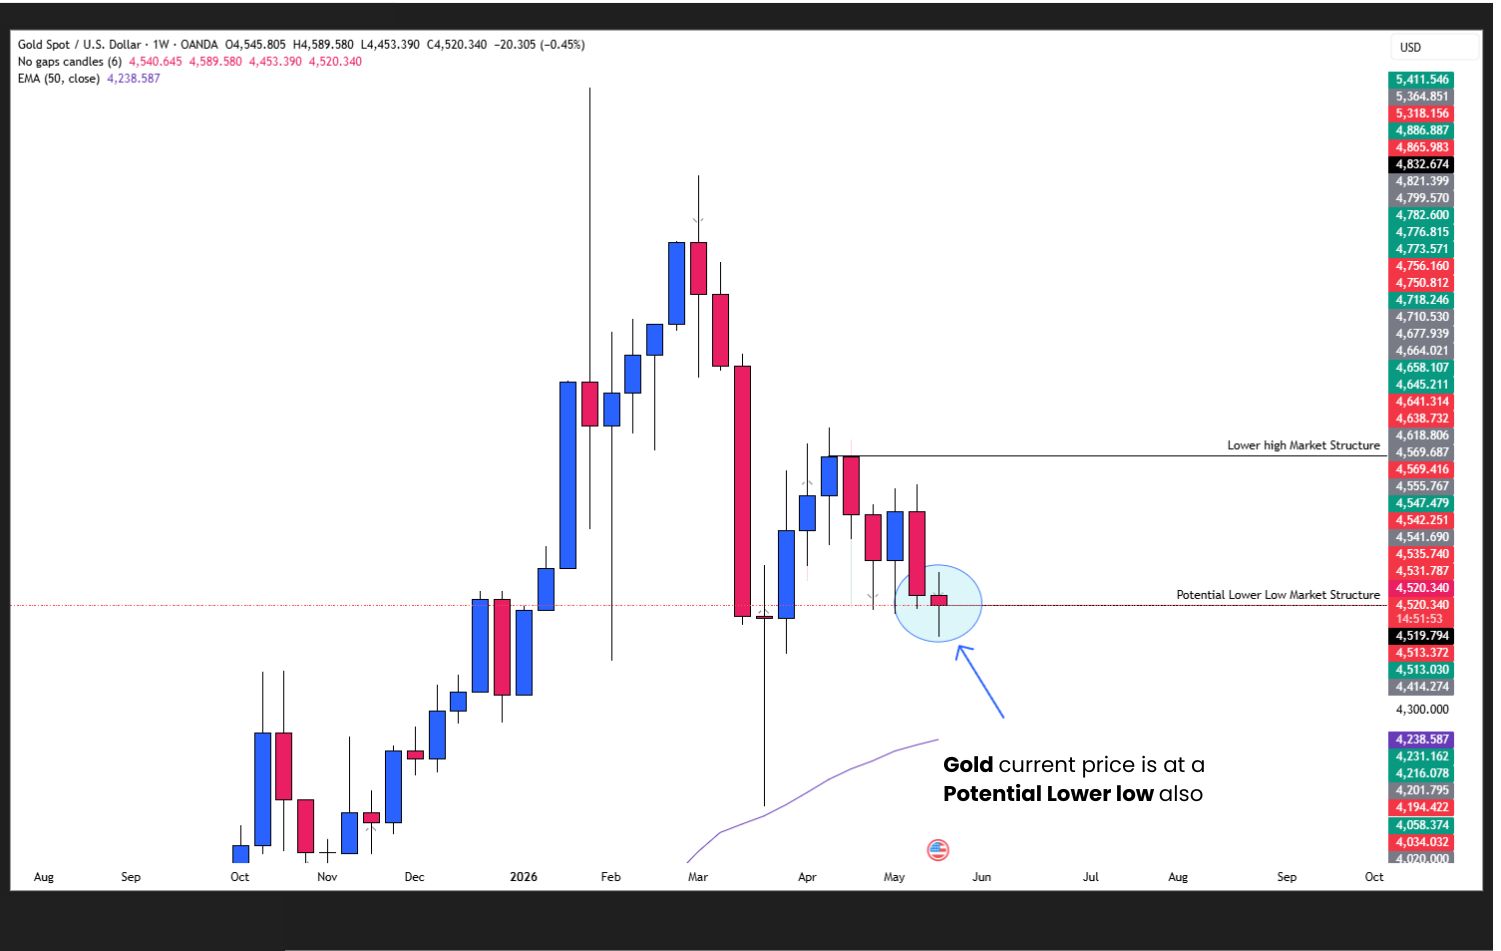
On the weekly timeframe, Gold is still generally in a broader bullish trend. This means the overall market direction is still pointing upward over the long term.
However, inside that bullish trend, the market is currently showing a bearish internal structure.
Note: Always begin with the weekly chart first, then move down to the daily chart for additional confirmation.
Time frame to look at:
What are you looking for:
This helps you understand where you positioning your trades (whether your buying on a strong resistance or selling at a strong support level).
Checkout my blog on how I use break & retest pattern using support and resistance level: Break and Retest: How to Capitalize Repetitive Patterns in Trading?
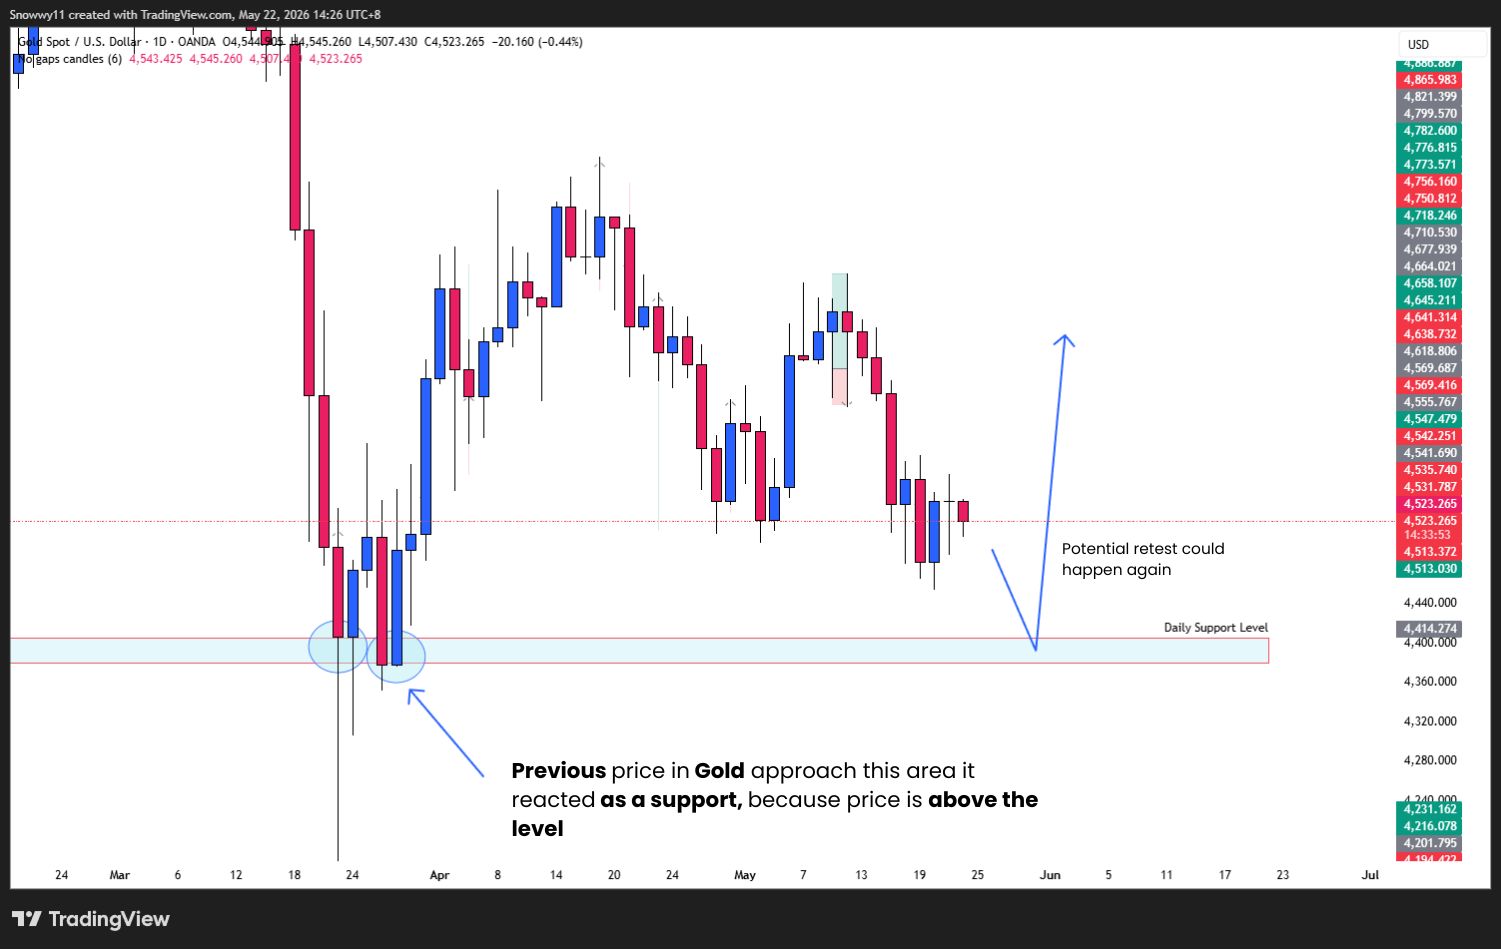
Daily Chart. Identifying Support Level (Floor)
When price is above the area of interest (AOI) level, price would react at the level as a floor or support level.
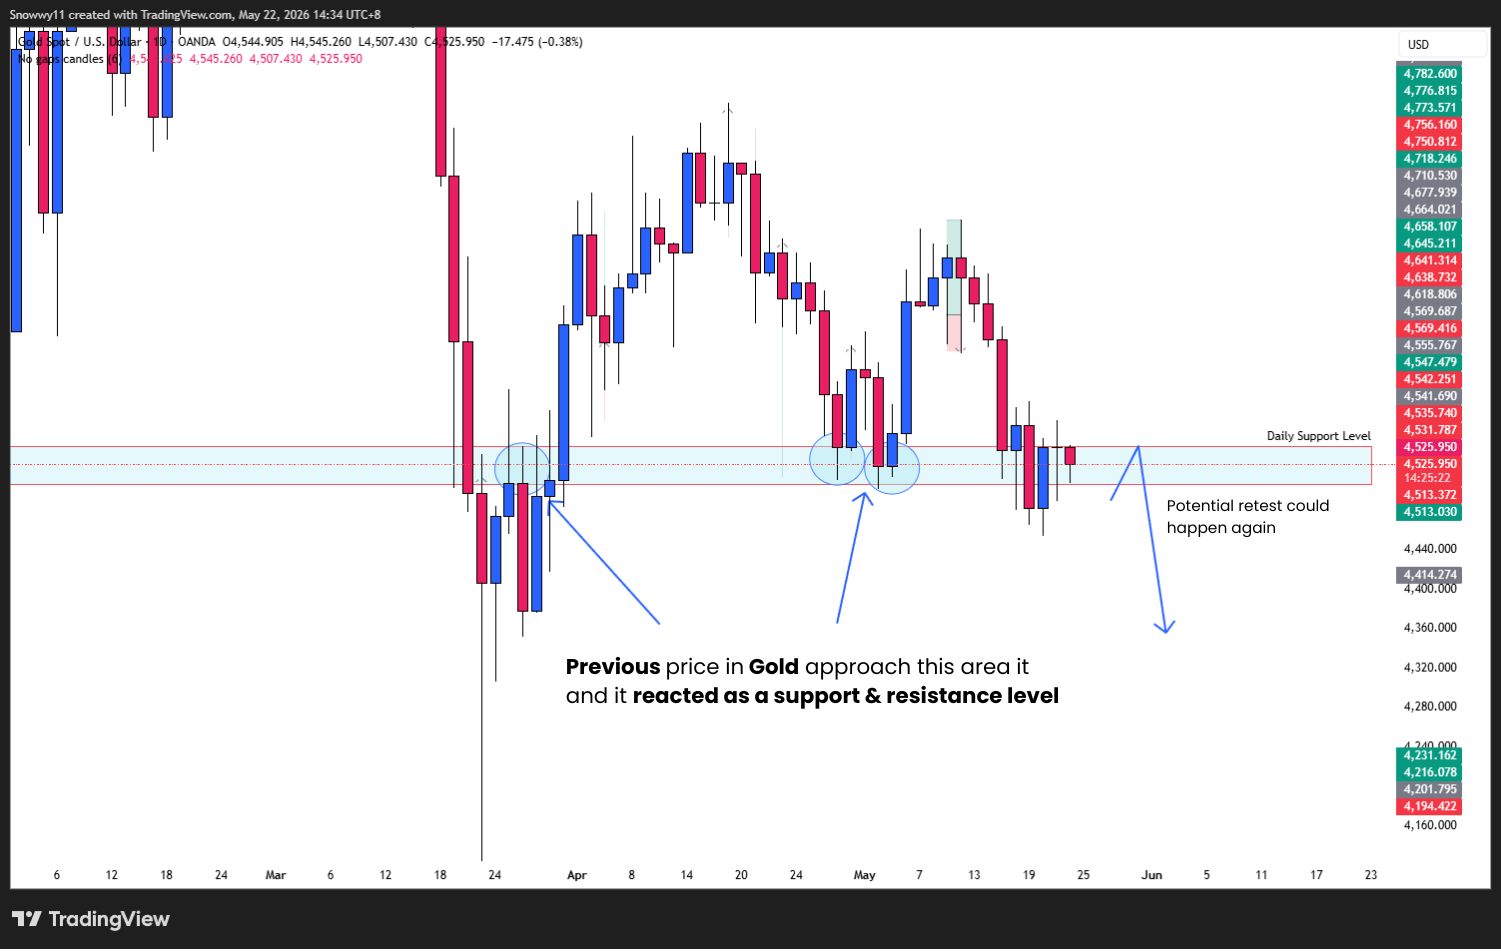
Daily Chart. Identifying Resistance Level (Ceiling)
When price is below the area of interest (AOI) level, price would react at the level as a ceiling or resistance level.
Note: Past performance is not a reliable indicator of future results.
Timeframes to look at:
What you are looking for:
To know more about how capture sniper Entry Signal, check out my Blog: GBP/CAD Simple Forex Price Action Ideas: Is the 1.84500 Support Level Holding?
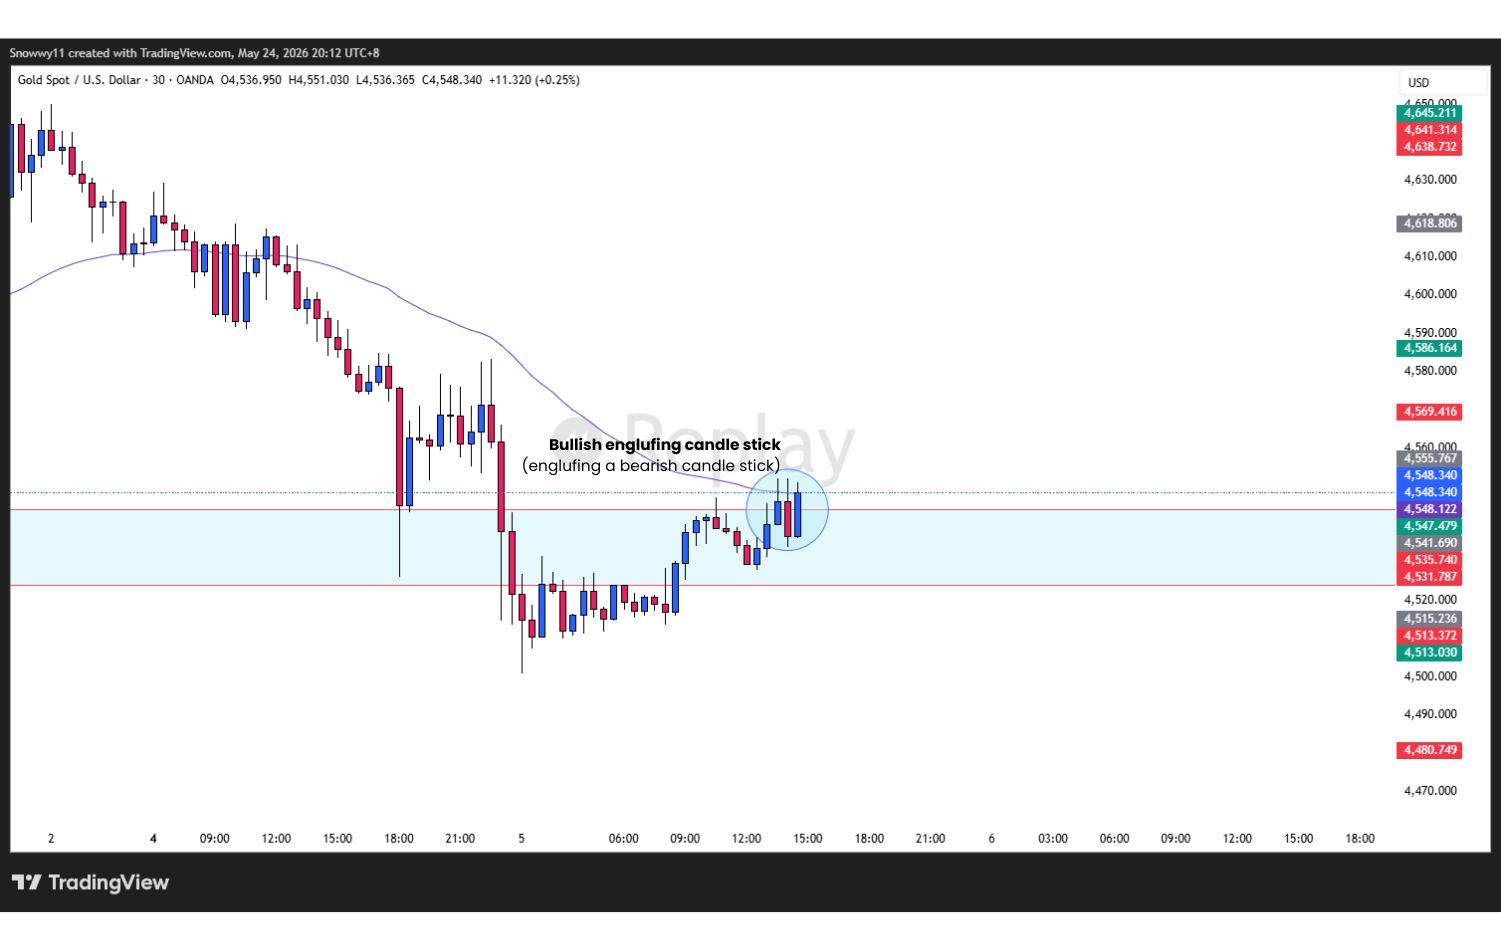
30m Chart Simple Price Action Analysis. Bullish Candle stick Confirmation
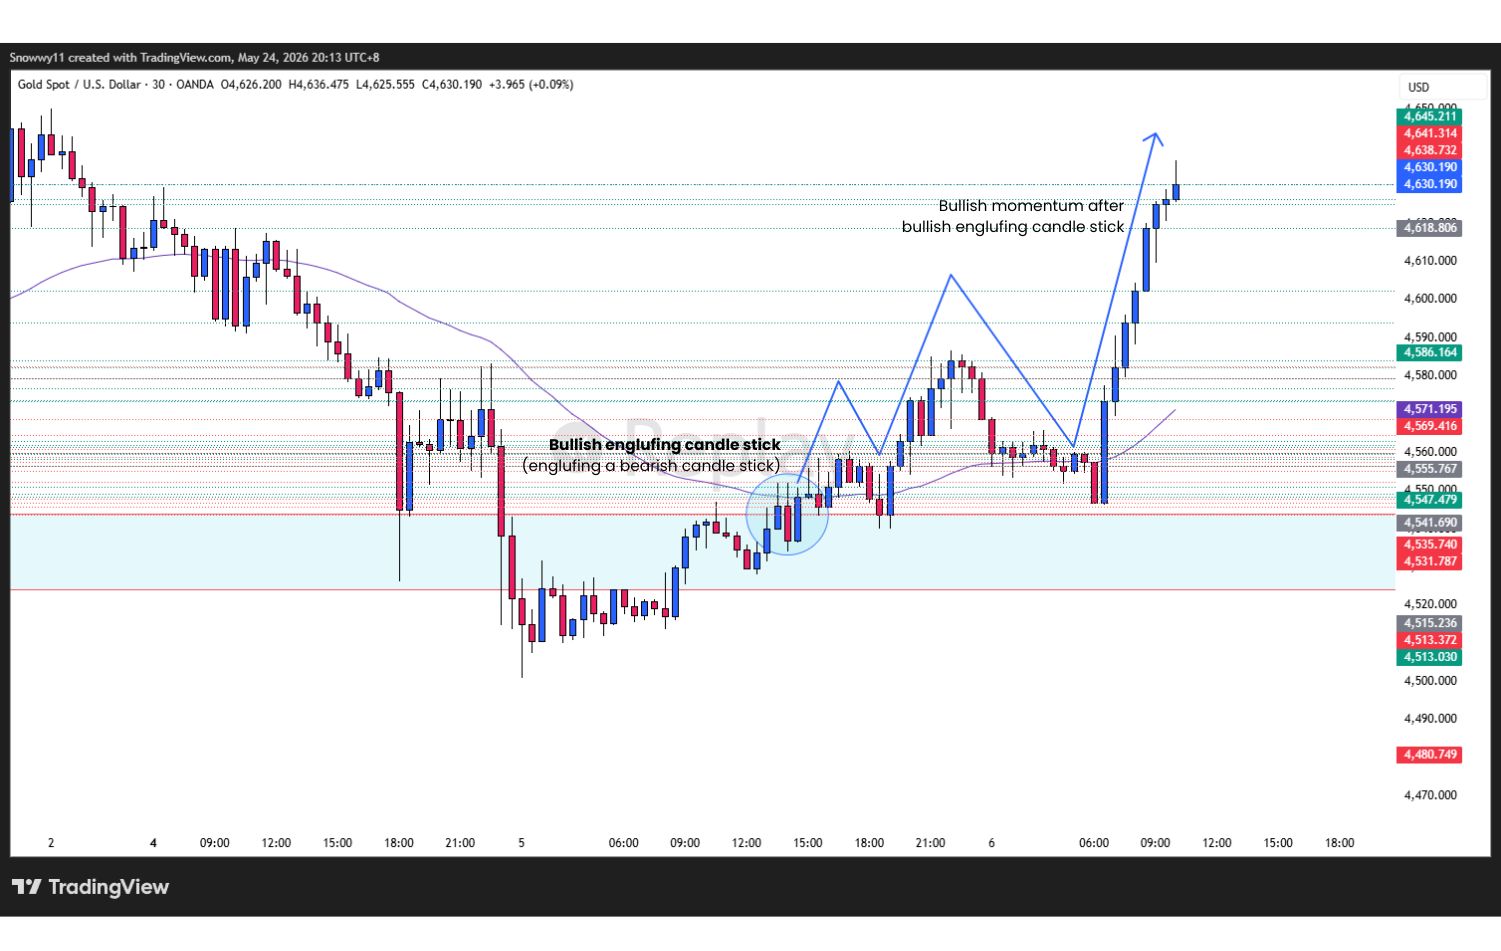
30m Chart Simple Price Action Analysis. Bullish Rally after Candlestick Confirmation
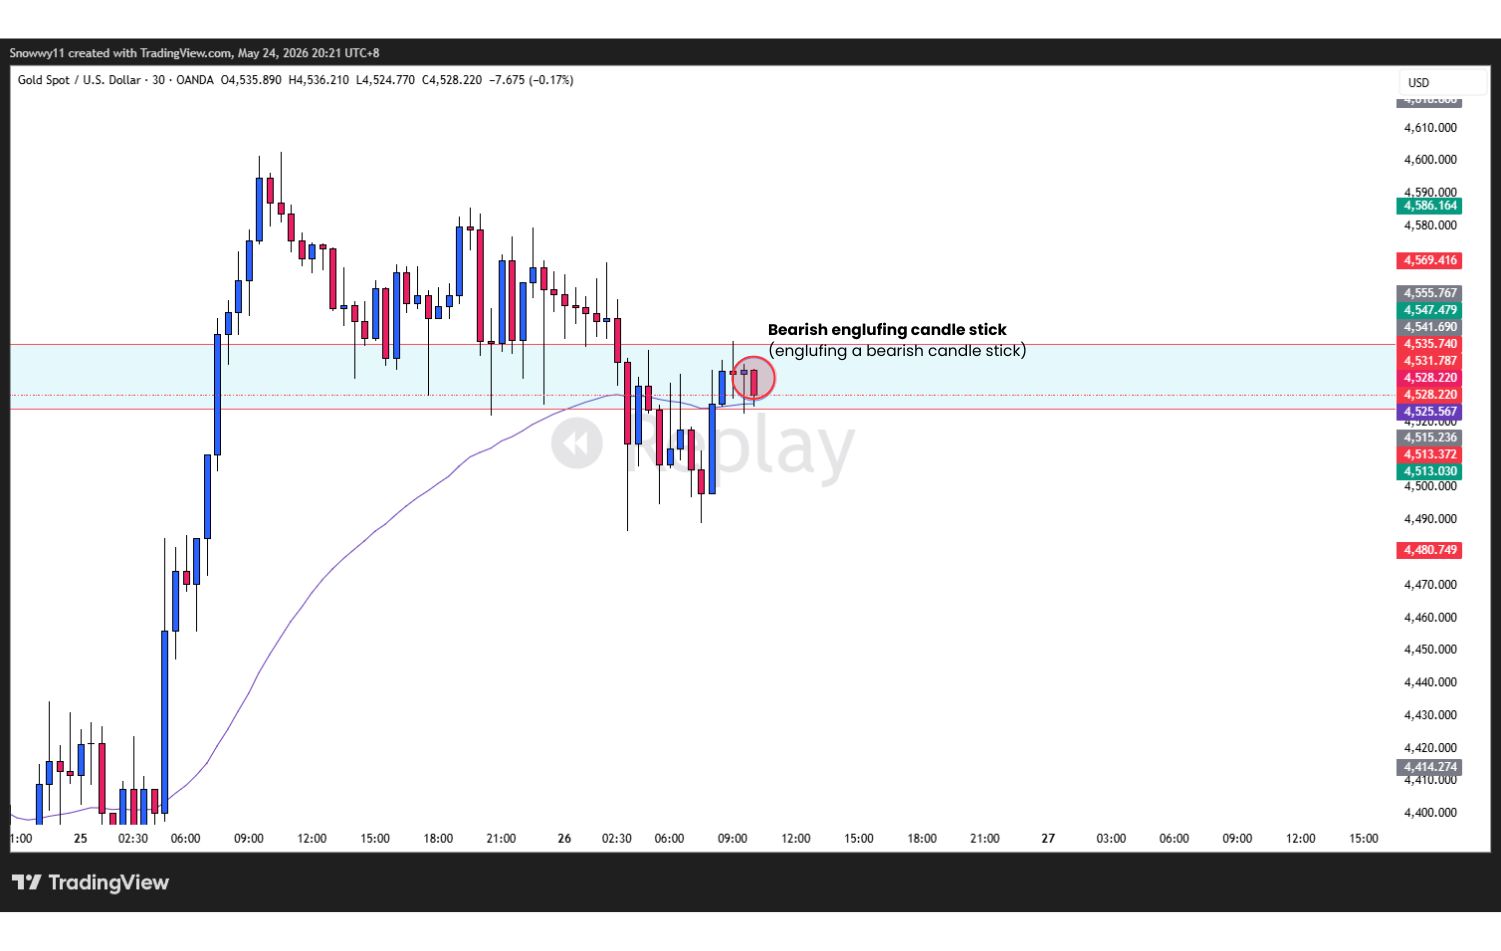
30m Chart Simple Price Action Analysis. Bearish Candle stick Confirmation
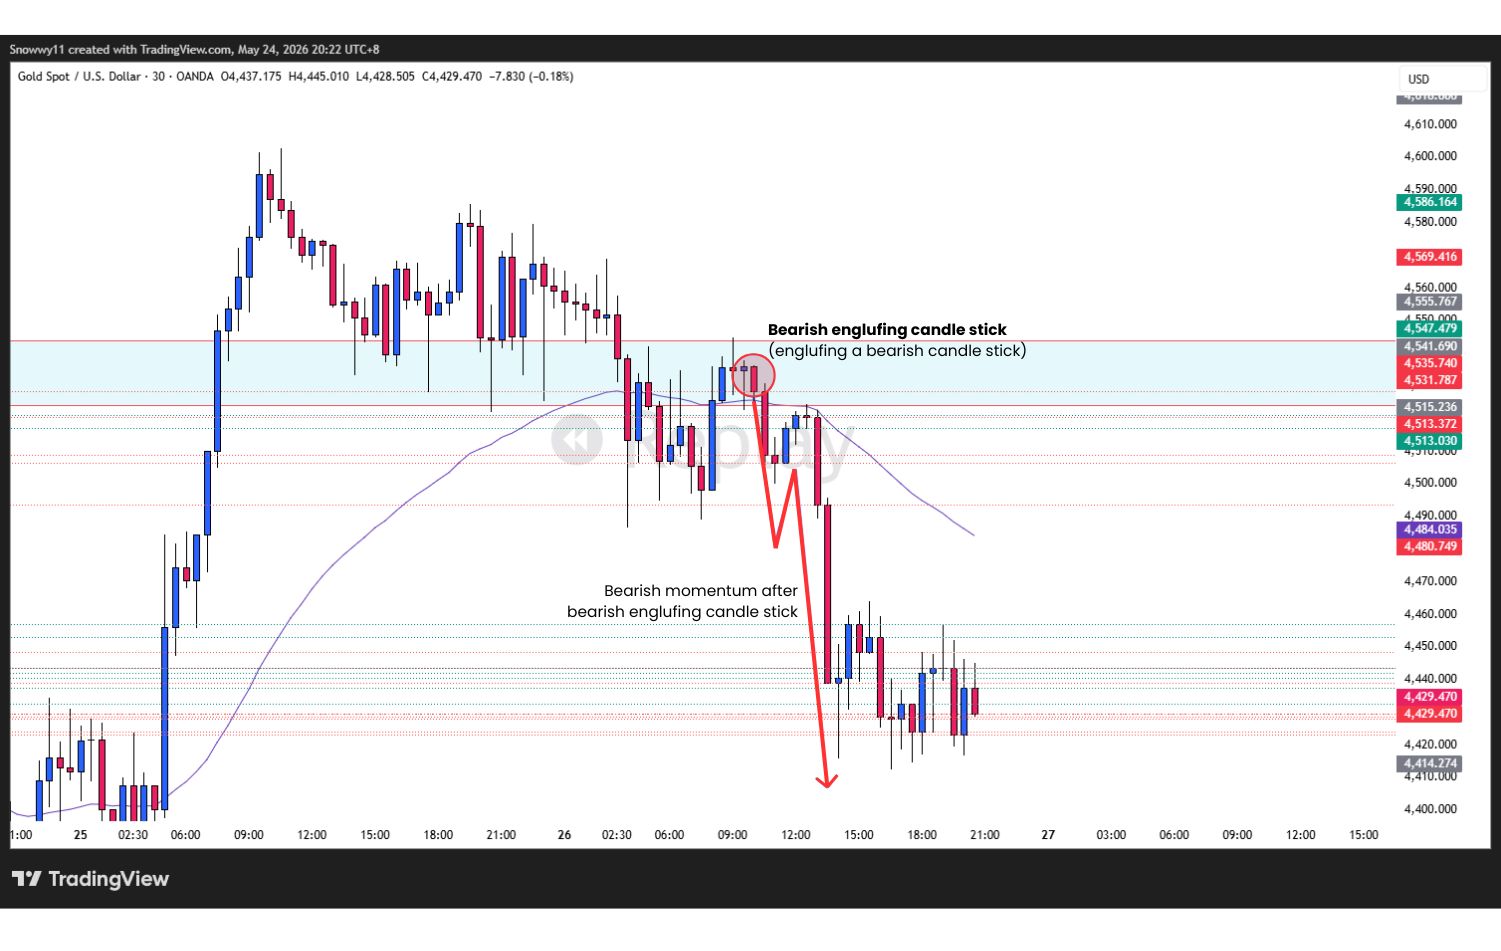
30m Chart Simple Price Action Analysis. Bearish Rally after Candlestick Confirmation
Note: Past performance is not a reliable indicator of future results.
What are we looking for:
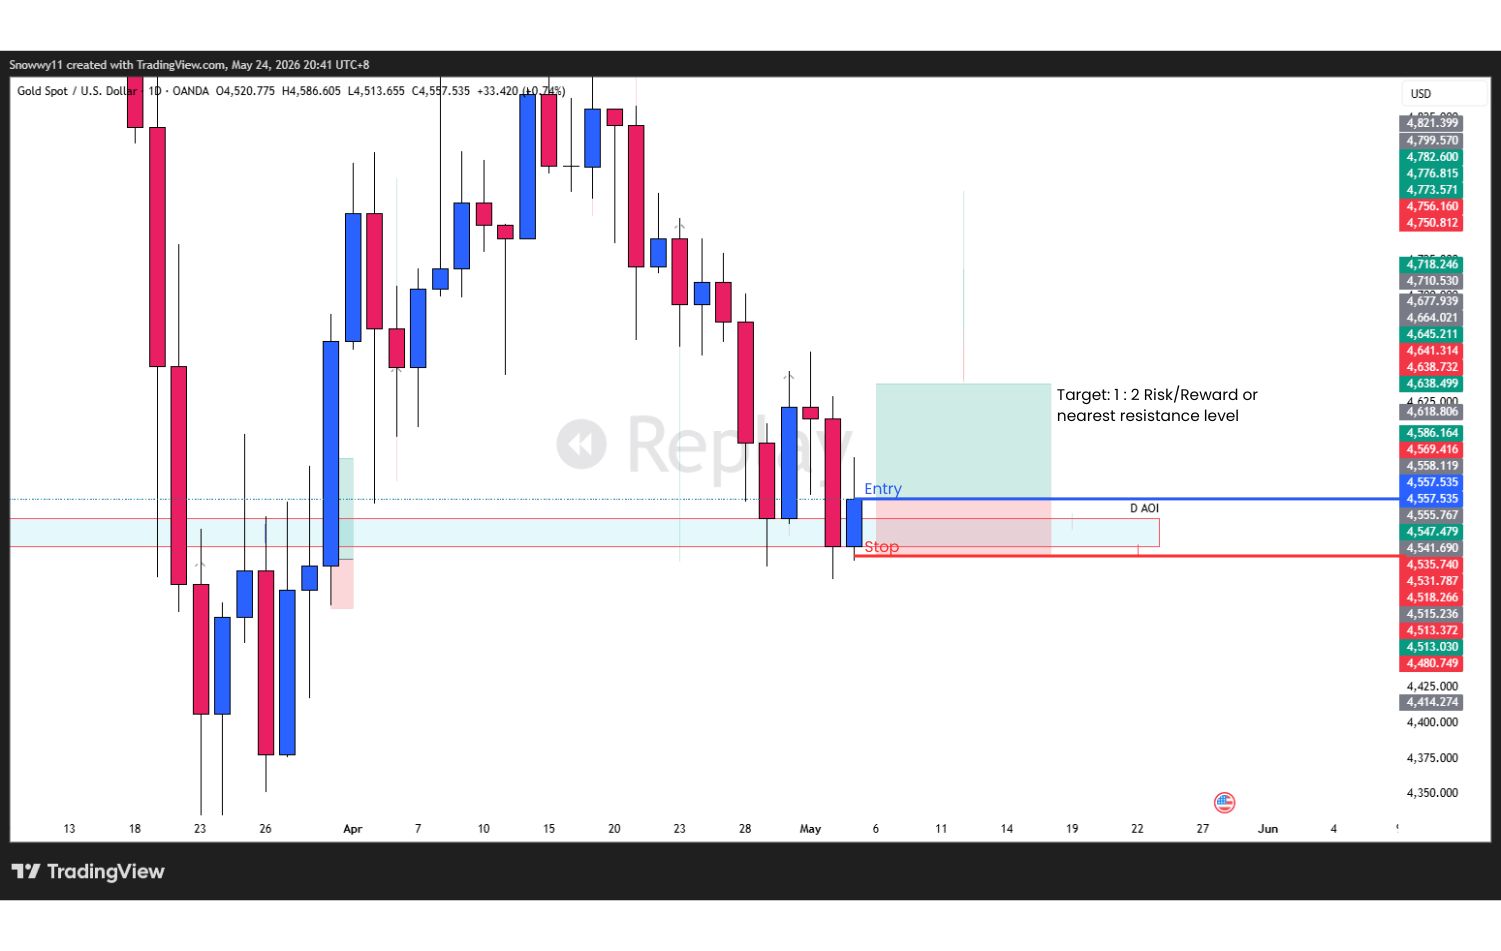
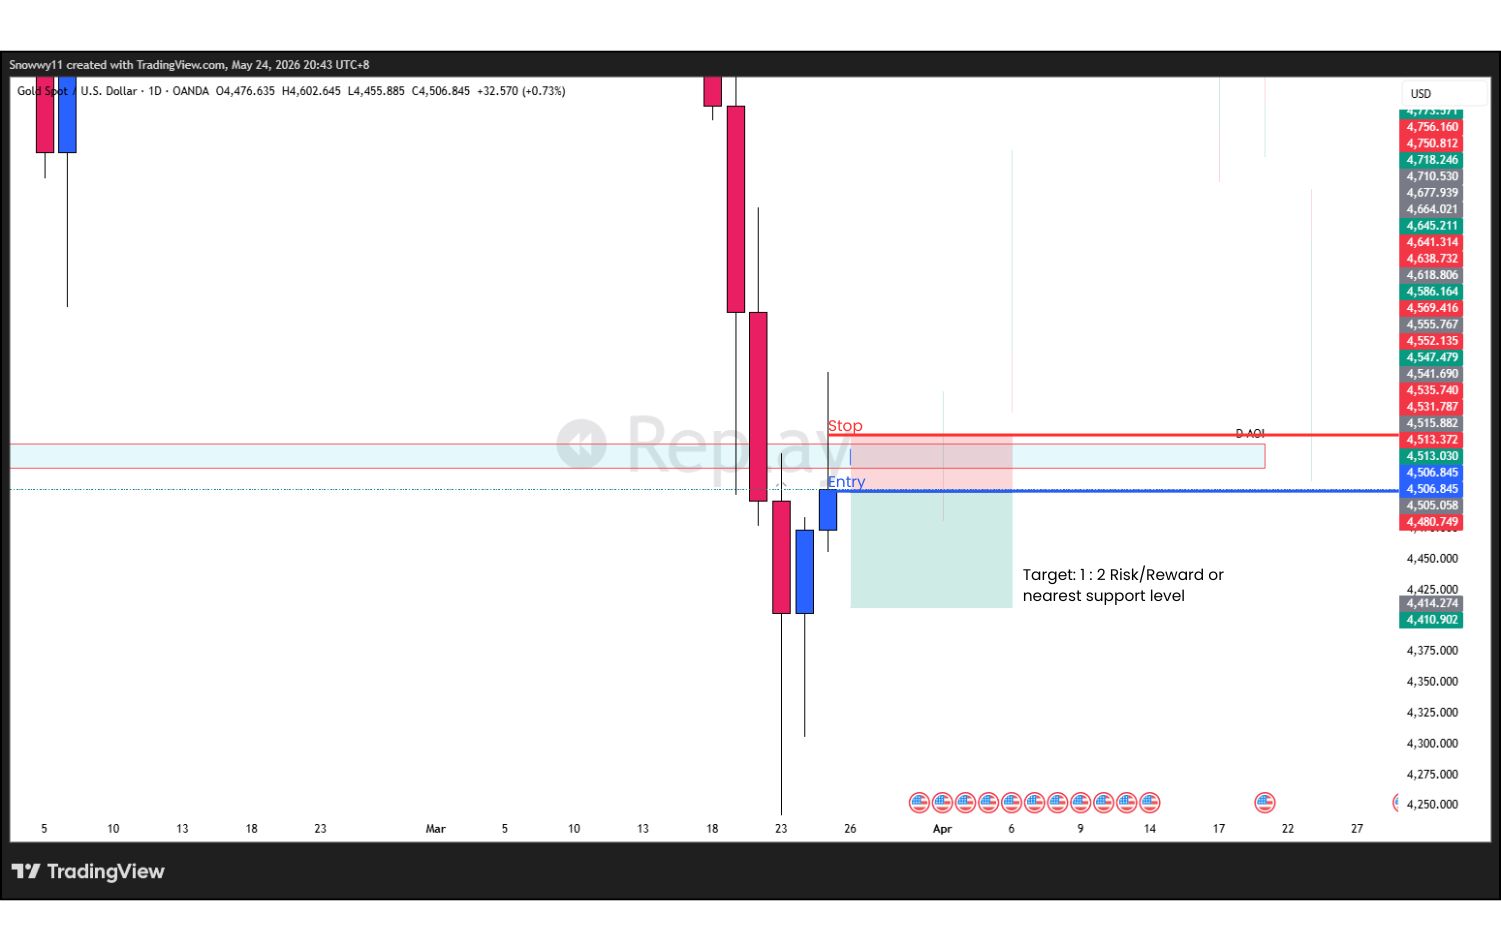
Good stop-loss placement
This means you are not just “limiting loss,” but defining If price hits the stop-loss, therefore the trading idea is clearly invalid.
Take-Profit (Target Zones)
Note: Past performance is not a reliable indicator of future results.
Checkout my blog on how I use fundamentals to reconsider market volatility on Gold: Gold (XAU/USD) Price Action Ideas: Will News Trigger a Breakout or Consolidation on Gold?

Successful trading isn’t about finding the perfect strategy.
It’s about how well you manage risk, how consistently you follow your plan, and how disciplined you stay when the market doesn’t go your way.
Because in the long run, it’s not the best setup that wins!
It’s the trader who can stay steady through every condition and keep showing up with control, patience, and clarity.
For more in-depth market breakdowns, real-time analysis, and structured learning content, you can join our Discord community inside ACY Server:
Discord Server - ACY Securities Server
Start your live trading journey today!
• Trade Forex, indices, gold, crypto and other global markets
• Access powerful platforms including ACY, MT4, MT5, and Copy Trading tools
Move from learning simple price action to executing it in the real market with confidence!
Create an Account. Start Your Live Trading Now!
Ready to learn simple price action strategy? Here’s how to do it step by step:
Gold is still one of the most traded assets, here’s how to trade it with confidence:
Your mindset is what separates steady growth from costly mistakes. Focus on these essentials:
Not sure where to begin? Here’s a simple roadmap to guide you:
By building step by step; from basics → real trading → mastering the craft, you’ll gain clarity, confidence, and steady progress without ever feeling overwhelmed.
Follow me for more daily market insights!
Ruffy Grant B. Capacio - LinkedIn
Disclaimer:
Trading forex and derivative instruments involves substantial risk and may not be suitable for all individuals. Only use funds that you are prepared to lose. It is important to understand how these markets work and the risks involved before trading, and to seek independent financial advice if needed. All market analysis and insights shared are intended for educational and informational purposes only and should not be considered financial or investment advice. May 25, 2026
ACY Securities is one of Australia's fastest growing multi-asset online trading providers, offering ultra-low-cost trading, rock-solid execution, technologically superior account management and premium market analysis.
Select the categories and companies you wish to follow directly to your person rss feed.
Create Custom RSS FeedSign up and join over 5,000 professional members who receive personalized news alerts, curated professional connections, and more for free!
Sterling steadies after political uncertainty rattled gilt markets, while EUR/USD and EUR/GBP approach key technical levels ahead of today's European session.
GBP/AUD remains trapped in a well-defined bearish trend on both the weekly and daily timeframes.
Discover the key drivers, technical levels, and central bank expectations shaping the EUR/USD trend as the ECB prepares to hold rates and markets watch for a potential breakout.
Sydney-based multi-asset broker ACY Securities has introduced PAXGUSD, a new CFD instrument that allows clients to trade tokenised gold against the US Dollar 24 hours a day, seven days a week. The instrument is available across MetaTrader 4, MetaTrader 5, and the ACY Trading Platform.
Binance has lowered its VIP 3 Wallet Assets threshold from $3 million to $1 million and will now count OTC Spot Trading Volume at a 4x multiplier toward VIP qualification, removing the previous VIP 4 cap and allowing eligible users to progress through the full tier framework up to VIP 9.
Retail futures trading leader NinjaTrader Group has appointed Mark Omens as Senior Vice President, Commercial Strategy, bringing a 25-year veteran of derivatives marketplace CME Group into a newly created role focused on exchange partnerships and enterprise growth.
Gold Price Action Forecast: Will XAU/USD Drop to $3930? Meta Description: Read our Gold price action forecast to see if XAU/USD will drop to $3930.
BitDelta Securities Financial Services LLC (“BitDelta Securities”) today announced that it has received full regulatory approval from the Capital Market Authority (“CMA”) of the United Arab Emirates under the Category 5 — Arrangement and Advice license framework (License No. 20200000439). The approval follows the firm's receipt of In-Principal Approval earlier this year and represents the successful conclusion of the CMA's full licensing process, including the satisfaction of capital requirements, governance appointments, and operational setup.
Crypto.com has received a $400 million strategic investment from Citadel Securities, valuing the firm at $20 billion. It marks the first institutional funding round in the company's history, aimed at accelerating its expansion into tokenised securities, derivatives and other asset classes.
WTI’s pullback into $79–82 is the first major test of the bullish Elliott Wave count, with buyers targeting a renewed break above $85.


