just now

Liquidity Finder Ltd is incorporated in England and Wales, company number 10610740, registered address 167-169 Great Portland Street, Fifth Floor, London W1W 5PF, United Kingdom.
Published: just now
By now, you should already feel a shift in how you view MACD.
It’s no longer a “buy/sell indicator.”
It’s no longer something you react to.
Instead, MACD has become something you observe - a tool that helps you understand how price is moving, not where it will go next.
This final step is where most traders either level up or fall back into old habits.
Because MACD only becomes powerful when it is anchored to market structure.
Without structure, MACD is noise.
With structure, MACD becomes context.
Most indicator-based strategies fail for one simple reason:
they try to predict instead of confirm.
Crossovers, divergences, histogram flips - all of these can appear:
Without structure, you’re reacting to fluctuations instead of reading intent.
This is why understanding market structure - higher highs, higher lows, breaks, failures - is non-negotiable. If you need a deeper foundation on this, revisit How to Think Like a Price Action Trader, where structure is framed as behavior, not pattern recognition.
MACD doesn’t replace structure.
It responds to it.
Structure always comes first.
Before looking at MACD, ask:
MACD should never decide bias.
Bias comes from price.
MACD’s job is to tell you whether momentum agrees with that bias.
If structure is bullish but MACD momentum is contracting, you don’t short - you reduce expectations.
Once structure gives direction, MACD helps you answer a deeper question:
Is this move healthy or fragile?
This is where the histogram becomes critical.
This approach aligns naturally with trend-based frameworks like the Moving Averages Trading Strategy Playbook, where momentum and direction must agree for continuation.
MACD doesn’t tell you where to enter.
It tells you how confident you should be.
The most common mistake traders make is watching MACD on every candle.
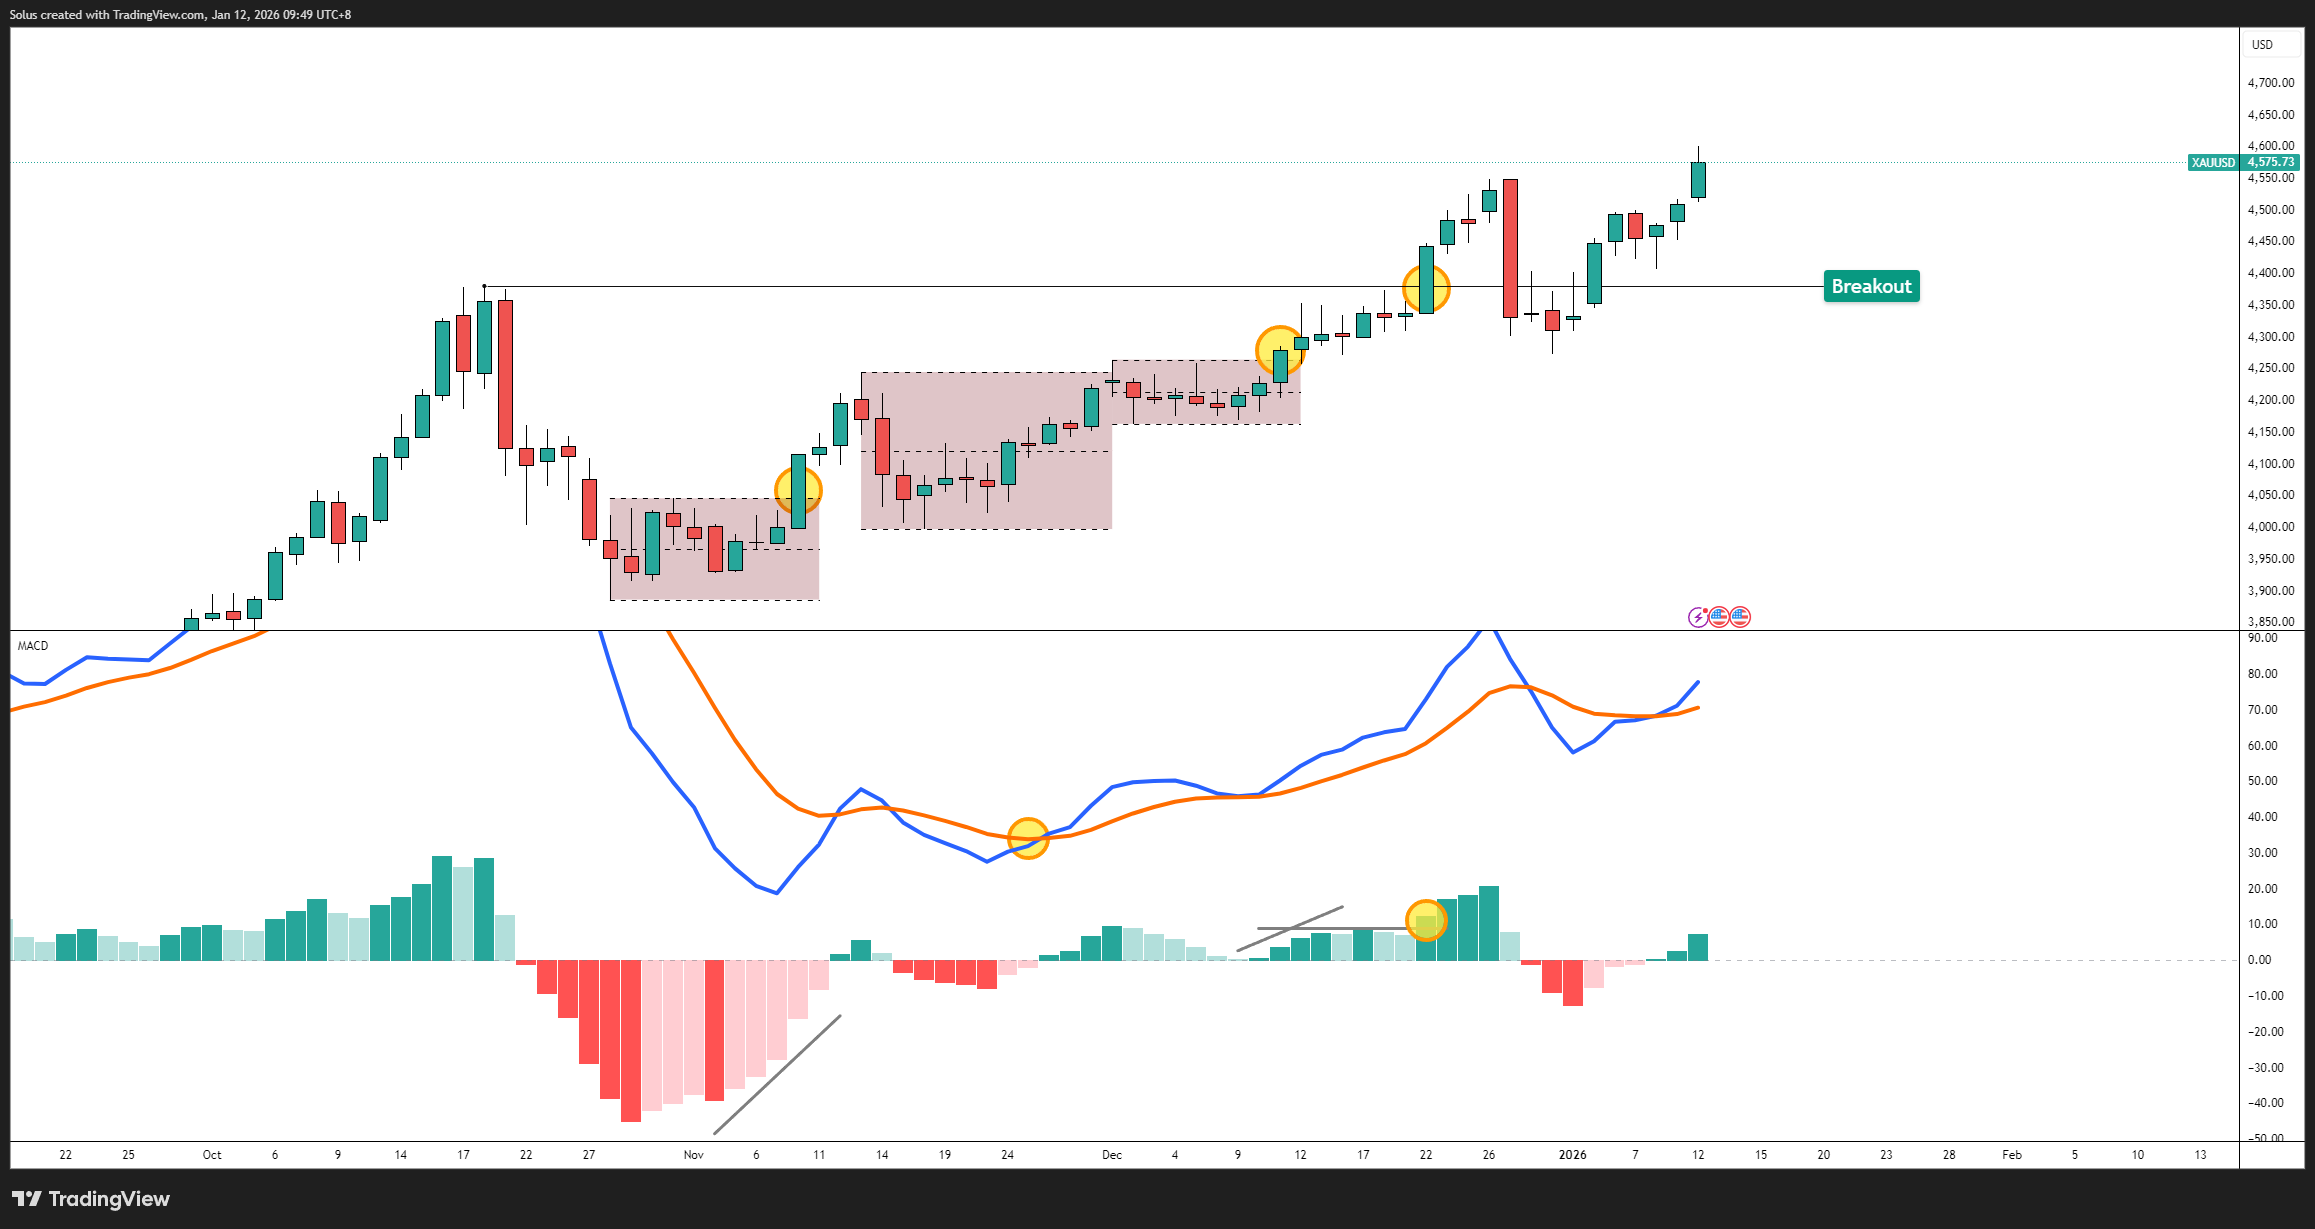
Instead, MACD should be observed only at structural moments:
This dramatically reduces noise and emotional overtrading.
If you’re combining MACD with Smart Money Concepts, this fits seamlessly with ideas explained in Why Smart Money Concepts Work, where indicators are used as confirmation, not decision-makers.
One of MACD’s most underrated uses is trade management.
Instead of exiting because of fear or boredom, you can observe:
This doesn’t mean “exit immediately.”
It means:
This mindset shift is reinforced in Trading in the Zone: Thinking in Probabilities, where traders are trained to manage uncertainty rather than eliminate it.
Here’s how professionals actually use MACD:
Notice what’s missing?
No blind crossovers.
No automatic entries.
No emotional reactions.
MACD becomes a lens, not a trigger.
Market structure is your map.
MACD is the weather.
Bad weather doesn’t cancel the destination.
It tells you to slow down, adjust, or wait.
Trading without MACD is driving blind.
Trading with MACD but without structure is ignoring the map.
You need both.
This is where discipline shows.
If structure is intact but MACD weakens:
If MACD is strong but structure is unclear:
No trade is better than a forced trade - a lesson reinforced repeatedly in Trading Risk Management: The Real Edge Behind Consistency.
MACD does not create edge. Structure does.
MACD simply tells you:
Used this way, MACD stops being confusing - and starts becoming calming.
It can, but it’s strongest when paired with clear price action and key levels.
No. Use it on the timeframe you execute on, with higher timeframes defining structure.
It’s not better - it’s different. MACD excels at showing momentum flow, not overbought/oversold conditions.
It’s time to go from theory to execution!
Create an Account. Start Your Live Trading Now!
Looking for step-by-step approaches you can plug straight into the charts? Start here:
Sharpen your edge with proven tools and frameworks:
News moves markets fast. Learn how to keep pace with SMC-based playbooks:
From NASDAQ opens to DAX trends, here’s how to approach indices like a pro:
Gold remains one of the most traded assets - here’s how to approach it with confidence:
Candlesticks are the building blocks of price action. Master the most powerful ones:
Ready to go intraday? Here’s how to build consistency step by step:
Markets swing between calm and chaos. Learn to read risk-on vs risk-off like a pro:
Step inside the playbook of institutional traders with SMC concepts explained:
Forex pairs aren’t created equal - some are stable, some are volatile, others tied to commodities or sessions.
If you’ve ever been stopped out right before the market reverses - this is why:
Mindset is the deciding factor between growth and blowups. Explore these essentials:
The real edge in trading isn’t strategy - it’s how you protect your capital:
If you’re not sure where to start, follow this roadmap:
This way, you’ll grow from foundation → application → mastery, instead of jumping around randomly.
Follow me for more daily market insights!
Jasper Osita - LinkedIn - FXStreet - YouTube
This content may have been written by a third party. ACY makes no representation or warranty and assumes no liability as to the accuracy or completeness of the information provided, nor any loss arising from any investment based on a recommendation, forecast or other information supplies by any third-party. This content is information only, and does not constitute financial, investment or other advice on which you can rely.
ACY Securities is one of Australia's fastest growing multi-asset online trading providers, offering ultra-low-cost trading, rock-solid execution, technologically superior account management and premium market analysis.
Select the categories and companies you wish to follow directly to your person rss feed.
Create Custom RSS FeedSign up and join over 5,000 professional members who receive personalized news alerts, curated professional connections, and more for free!
Sterling steadies after political uncertainty rattled gilt markets, while EUR/USD and EUR/GBP approach key technical levels ahead of today's European session.
GBP/AUD remains trapped in a well-defined bearish trend on both the weekly and daily timeframes.
Discover the key drivers, technical levels, and central bank expectations shaping the EUR/USD trend as the ECB prepares to hold rates and markets watch for a potential breakout.
Sydney-based multi-asset broker ACY Securities has introduced PAXGUSD, a new CFD instrument that allows clients to trade tokenised gold against the US Dollar 24 hours a day, seven days a week. The instrument is available across MetaTrader 4, MetaTrader 5, and the ACY Trading Platform.
Binance has lowered its VIP 3 Wallet Assets threshold from $3 million to $1 million and will now count OTC Spot Trading Volume at a 4x multiplier toward VIP qualification, removing the previous VIP 4 cap and allowing eligible users to progress through the full tier framework up to VIP 9.
Retail futures trading leader NinjaTrader Group has appointed Mark Omens as Senior Vice President, Commercial Strategy, bringing a 25-year veteran of derivatives marketplace CME Group into a newly created role focused on exchange partnerships and enterprise growth.
Gold Price Action Forecast: Will XAU/USD Drop to $3930? Meta Description: Read our Gold price action forecast to see if XAU/USD will drop to $3930.
BitDelta Securities Financial Services LLC (“BitDelta Securities”) today announced that it has received full regulatory approval from the Capital Market Authority (“CMA”) of the United Arab Emirates under the Category 5 — Arrangement and Advice license framework (License No. 20200000439). The approval follows the firm's receipt of In-Principal Approval earlier this year and represents the successful conclusion of the CMA's full licensing process, including the satisfaction of capital requirements, governance appointments, and operational setup.
Crypto.com has received a $400 million strategic investment from Citadel Securities, valuing the firm at $20 billion. It marks the first institutional funding round in the company's history, aimed at accelerating its expansion into tokenised securities, derivatives and other asset classes.
WTI’s pullback into $79–82 is the first major test of the bullish Elliott Wave count, with buyers targeting a renewed break above $85.


