just now

Liquidity Finder Ltd is incorporated in England and Wales, company number 10610740, registered address 167-169 Great Portland Street, Fifth Floor, London W1W 5PF, United Kingdom.
Published: just now

AMD, Super Micro Computer and Navitas Semiconductor are all set to report after the U.S. close on Tuesday, May 5, 2026.
Last week’s move was very bullish for the markets. So this week, investors will get a second look into the AI rally to see if actual revenue, forward guidance and demand in other AI businesses are strong enough to justify last week’s move.
AMD is the AI accelerator read, Super Micro is the AI server read, and Navitas is the speculative AI power-infrastructure read.
The market already knows AI demand is strong. The question now is whether these stocks can catch up to the expectations already priced into the rally — and if not, perhaps allow markets to cool off.
Last week’s earnings gave the AI bulls enough to work with, especially outside the usual GPU names.
Company | Result | Guidance / forward read |
| MaxLinear | Beat. Q1 revenue came in at $137.2m, up 43% YoY. | Guided Q2 revenue to $160m-$170m, well above Wall Street’s earlier $137.1m estimate. Infrastructure revenue grew 136% YoY, helped by optical data-centre demand. |
| Monolithic Power | Beat. Q1 revenue rose 26% YoY to $804.2m. | Enterprise Data revenue nearly doubled to $262.8m, helped by AI and server power-management demand. |
| Google Cloud | Strong cloud read. Google Cloud revenue rose 63% to $20bn. | Backlog nearly doubled to $460bn, showing AI services demand is moving beyond just capex headlines. |
| Microsoft Cloud | Strong cloud read. Microsoft Cloud revenue rose 29% to $54.5bn. | Commercial remaining performance obligation rose 99% to $627bn, while Azure and other cloud services grew around 40%. |
The AI story has support from cloud revenue, infrastructure chips and power-management demand, but support is not the same as surprise.
This week, AMD, SMCI and Navitas need to show whether other parts of the AI market can catch up to what traders have already priced.
The options-implied move is probably the cleanest guide for this setup.
Not because price has to stop there, but because it tells us what the market had already priced before earnings. If the report is strong enough, price can break above the upper implied range. If the update disappoints, price can break below the lower range. Either way, the implied move gives us a benchmark for whether the reaction is normal, weak or a real repricing.
These levels are based on May 5, 2026 pre-earnings pricing for the May 8, 2026 weekly options expiry.
Stock | Options-implied move | Lower range | Upper range |
| AMD | Around 8% either way | $331.70 | $389.38 |
| SMCI | Around 12.55%-12.77% either way | $23.70 | $30.50 |
| NVTS | Around ±$2.99 / 17.16% | $14.45 | $20.43 |
AMD’s implied range comes from options pricing ahead of earnings, while SMCI’s expected move has been reported around 12.5% and NVTS options pricing shows a wide earnings-week range into May 8 expiry.
The key is not to treat these levels as hard targets. They are market expectations. If earnings beat or disappoint hard enough, price can move beyond them, which is why the chart zones still matter.
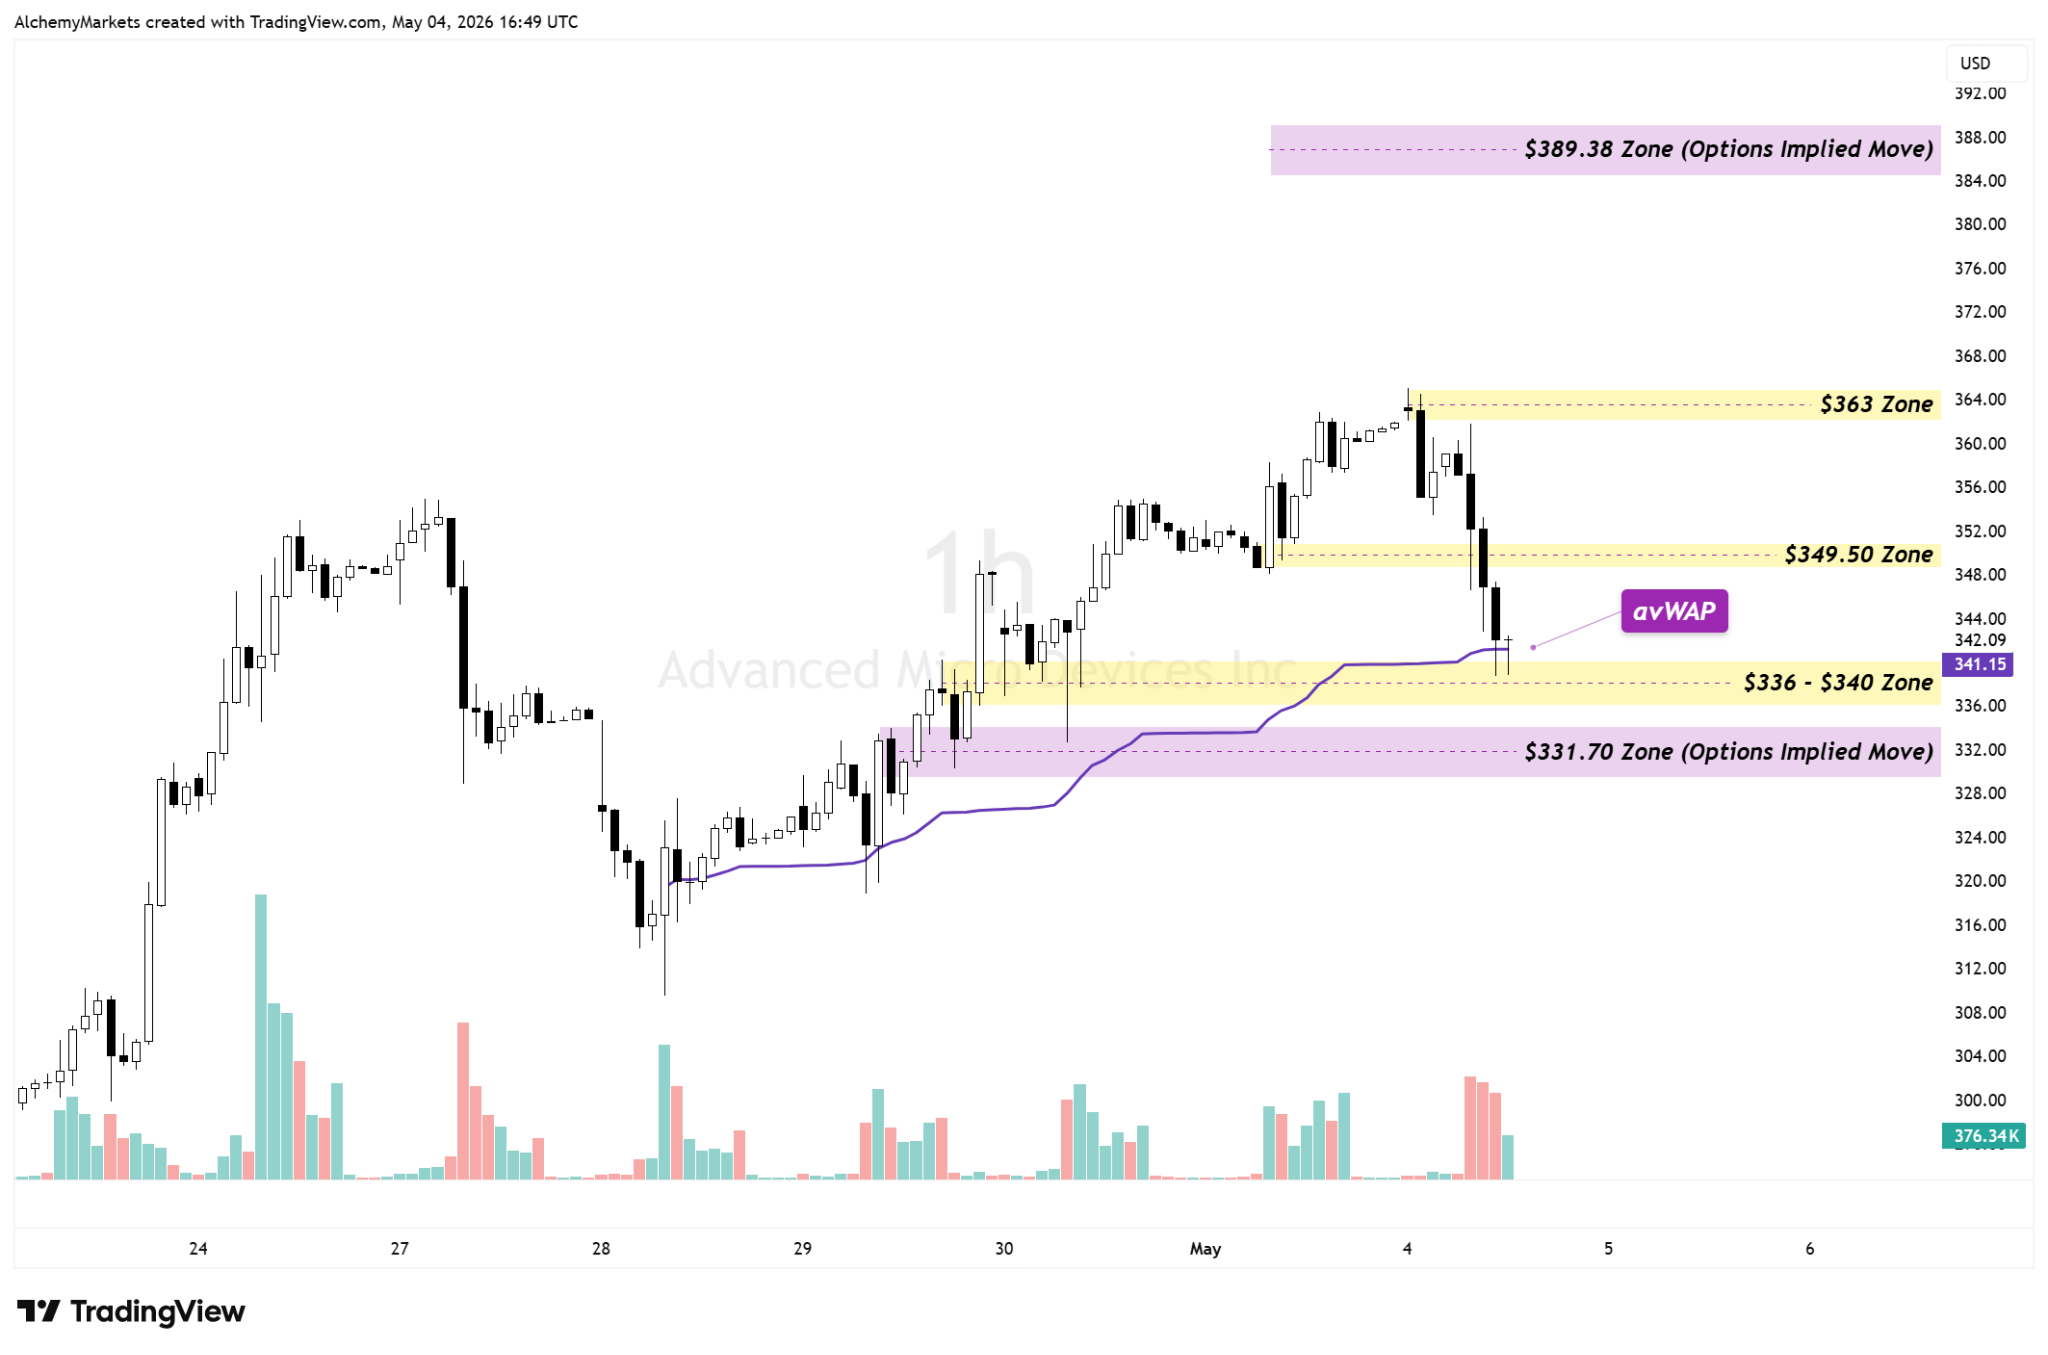
AMD is the cleanest read on whether the AI accelerator story still has room to run. The chart is now testing the $336-$340 zone, with the aVWAP sitting nearby, so that area becomes the first support reaction zone into earnings. If buyers defend it, the pullback still looks contained. If it fails, the lower options-implied range near $331.70 becomes the next stress point.
On the upside, AMD needs to reclaim $349.50 first before the chart starts to repair properly. After that, the $363 zone becomes the more important momentum level, while $389.38 marks the upper end of what the options market had priced before earnings.
AMD setup | Level / stat | Read |
| Lower options-implied range | $331.70 | Downside benchmark if earnings disappoint |
| Main support zone | $336-$340 | First chart reaction area |
| Reclaim level | $349.50 | First level needed to repair momentum |
| Momentum level | $363 | Stronger upside confirmation area |
| Upper options-implied range | $389.38 | Benchmark for a stronger-than-priced reaction |
| Short float | 2.20% | Low squeeze risk |
| Short interest | 35.65m shares | This is not really a short-squeeze setup |
AMD’s short interest is not the exciting part here. With short float at only 2.20%, this is more about guidance and whether the AI accelerator story can still justify the valuation rather than a squeeze-style setup.
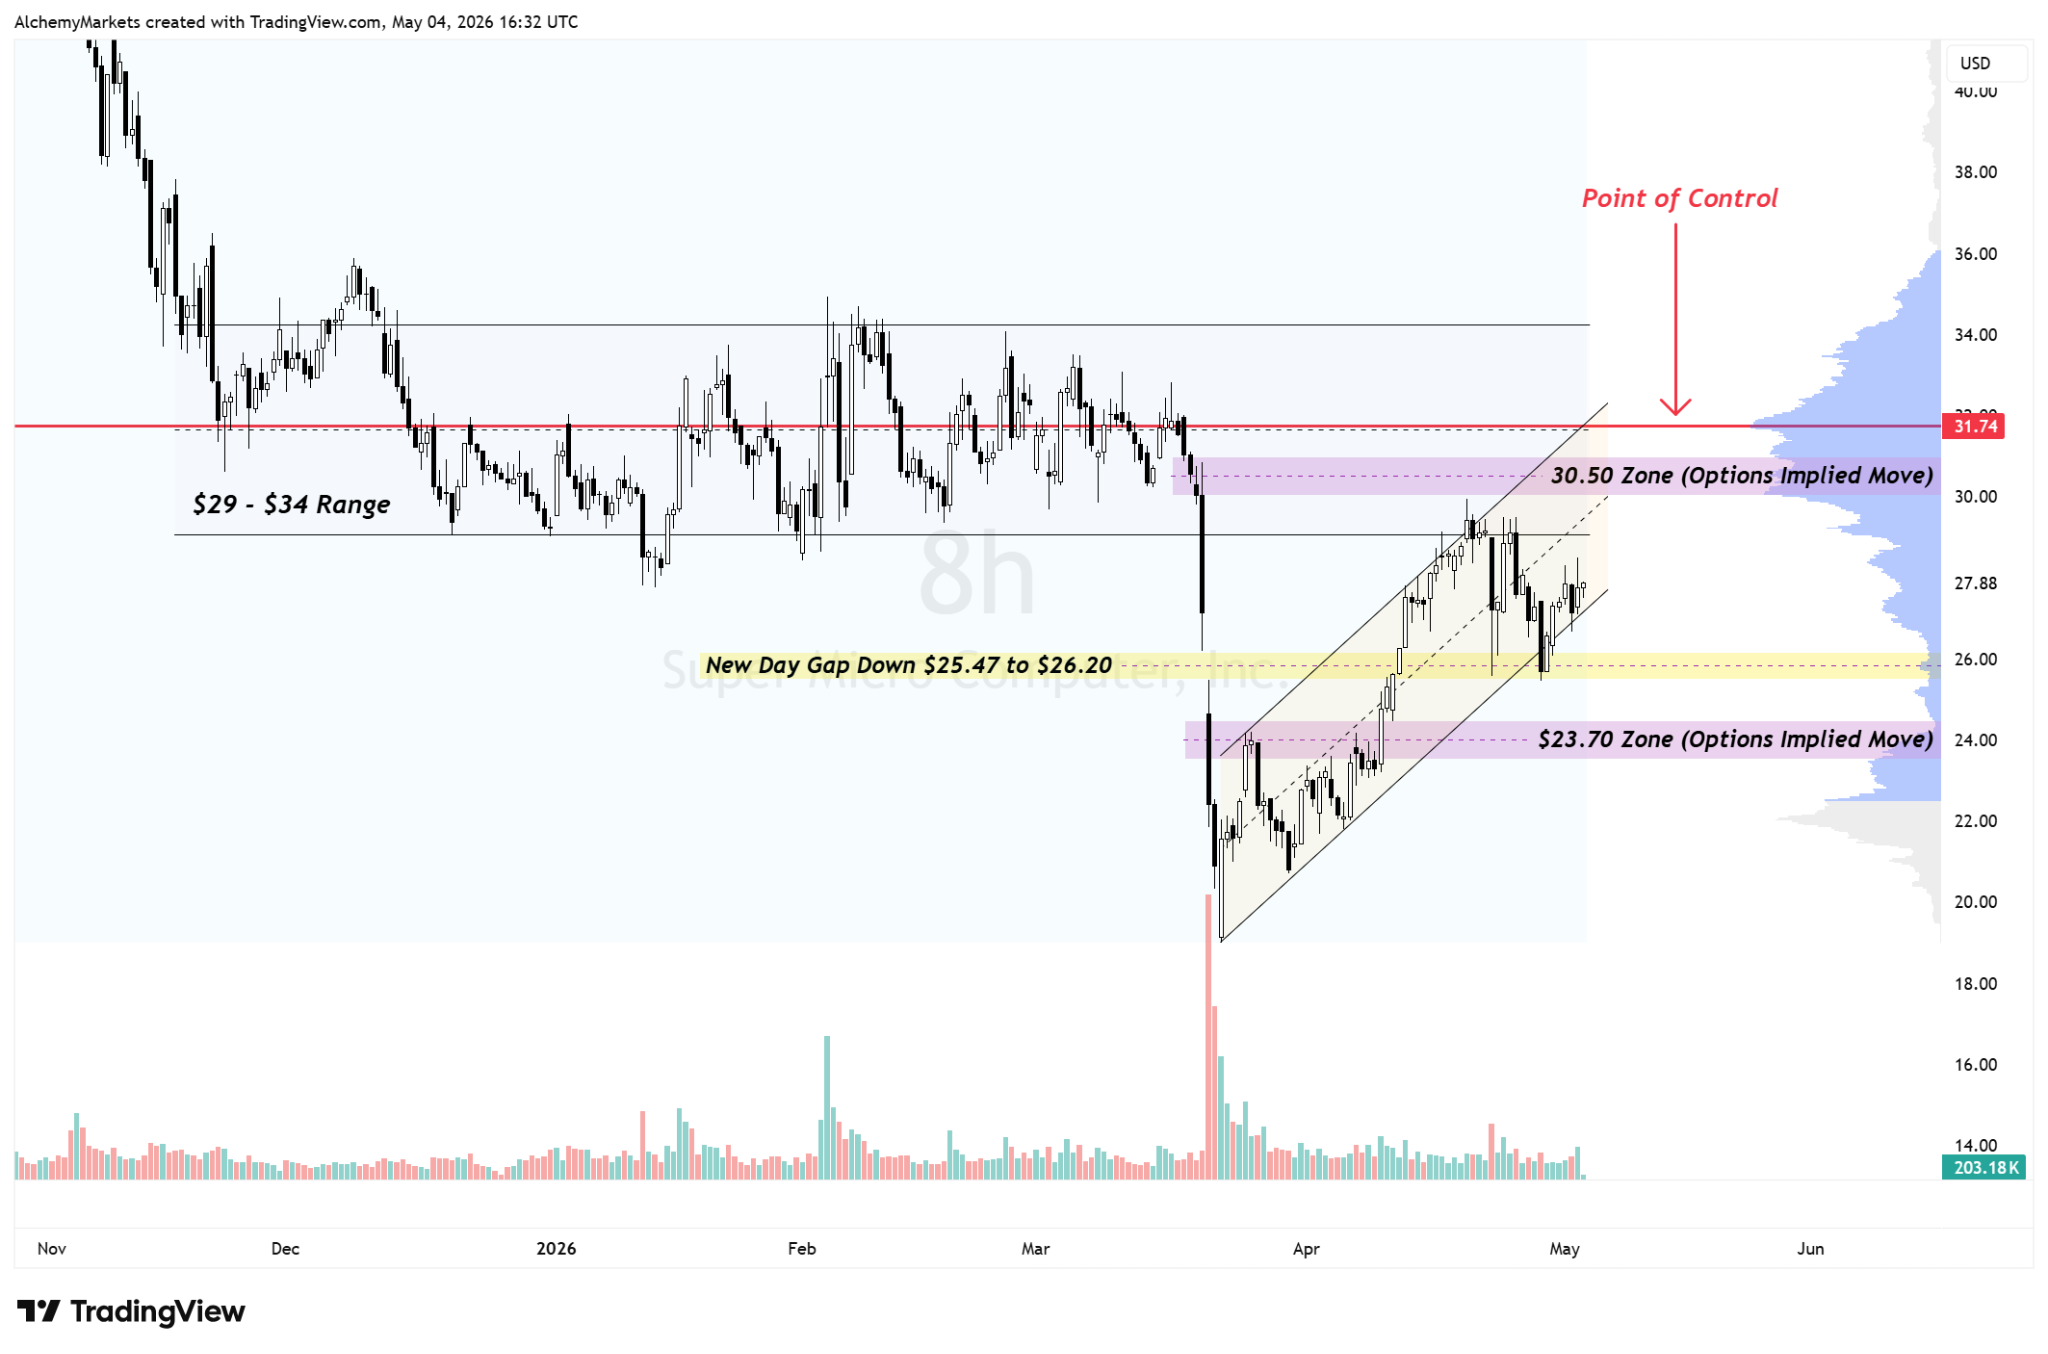
Super Micro is more interesting because the key technical level sits just above what options have already priced. The chart is still below its old $29-$34 range, while the point of control sits around $31.70-$31.74. That POC matters because it sits above the $30.50 options-implied upside range.
That makes the read very clean. A move into $30.50 would be strong, but still largely inside what the options market expected. A break above $31.70-$31.74 would be more meaningful because SMCI would be pushing beyond the implied range and trying to reclaim its old volume shelf.
SMCI setup | Level / stat | Read |
| Lower options-implied range | $23.70 | Downside benchmark if earnings disappoint |
| Gap zone | $25.47-$26.20 | First downside chart reaction area |
| Upper options-implied range | $30.50 | Upper edge of the expected move |
| POC / key resistance | $31.70-$31.74 | Stronger confirmation if reclaimed |
| Old range | $29-$34 | Range bulls need to win back |
| Short float | 16.84% | High enough to matter |
| Short interest | 86.79m shares | Potential squeeze fuel if earnings surprise |
The short-interest setup makes SMCI the more interesting squeeze candidate of the three. If earnings land well and price pushes through the POC, the move could become more than a normal post-earnings bounce. The catch is that Super Micro still needs to answer the margin question, because the market already knows AI server demand is real.
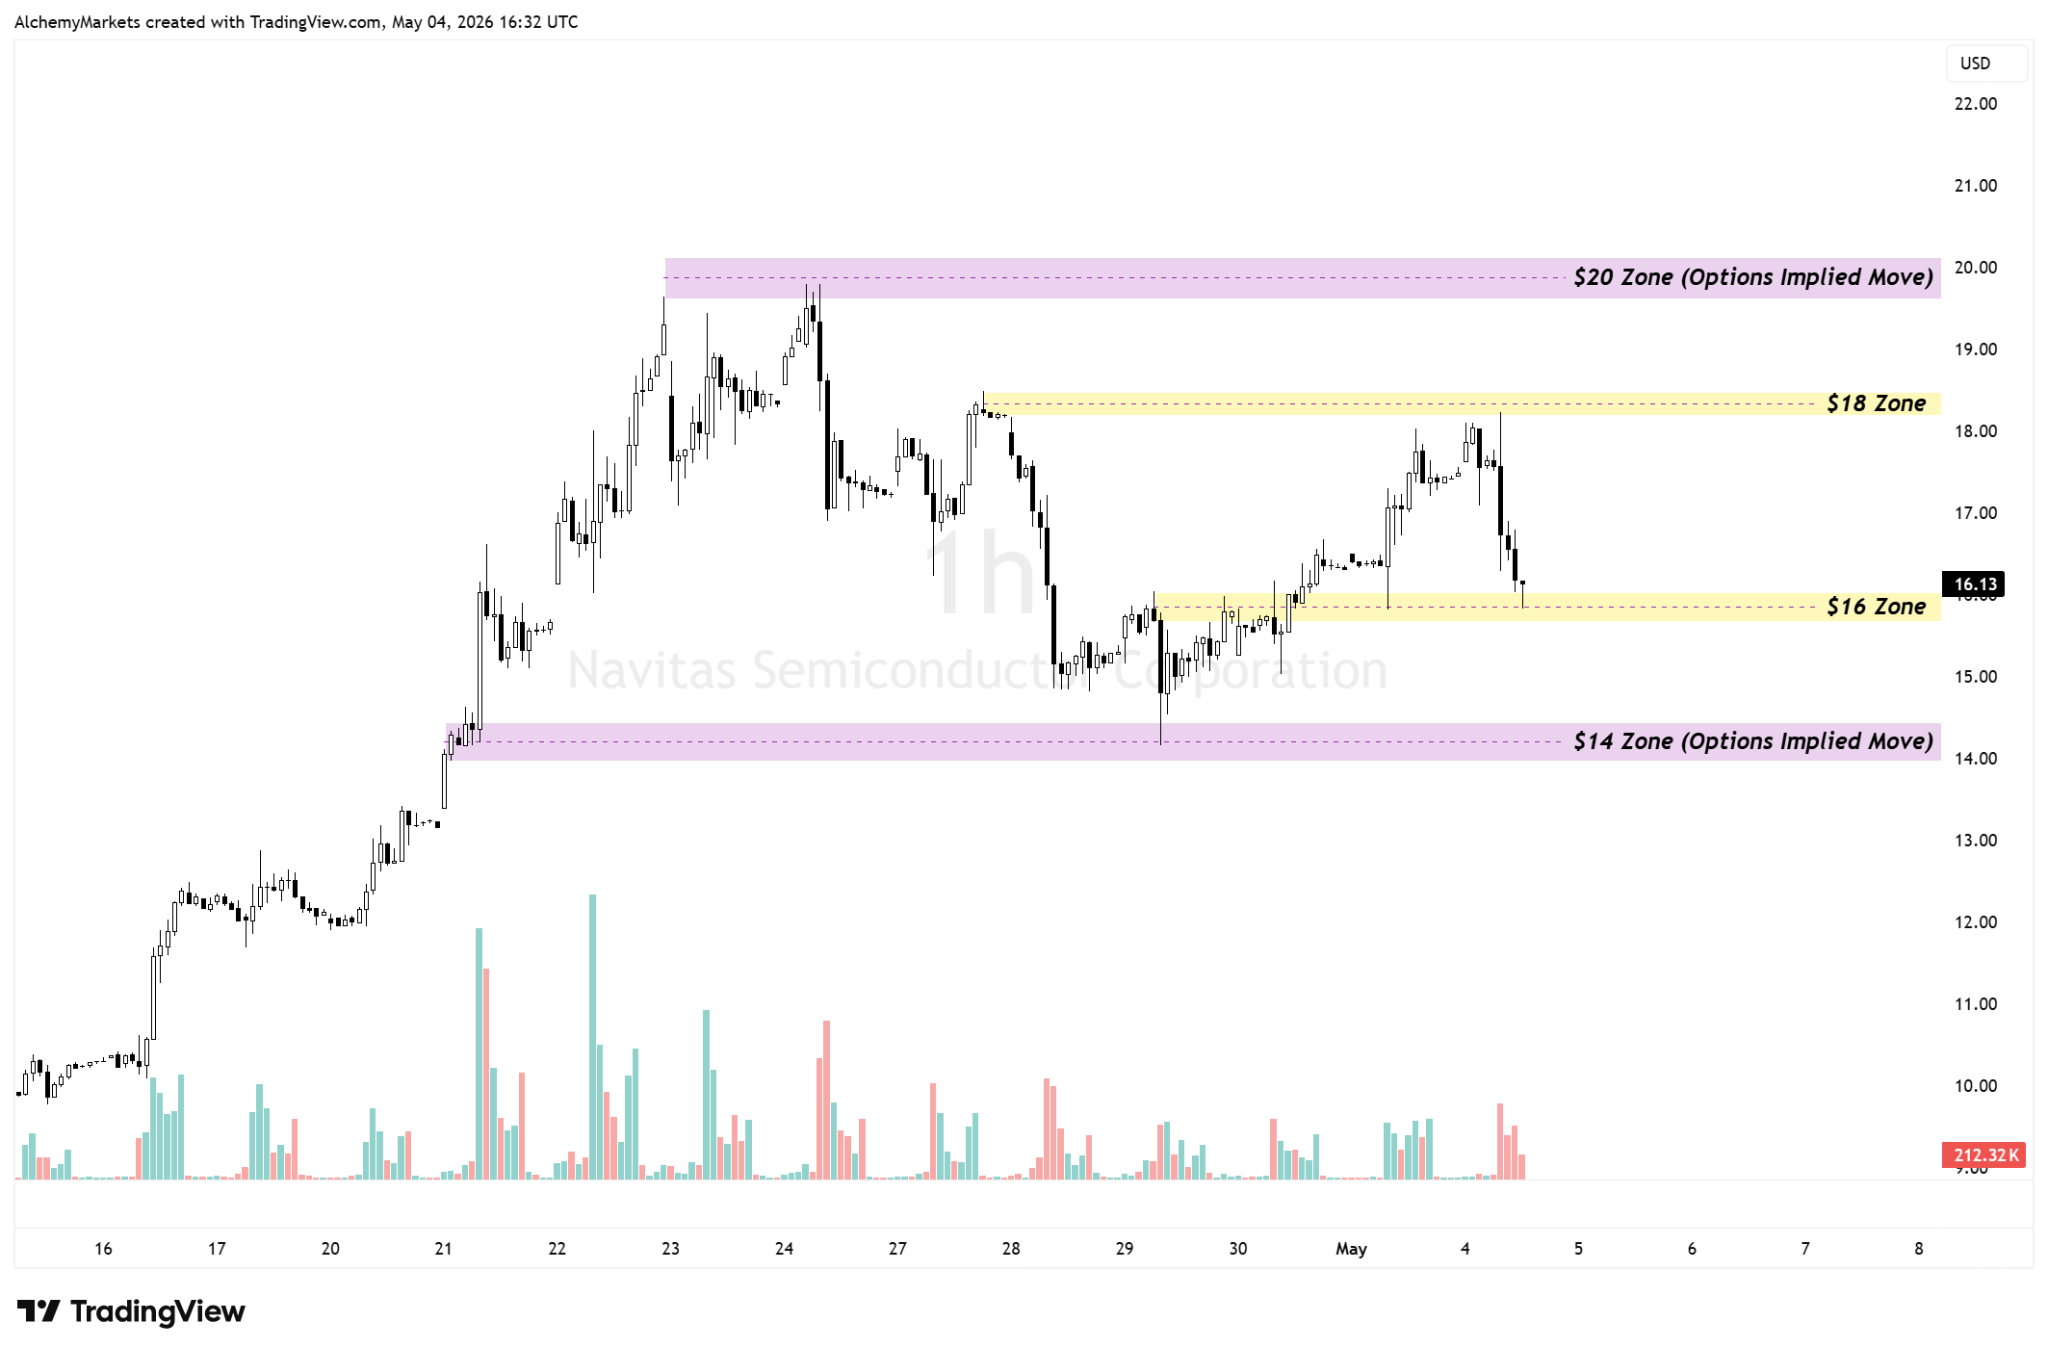
Navitas is the speculative one, and the chart is still range-based. Price is back near the $16 zone after rejecting around $18, which makes $16 the first area to watch. If it holds, the range is still alive. If it breaks, the lower options-implied range near $14.45 comes into view.
The upside is just as simple. NVTS needs to reclaim $18 before traders can talk about a stronger momentum leg. Above that, the upper options-implied range near $20.43 becomes the next benchmark.
NVTS setup | Level / stat | Read |
| Lower options-implied range | $14.45 | Downside benchmark if earnings disappoint |
| Main support zone | $16 | First chart reaction area |
| First resistance | $18 | Range level to reclaim |
| Upper options-implied range | $20.43 | Upper edge of the expected earnings-week move |
| Short float | 23.32% | Highest squeeze sensitivity of the three |
| Short interest | 48.57m shares | Can make the move violent if the update surprises |
NVTS has the most squeeze-sensitive short-interest profile, but also the least stable revenue base. That means a strong AI power-infrastructure update can squeeze hard, while a vague update can just as quickly drag the stock back into the lower end of the range.
The AI rally gets its second look after Tuesday’s U.S. close.
Last week’s earnings helped keep the AI story alive, but this week is about whether AMD, Super Micro and Navitas can back that story up with numbers and forward guidance. The options-implied ranges give us the benchmark for what the market had already priced as of May 4, 2026.
If price stays inside those ranges, the reaction may look big but still be broadly expected. If price breaks beyond them and holds, that is where the market is saying earnings were strong enough, or weak enough, to force a real repricing.
For AMD, the main test is whether price can defend $336-$340 and eventually reclaim $349.50 and $363. For SMCI, the key level is $31.70-$31.74, because it sits above the implied move and lines up with meaningful short-interest risk. For Navitas, the range is simpler: $16 support, $18 resistance and $20.43 as the upper implied range.
This week, AI earnings are the catalyst. The options market shows what was expected, the chart levels show where the reaction becomes meaningful, and short interest tells us where the move can get violent.
DISCLAIMER: For educational purposes only. Trading comes with substantial risk, leading to possible loss of your capital. Traders are advised to do their own due diligence before investing.
Alchemy Markets is a multi-asset brokerage providing retail traders with the same elite trading conditions, tools, and transparency typically reserved for institutions.
Select the categories and companies you wish to follow directly to your person rss feed.
Create Custom RSS FeedSign up and join over 5,000 professional members who receive personalized news alerts, curated professional connections, and more for free!
Retail futures trading leader NinjaTrader Group has appointed Mark Omens as Senior Vice President, Commercial Strategy, bringing a 25-year veteran of derivatives marketplace CME Group into a newly created role focused on exchange partnerships and enterprise growth.
Gold Price Action Forecast: Will XAU/USD Drop to $3930? Meta Description: Read our Gold price action forecast to see if XAU/USD will drop to $3930.
BitDelta Securities Financial Services LLC (“BitDelta Securities”) today announced that it has received full regulatory approval from the Capital Market Authority (“CMA”) of the United Arab Emirates under the Category 5 — Arrangement and Advice license framework (License No. 20200000439). The approval follows the firm's receipt of In-Principal Approval earlier this year and represents the successful conclusion of the CMA's full licensing process, including the satisfaction of capital requirements, governance appointments, and operational setup.
Crypto.com has received a $400 million strategic investment from Citadel Securities, valuing the firm at $20 billion. It marks the first institutional funding round in the company's history, aimed at accelerating its expansion into tokenised securities, derivatives and other asset classes.
WTI’s pullback into $79–82 is the first major test of the bullish Elliott Wave count, with buyers targeting a renewed break above $85.

BitDelta Securities has secured a full CMA Category 5 licence in the UAE and opened a regulated office in Business Bay, Dubai. The firm operates as an introducing broker, connecting investors with licensed international brokers across multiple asset classes, with CEO Dr. Demetrios Zamboglou commenting on the milestone.
Index volatility is asleep while single stocks fight it out underneath, credit refuses to confirm the equity rally, and a bare macro calendar hands next week to oil.
Digital assets and FX brokerage GC Exchange FZE (GCEX) has appointed Mohammed A. Mulla as a Board Member of its Dubai-based entity, part of the wider GCEX Group.
Learn what Blockchain-as-a-Service is, how it works, and why businesses are using BaaS to build blockchain applications without managing infrastructure.
CFDs vs stocks compared on leverage, ownership, costs, dividends, taxes, and risk. Learn the differences between stocks and CFDs and discover which suits your investing or trading goals.