Explore Companies BySectors & Categories
Explore Companies ByUse Cases
Explore Companies ByProducts & Services
Explore Companies ByRankings & Reviews
Featured NewsCompaniesMarketsCryptoTechRegulatoryCommentaryUKUSWorldMore

    Latest Wires

      Daily Newsletter

      LF Daily News

      Daily industry focused newsletter giving you an overview for the financial & finTech industry.

      See All Newsletters
      By clicking "Sign Up" you are agreeing to our Terms of Service and Privacy Policy

      Master Candlestick Entries: Reading Price Action at Key Levels

      Published: just now

      Master Candlestick Entries: Reading Price Action at Key Levels

      Candlesticks are the language of the market.


      Key levels are the grammar.


      When you combine the two, you finally understand what price is trying to do - not based on hope, not based on signals, not based on someone’s post on social media, but based on raw, unfiltered market behavior.


      Visual content


      This is where structure turns into execution - the same execution logic taught in guides like Mastering Price Action at Key Levels and the institutional breakdowns in Fair Value Gaps Explained.


      This module teaches you how to interpret candlesticks in context, which is exactly how they are used inside SMC concepts, liquidity sweeps, breaker structures, FVGs, order blocks, and multi-timeframe confirmation models like The Confirmation Matrix.


      This is execution - the real kind.


      Why Candlesticks Are Still the Best Chart Type (The Honest Comparison Most Beginners Never Get)


      Before diving into engulfings or wicks, we need to answer a question you probably never asked:

      Why do professional traders use candlesticks instead of line charts, Heiken Ashi, or Renko?

      Let’s break it down in real, trader-to-trader language.


      Line Chart - Clean, Simple, and Sadly Blind


      Visual content


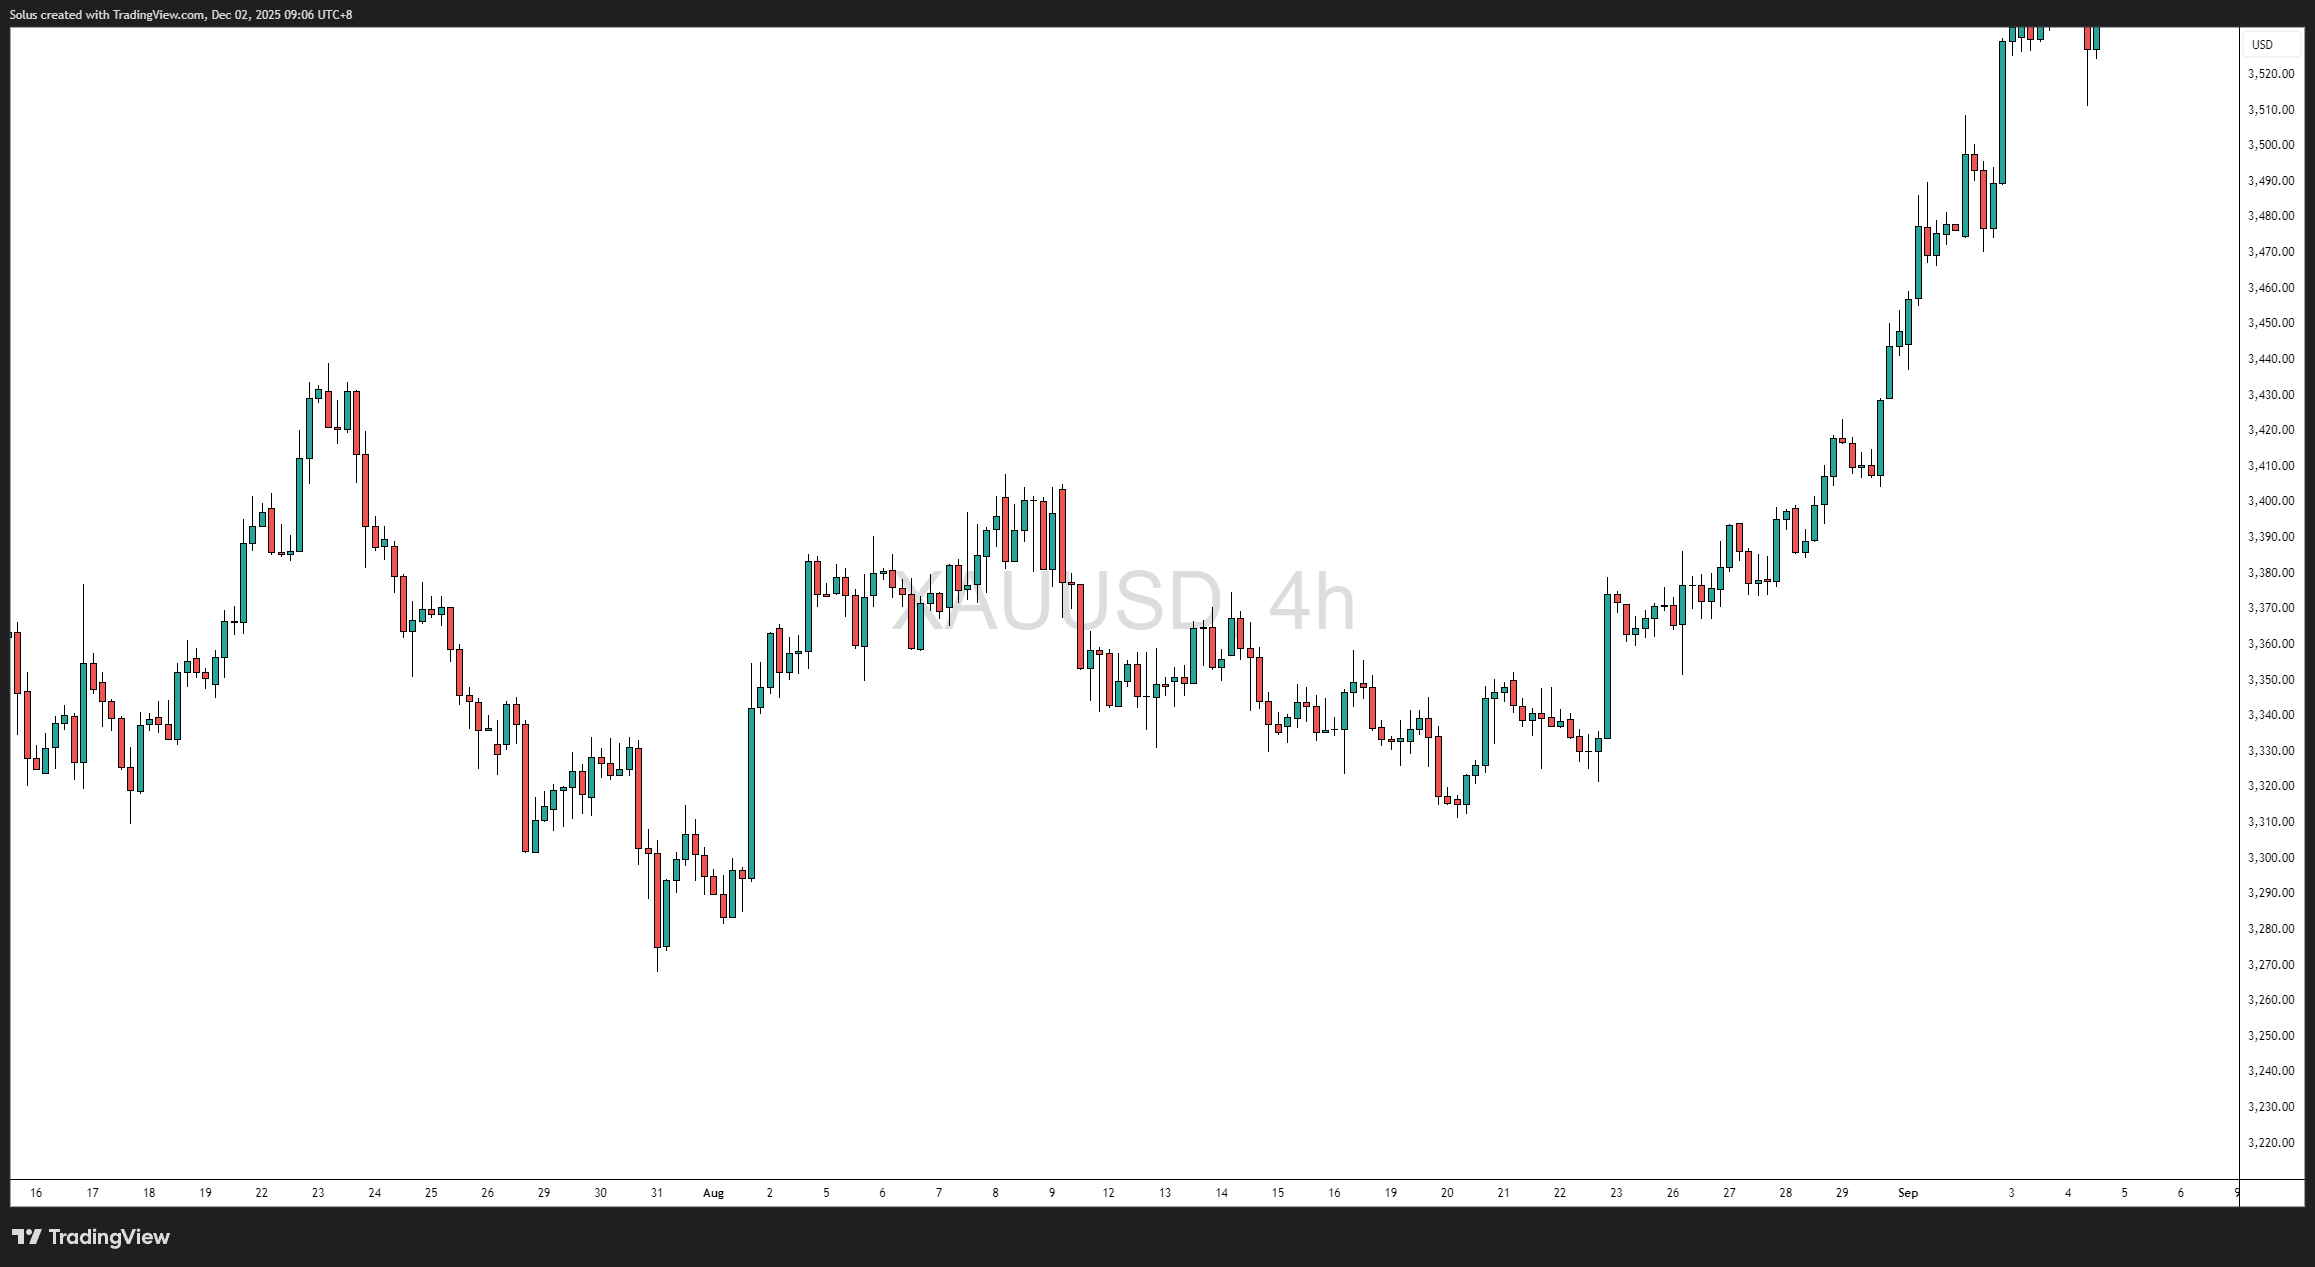
      The line chart is comforting.


      It’s clean.


      It’s minimalistic.


      It makes the market look friendlier than it actually is.


      But a line chart hides the most important information:


      • liquidity wicks
      • rejection spikes
      • stop-hunt shadows
      • engulfing takeover candles
      • displacement
      • manipulation
      • the candle that broke structure
      • the wick that swept liquidity


      A line chart will NEVER show you what smart money is doing - the core focus of guides like Why Smart Money 

      Concepts Work.


      It’s clean, yes.


      But it hides the truth.


      Heiken Ashi - Smooth Trends, Filtered Reality

      Visual content


      Heiken Ashi candles smooth out price movement by averaging data.


      They remove noise.


      They make trends look perfect.


      This is why trend traders pair them with concepts found in Moving Averages Strategy Playbook.


      But the smoothing hides the information you need for precise entries:


      • the liquidity sweep wick
      • the retest rejection
      • the micro engulfing
      • the BOS candle
      • the manipulation candle
      • the FVG creation candle


      Heiken Ashi is great for visualizing trends…


      Terrible for precision execution.


      Renko - Beautiful Structure, Horrible Timing


      Visual content


      Renko removes time.


      It builds bricks only when price moves a fixed amount.


      Renko is powerful for big-picture directional bias.


      Pairs well with concepts in How to Trade Breakouts Effectively and Swing Trading Market Basics.


      But Renko hides:


      • the rejection wick that signaled reversal
      • the breaker candle
      • the liquidity sweep
      • the displacement impulse
      • the manipulation entry candle


      Renko can help you “see the trend,”


      but it will not help you enter the trend.
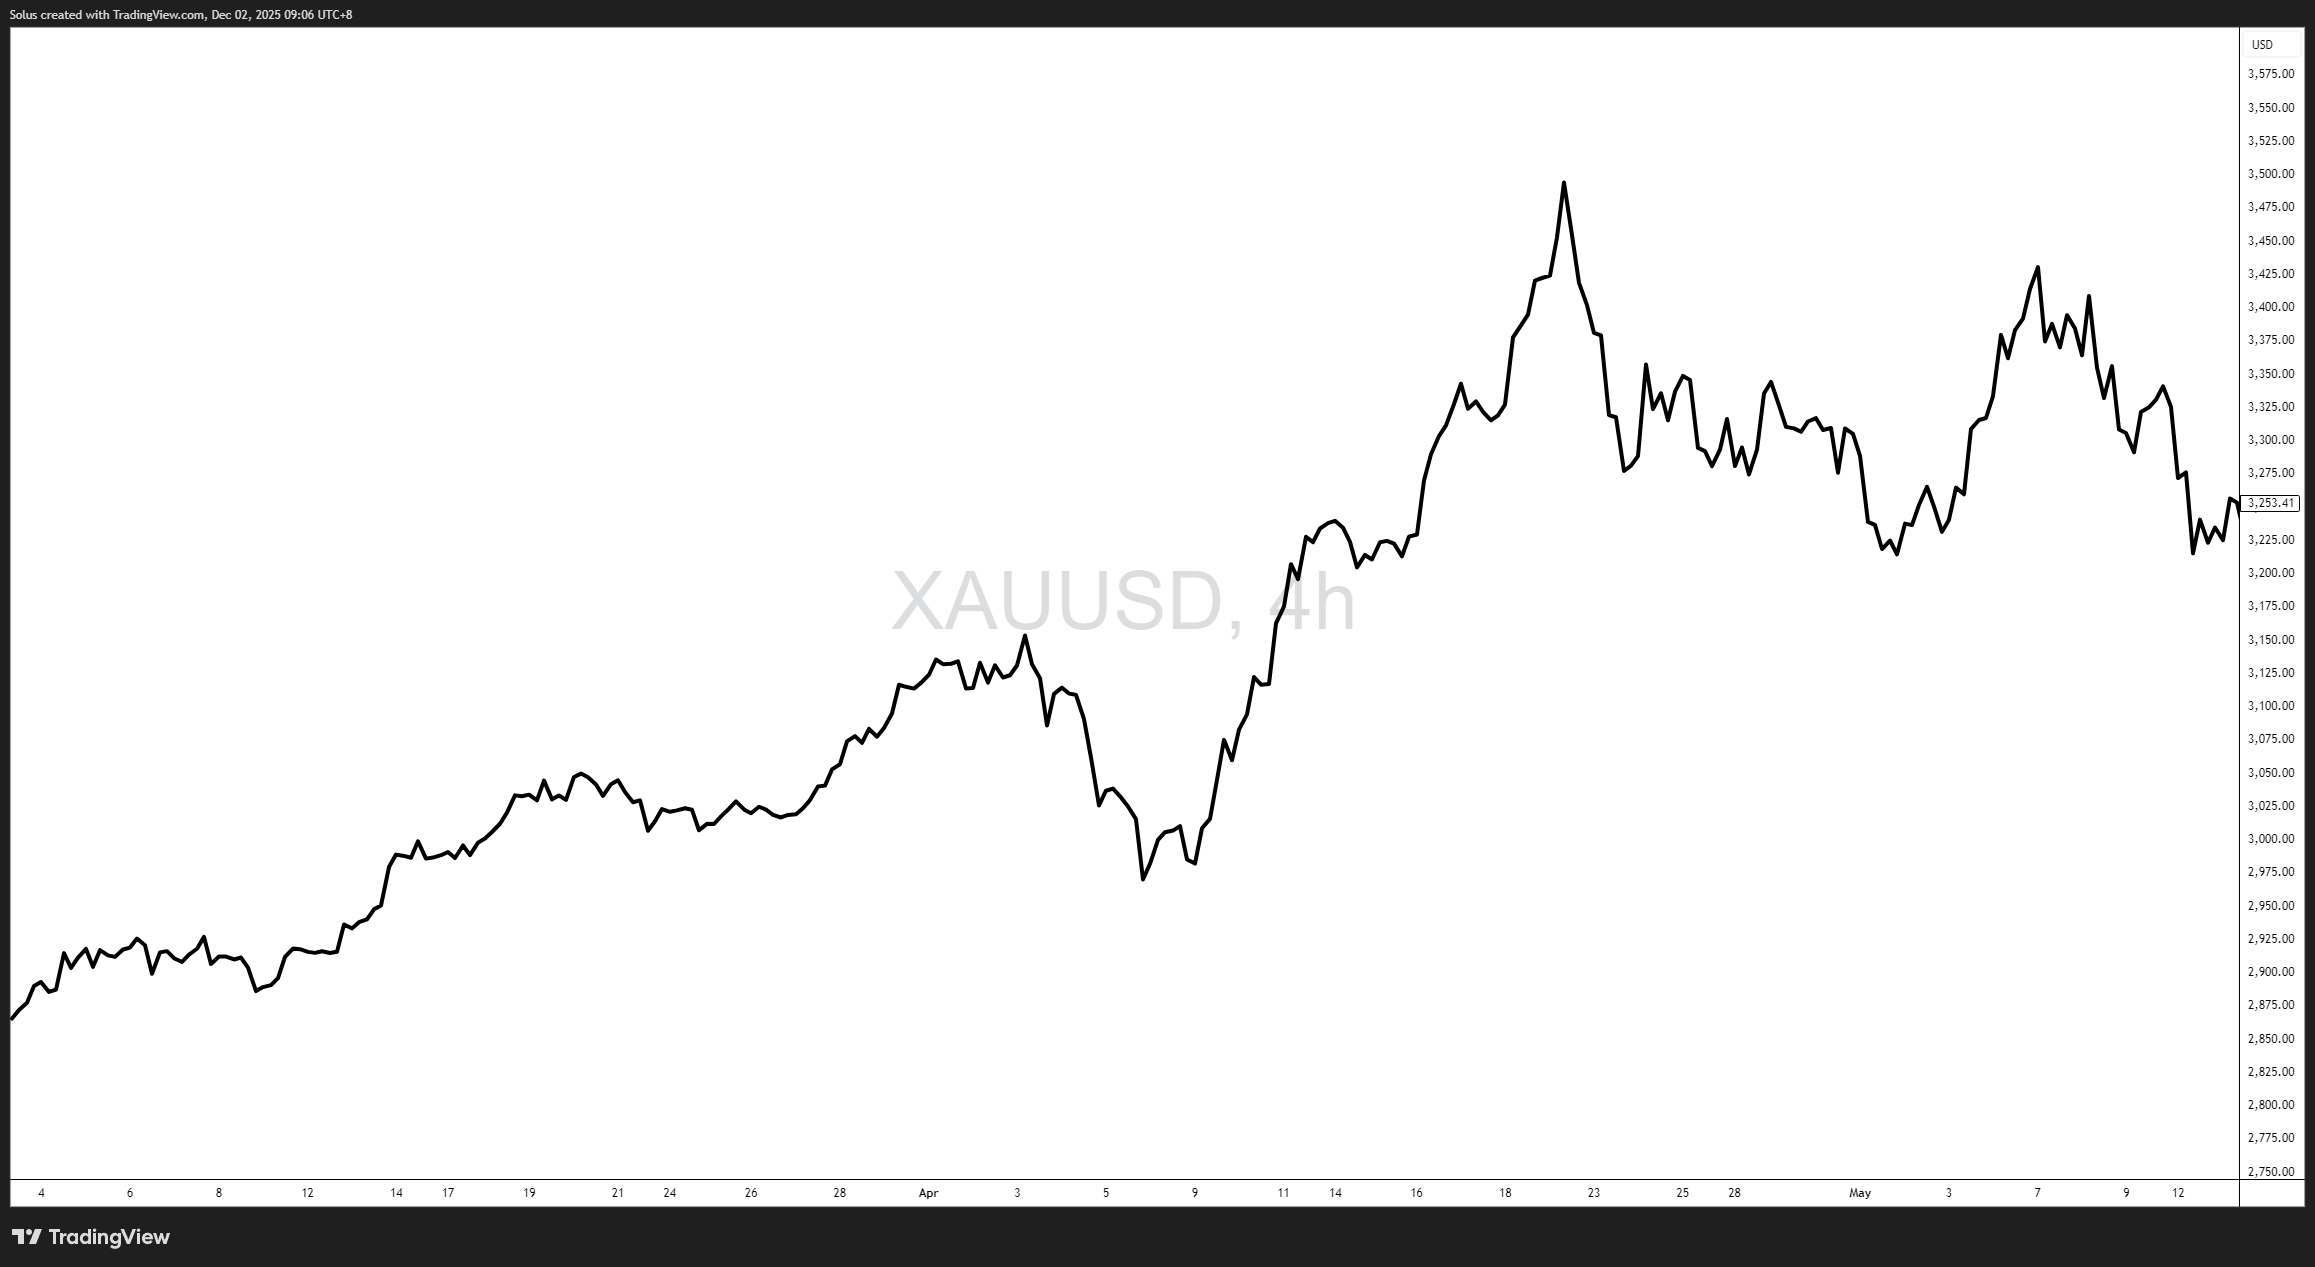
       

      Candlesticks - The Market’s Unfiltered Voice

      Visual content


      Candlesticks show:


      • where buyers stepped in
      • where sellers rejected price
      • where institutions absorbed liquidity
      • where retail got trapped
      • where displacement occurred
      • where momentum shifted
      • where manipulation happened
      • where orders sat
      • where stops were hunted


      This is why nearly every real price-action or SMC guide - from Mastering Candlestick Pattern Analysis to How to Think Like a Price Action Trader - bases its execution rules on candlesticks at key levels.


      They don’t just show data.


      They show emotion.


      They show the battle between buyers and sellers.


      The hesitation before news.


      The aggression after a sweep.


      The exhaustion before reversal.


      The manipulation before expansion.


      Candlesticks reveal the truth.


      Everything else summarizes it.


      The Execution Patterns You’ll Use (At Real Levels)


      1. Engulfing Patterns - When One Side Takes Full Control

      Visual content


      An engulfing candle wipes out the previous candle.


      It shows aggression.


      It shows intent.


      This is why engulfings often appear before or after:


      • liquidity sweeps
      • breaker flips
      • FVG creation
      • BOS / CHoCH
      • order block confirmation


      And why they show up repeatedly in SMC-based guides like Order Blocks and AMD Market Structure and The Confirmation Model.


      An engulfing at a key level is not a pattern.


      It’s a data point of control.


      2. Rejection Wicks - When Price Says “No.”


      Visual content


      A long wick is a message.


      Price tapped a level…


      one side rejected it aggressively…


      and sentiment flipped instantly.


      Rejection wicks reveal:


      • liquidity takers
      • failed breakouts
      • manipulations
      • absorption zones
      • stop-hunts
      • institutional reaction points


      These are the exact behaviors taught in Mastering Price Action at Key Levels.


      Wicks are truth-tellers.


      3. Breaker Candles - The Market Fakes You Out, Then Flips

      Visual content

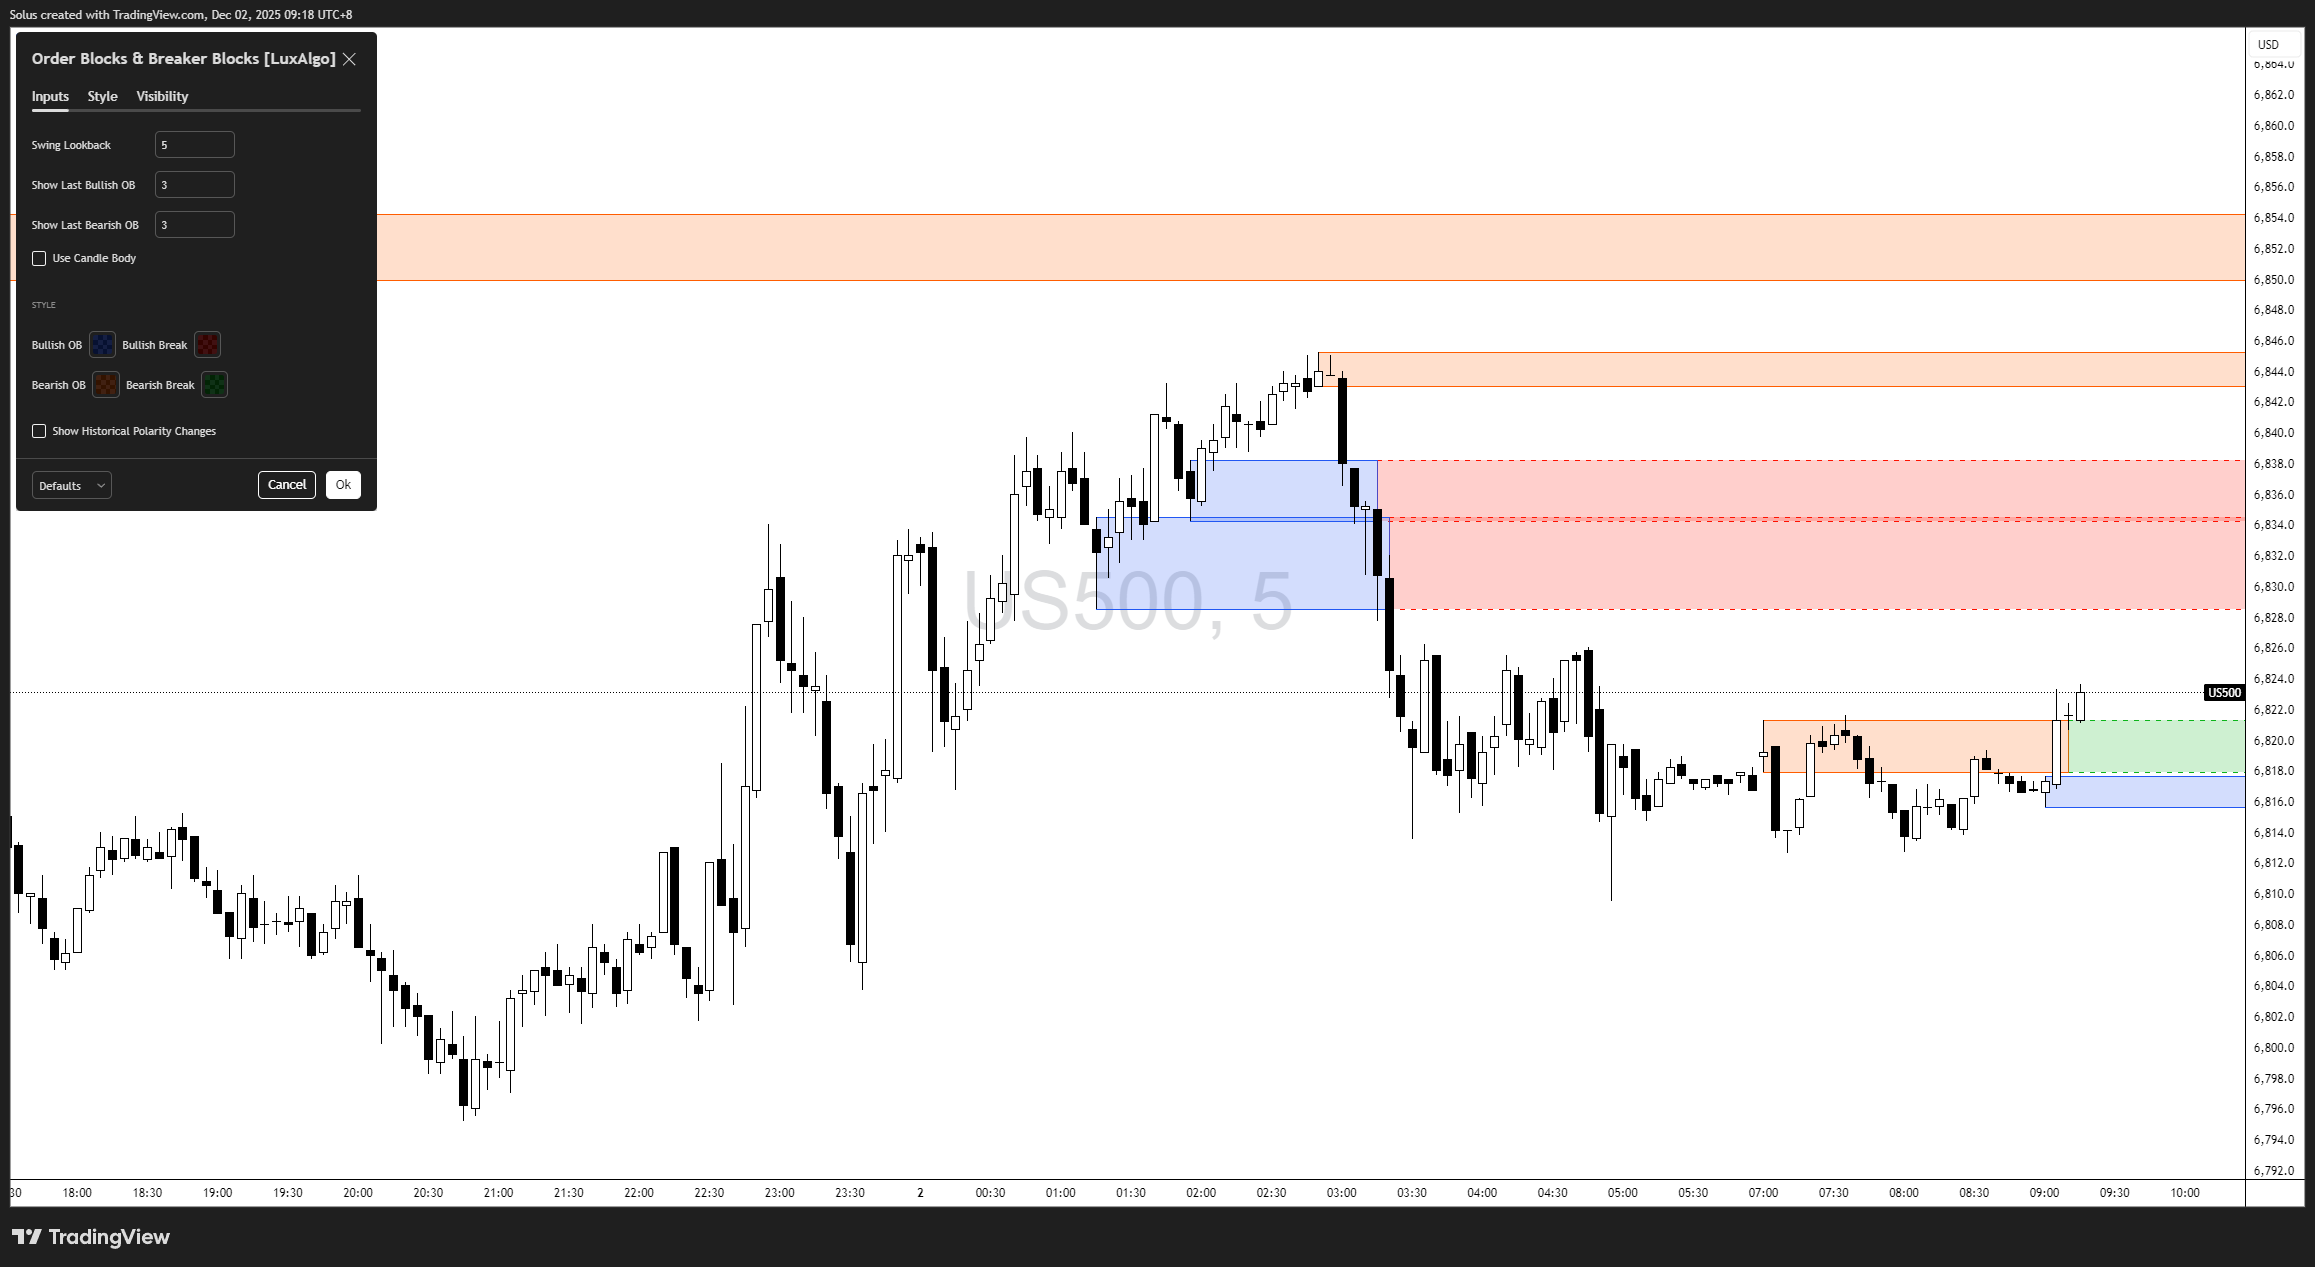
      A breaker is institutional trickery at its finest.


      Price “breaks” a structure, retail traders jump in, price reverses, their stops become liquidity.


      This is why breaker behavior is deeply tied with the concepts behind Anatomy of a Valid Order Block.


      A breaker isn’t just a reversal.


      It’s a trap.


      4. Inside Bars & Outside Bars - Pressure and Release

      Inside bar = the calm.

      Visual content


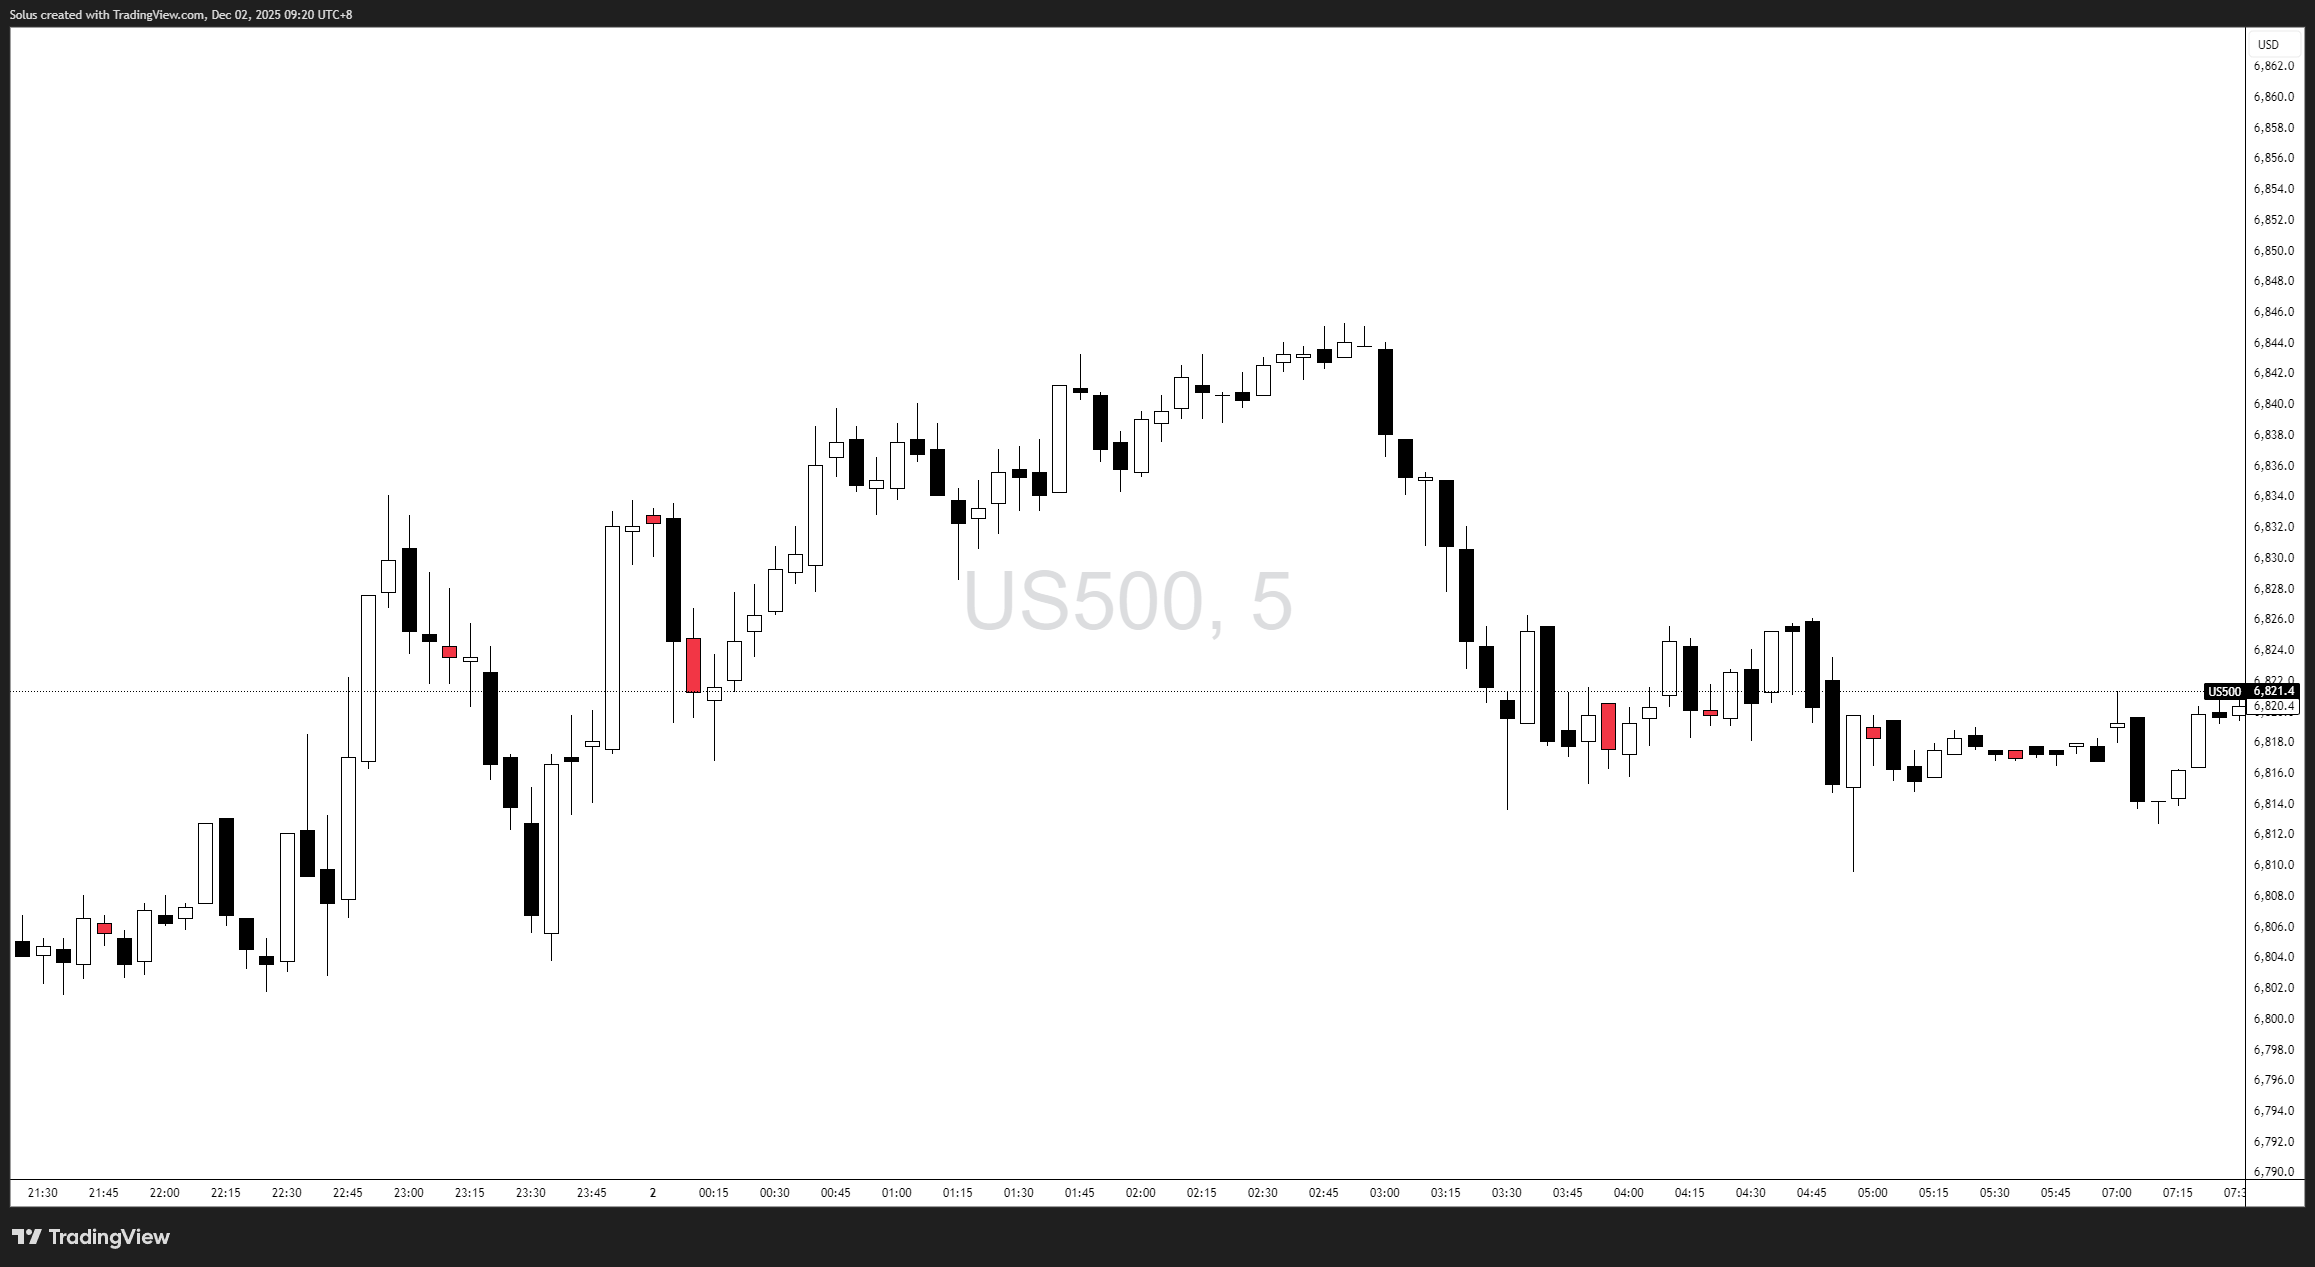
      Outside bar = the explosion.


      Visual content


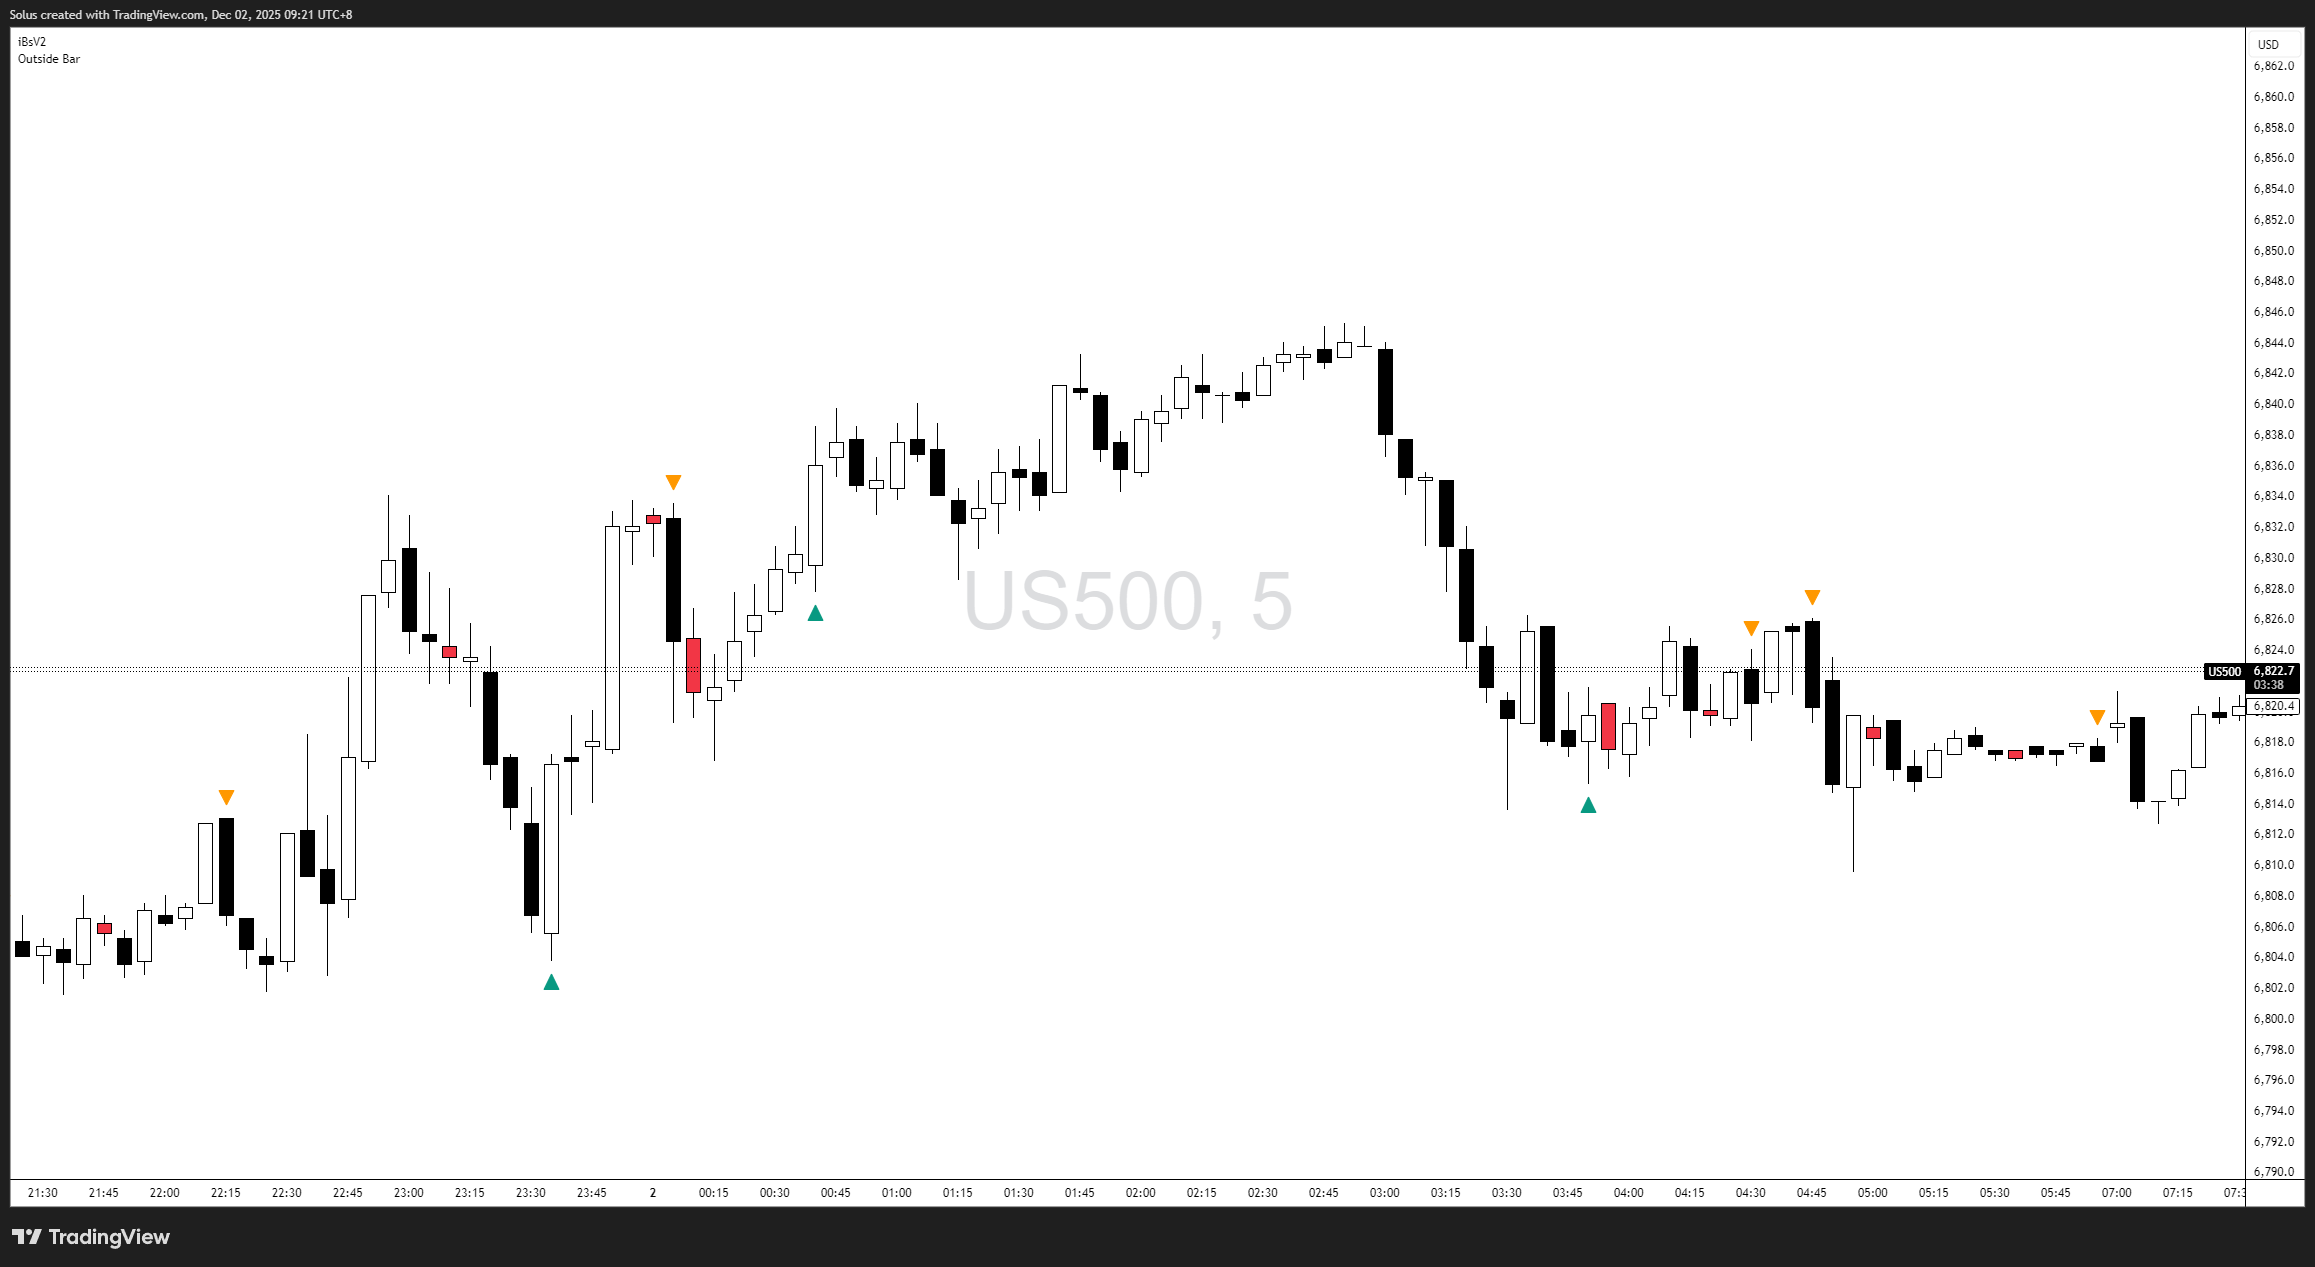
      You see these constantly before news-driven displacement, explained in guides like:


      Inside bars = compression.

      Outside bars = expansion.

      Learn them, and volatility stops surprising you.


      All the Candlestick Patterns (Mentioned Only - No Need to Memorize)


      Here are the classic patterns you’ll see in books and online:


      Visual content
      Source: Wikihow


      • Doji
      • Hammer
      • Shooting Star
      • Engulfing
      • Inside Bar
      • Outside Bar
      • Tweezer Top / Bottom
      • Morning Star / Evening Star
      • Harami
      • Piercing Line
      • Dark Cloud Cover
      • Dragonfly Doji
      • Gravestone Doji
      • Spinning Top
      • Marubozu
      • Three Black Crows
      • Three White Soldiers
      • Hanging Man
      • Inverted Hammer


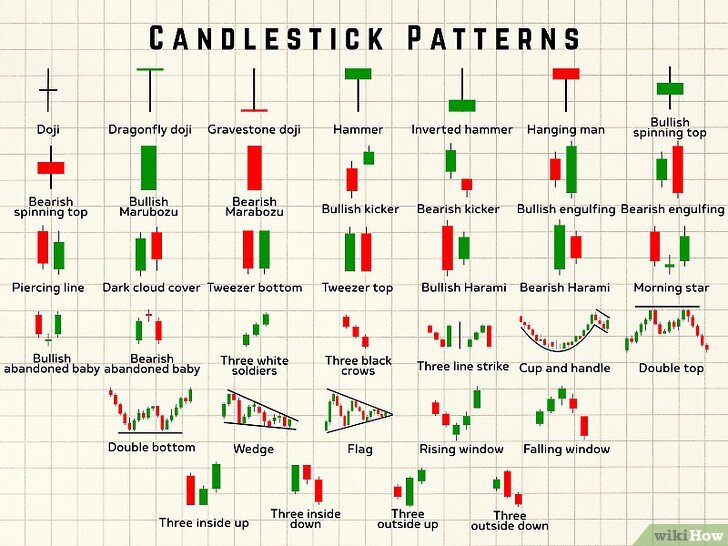
      Now here’s the truth:


      You don’t need to memorize ANY of them to trade profitably.


      Nearly all high-probability execution comes from just four:

      • Engulfings
      • Rejection Wicks
      • Breaker Candles
      • Inside Bars


      Why?


      Because when placed at the right level,


      these patterns reveal liquidity, manipulation, and intent - the core of Smart Money Concepts.

      Don’t be a candlestick encyclopedia.


      Be a price interpreter.


      Momentum: The Candle Shows It Before the Indicator Does

      Visual content


      Momentum reveals itself visually long before an indicator reacts:


      • thick candle bodies
      • consecutive direction candles
      • tiny pullbacks
      • strong displacement
      • fresh FVG creation
      • fast reactions after sweeps


      These behaviors form the foundation of guides like Ultimate Guide to Market Trends & Price Action and Flow State Trading.


      Indicators lag.


      Candles lead.


      Final Thoughts - This Is Where Trading Becomes Real


      This module is the first one that teaches you to execute.


      To stop guessing.


      To stop reacting emotionally.


      To start reading the story price is telling.


      When you understand candlesticks at key levels:


      • confidence rises
      • confusion fades
      • clarity sharpens
      • hesitation drops
      • discipline becomes easier
      • execution becomes cleaner


      You don’t need 20 indicators.


      You don’t need 30 patterns.


      You don’t need predictions.


      You only need:


      Candles + Key Levels + Context.


      This is the foundation of professional trading - in Forex, Gold, Indices, and every market you’ll ever trade.


      FAQs


      1. What makes a candlestick pattern “valid”?

      A candlestick becomes valid only when it forms at the right location - near liquidity, imbalance, order blocks, or major support/resistance. An engulfing pattern in the middle of nowhere is just noise. The same pattern at a key level becomes a high-probability signal. This is why guides like Mastering Price Action at Key Levels emphasize context over memorization.


      2. Are candlestick patterns reliable without indicators?

      Yes - and often more reliable. Indicators lag, but candlesticks reveal buyers vs sellers in real time. When combined with clean structure or liquidity concepts (like in Fair Value Gaps Explained), candlesticks become one of the clearest ways to confirm execution.


      3. What if two candlestick patterns appear together - which one should I trust?

      Trust the one that aligns with direction, momentum, and the higher timeframe bias.


      For example:

      An engulfing pattern against the trend is weaker

      A rejection wick aligned with higher timeframe direction is stronger

      This is why multi-timeframe clarity matters, as taught in The Power of Multi-Timeframe Analysis.


      4. How do I avoid false signals at key levels?

      Wait for confirmation - not just the first candle that touches a level.


      Confirmation can be:


      A sweep followed by a strong close

      A clean engulfing

      A breaker candle flipping structure

      A retest of the zone

      If you want a full confirmation framework, use the structure in The Confirmation Model: OB + FVG + Liquidity Sweep.


      5. How do I practice reading candlesticks faster?

      Instead of memorizing 30+ patterns, choose one core pattern - such as engulfings or rejection wicks - and mark 30 examples at real levels, as the exercise suggests.


      You can speed this up with backtesting software using the **Forex Tester program.**

      Repetition builds recognition - which builds confidence.


      Start Trading Live!

      • Trade forex, indices, gold, and more
      • Access ACY, MT4, MT5, & Copy Trading Platforms


      It’s time to go from theory to execution!

      Create an Account. Start Your Live Trading Now!


      Check Out My Contents:


      Beginners Path


      Strategies That You Can Use

      Looking for step-by-step approaches you can plug straight into the charts? Start here:


      Indicators / Tools for Trading

      Sharpen your edge with proven tools and frameworks:


      How To Trade News

      News moves markets fast. Learn how to keep pace with SMC-based playbooks:


      Learn How to Trade US Indices

      From NASDAQ opens to DAX trends, here’s how to approach indices like a pro:


      How to Start Trading Gold

      Gold remains one of the most traded assets - here’s how to approach it with confidence:


      How to Trade Japanese Candlesticks

      Candlesticks are the building blocks of price action. Master the most powerful ones:


      How to Start Day Trading

      Ready to go intraday? Here’s how to build consistency step by step:


      Swing Trading 101


      Learn how to navigate yourself in times of turmoil

      Markets swing between calm and chaos. Learn to read risk-on vs risk-off like a pro:


      Want to learn how to trade like the Smart Money?

      Step inside the playbook of institutional traders with SMC concepts explained:


      Master the World’s Most Popular Forex Pairs

      Forex pairs aren’t created equal - some are stable, some are volatile, others tied to commodities or sessions.


      Metals Trading


      Stop Hunting 101

      If you’ve ever been stopped out right before the market reverses - this is why:


      Trading Psychology

      Mindset is the deciding factor between growth and blowups. Explore these essentials:


      Market Drivers


      Risk Management

      The real edge in trading isn’t strategy - it’s how you protect your capital:


      Suggested Learning Path

      If you’re not sure where to start, follow this roadmap:


      1. 1. Start with Trading Psychology → Build the mindset first.
      2. 2. Move into Risk Management → Learn how to protect capital.
      3. 3. Explore Strategies & Tools → Candlesticks, Fibonacci, MAs, Indicators.
      4. 4. Apply to Assets → Gold, Indices, Forex sessions.
      5. 5. Advance to Smart Money Concepts (SMC) → Learn how institutions trade.
      6. 6. Specialize → Stop Hunts, News Trading, Turmoil Navigation.


      This way, you’ll grow from foundation → application → mastery, instead of jumping around randomly.


      Follow me for more daily market insights!

      Jasper Osita - LinkedIn - FXStreet - YouTube


      This content may have been written by a third party. ACY makes no representation or warranty and assumes no liability as to the accuracy or completeness of the information provided, nor any loss arising from any investment based on a recommendation, forecast or other information supplies by any third-party. This content is information only, and does not constitute financial, investment or other advice on which you can rely.

      ACY Securities is one of Australia's fastest growing multi-asset online trading providers, offering ultra-low-cost trading, rock-solid execution, technologically superior account management and premium market analysis.

      This content may have been written by a third party. LiquidityFinder makes no representation or warranty and assumes no liability as to the accuracy or completeness of the information provided, nor any loss arising from any investment based on a recommendation, forecast or other information supplies by any third-party. This content is information only, and does not constitute financial, investment or other advice on which you can rely.
      Comments
      Most Recent
      Written By
      Daily Newsletter

      LF Daily News

      Daily industry focused newsletter giving you an overview for the financial & finTech industry.

      See All Newsletters
      By clicking "Sign Up" you are agreeing to our Terms of Service and Privacy Policy
      RSS Feeds

      Create a custom RSS Feed

      Select the categories and companies you wish to follow directly to your person rss feed.

      Create Custom RSS Feed

      Related Categories:

      Related Tags:

      #CandlestickAnalysis#PriceAction#SmartMoneyConcepts#TechnicalAnalysis#KeyLevels#LiquiditySweeps#FairValueGaps

      Related Articles:

      Find The Right Partners for
      Your Trading Business

      Sign up and join over 5,000 professional members who receive personalized news alerts, curated professional connections, and more for free!

      Sign Up with LinkedIn
      Create Your FREE Account
      Get access to latest news, updates, real-time data, brokerage and trading firm insights and customized information feeds.

      NVDA enters tonight's $5.7T print with a stacked deck against it — the bear case needs only one leg to break, the bull case needs all three to clear elevated whispers.

      just now

      dxFeed has integrated Kalshi, a CFTC-regulated prediction market exchange, into its Event-Based Contracts Market Data Feed, offering real-time data on binary outcome markets.

      just now

      MEXC reports a sharp increase in traditional finance futures trading, with AI semiconductor assets leading the surge. The platform highlights how crypto exchanges are becoming a preferred route for users to gain exposure to TradFi markets, offering zero fees and stablecoin settlement.

      just now

      Bitget Wallet has integrated xStocks, expanding its tokenised equities and RWA offering to over 300 assets for its 90 million users. The move provides self-custodial access to tokenised stocks, ETFs, and commodities, alongside cryptocurrencies, with low fees and gasless execution.

      just now

      MARKET REPORT UK jobs data adds to GBP uncertainty ahead of tomorrow's CPI To talk to us about your next trade, call 020 7778 7500 or hit the button below Email us   USD falls for the first time…

      Image for UK jobs data adds to GBP uncertainty ahead of tomorrow's CPI
      just now

      Market drivers and catalysts Equities:  US stocks were mixed, Europe rose on energy and de-escalation hopes, while Asia struggled with oil and yields. Volatility:  VIX eases, bond yields ele…

      Image for Market Quick Take – 19 May 2026
      just now

      LiquidityMatch LLC, the parent company of FXSpotStream, has launched RateStream LLC, a dedicated streaming solution for the Fixed Income markets that applies the commercial model that transformed FX trading over the past decade to one of the largest and most actively traded markets in the world.

      just now

      This is a breakdown how the market is being driven by a collision between human psychology, institutional trading traps, and macroeconomic reality.

      just now

      Yes, a cloud-based trade copier can be significantly more flexible than a traditional VPS-based setup, especially for traders or signal providers managing multiple accounts across different platforms.…

      Image for How does a modern, cloud-based trade copier differ from traditional VPS-based trade copiers?
      just now

      FOMC minutes, PMI data, drone strikes in the Gulf — May 2026 is not as calm as it looks. What broker dealing desks should be watching this week, and why the brokers who survived April had one thing in common.

      just now

      Abu Dhabi Global Market (ADGM) announced a robust start to 2026, with Assets Under Management (AUM) growing by 57% and active licences surpassing 13,000. The international financial centre continues to attract global asset managers and financial institutions, reinforcing its status as a leading hub in the MEASA region.

      just now

      EUR/USD could be gearing up for a major breakout toward 1.20 as stagflation risks, Fed policy shifts, and a bullish flag pattern align in the FX market.

      just now

      Discover the latest Gold XAU/USD trade ideas. Will the upcoming FOMC Minutes trigger a breakout or just more sideways action?

      just now

      Market drivers and catalysts Equities:  US and European stocks fell as yields and oil rose, Asia weakened, with Korea’s chip rally hitting a wall. Currencies:  The US dollar rallies broadly…

      Image for Market Quick Take – 18 May 2026
      just now

      MARKET REPORT Sterling suffers worst week since November 2024 as political crisis deepens To talk to us about your next trade, call 020 7778 7500 or hit the button below Email us   USD delivers i…

      Image for Sterling suffers worst week since November 2024 as political crisis deepens
      just now

      🇸🇬 Singapore doesn't do noise. Finance Magnates Singapore Summit 2026 was exactly that — concentrated, serious, and the kind of room where every conversation counts. The APAC market is a different b…

      just now

      For years, self-managed super funds (SMSFs) have been heavily invested in shares, property, and cash. However, that is now changing as a growing number of Australian retirement investors are adding Bi…

      Image for Bitcoin in SMSFs: Why Australian Retirement Investors Are Allocating to Crypto in 2026
      just now

      Upcomers, a fast-growing prop trading firm, has partnered with cTrader to bring its clients a premium trading platform shaped around the way traders of all experience levels think, act and grow. …

      Image for Upcomers adds cTrader to foster a transparent trading environment and help traders succeed
      just now

      MARKET REPORT UK political uncertainty builds as USD extends gains To talk to us about your next trade, call 020 7778 7500 or hit the button below Email us   USD extends its winning streak to fou…

      Image for UK political uncertainty builds as USD extends gains
      just now

      Markets are ending the week in full euphoria mode. The S&P 500 and Nasdaq hit fresh record highs as investors continue piling into AI stocks despite rising inflation, surging bond yields and escal…

      just now
      Feed