just now

Liquidity Finder Ltd is incorporated in England and Wales, company number 10610740, registered address 167-169 Great Portland Street, Fifth Floor, London W1W 5PF, United Kingdom.
Published: just now

GDP revised to 3.3% fuels growth optimism, while Core PCE inflation at 0.3% keeps Fed cautious ahead of September.
The NASDAQ 100 Price is trading near its recent highs as investors weigh two critical macro drivers: a stronger U.S. growth outlook and sticky inflation. The index has rebounded from the 22,700 low, reclaiming levels near 23,700, which is now acting as near-term resistance.
The macro backdrop is mixed. On one hand, GDP growth was revised up to 3.3% in Q2, powered by AI-related capital expenditure and robust consumer demand. On the other, the Core PCE Price Index—the Fed’s preferred inflation gauge—remains at 0.3% MoM (2.8% YoY), underscoring that inflation progress remains slow.
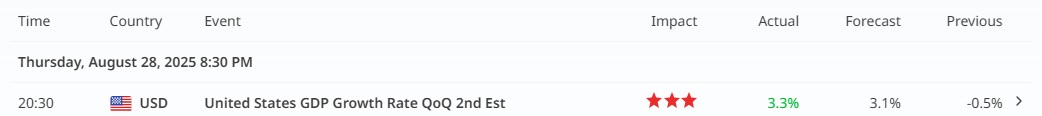
The upgraded GDP reading signals a stronger economy than previously estimated. With AI, cloud, and software investment leading the charge, NASDAQ 100 Price gains have fundamental support. Tech-heavy components stand to benefit directly from this growth narrative.
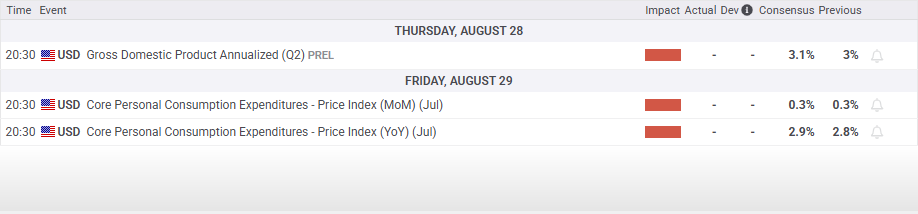
Inflation forecast remains steady at 0.3%, keeping the year-over-year rate at 2.8%. This stability gives the Fed little room to declare victory. Unless, numbers would turn a different direction in its release later on.For the NASDAQ 100 Price, sticky inflation risks temper valuations, especially in growth-driven stocks.
A rising GDP strengthens earnings momentum, while a stable but elevated Core PCE complicates Fed policy. Together, they create a “growth vs. inflation” dilemma that shapes how NASDAQ 100 Price will move in the weeks ahead.
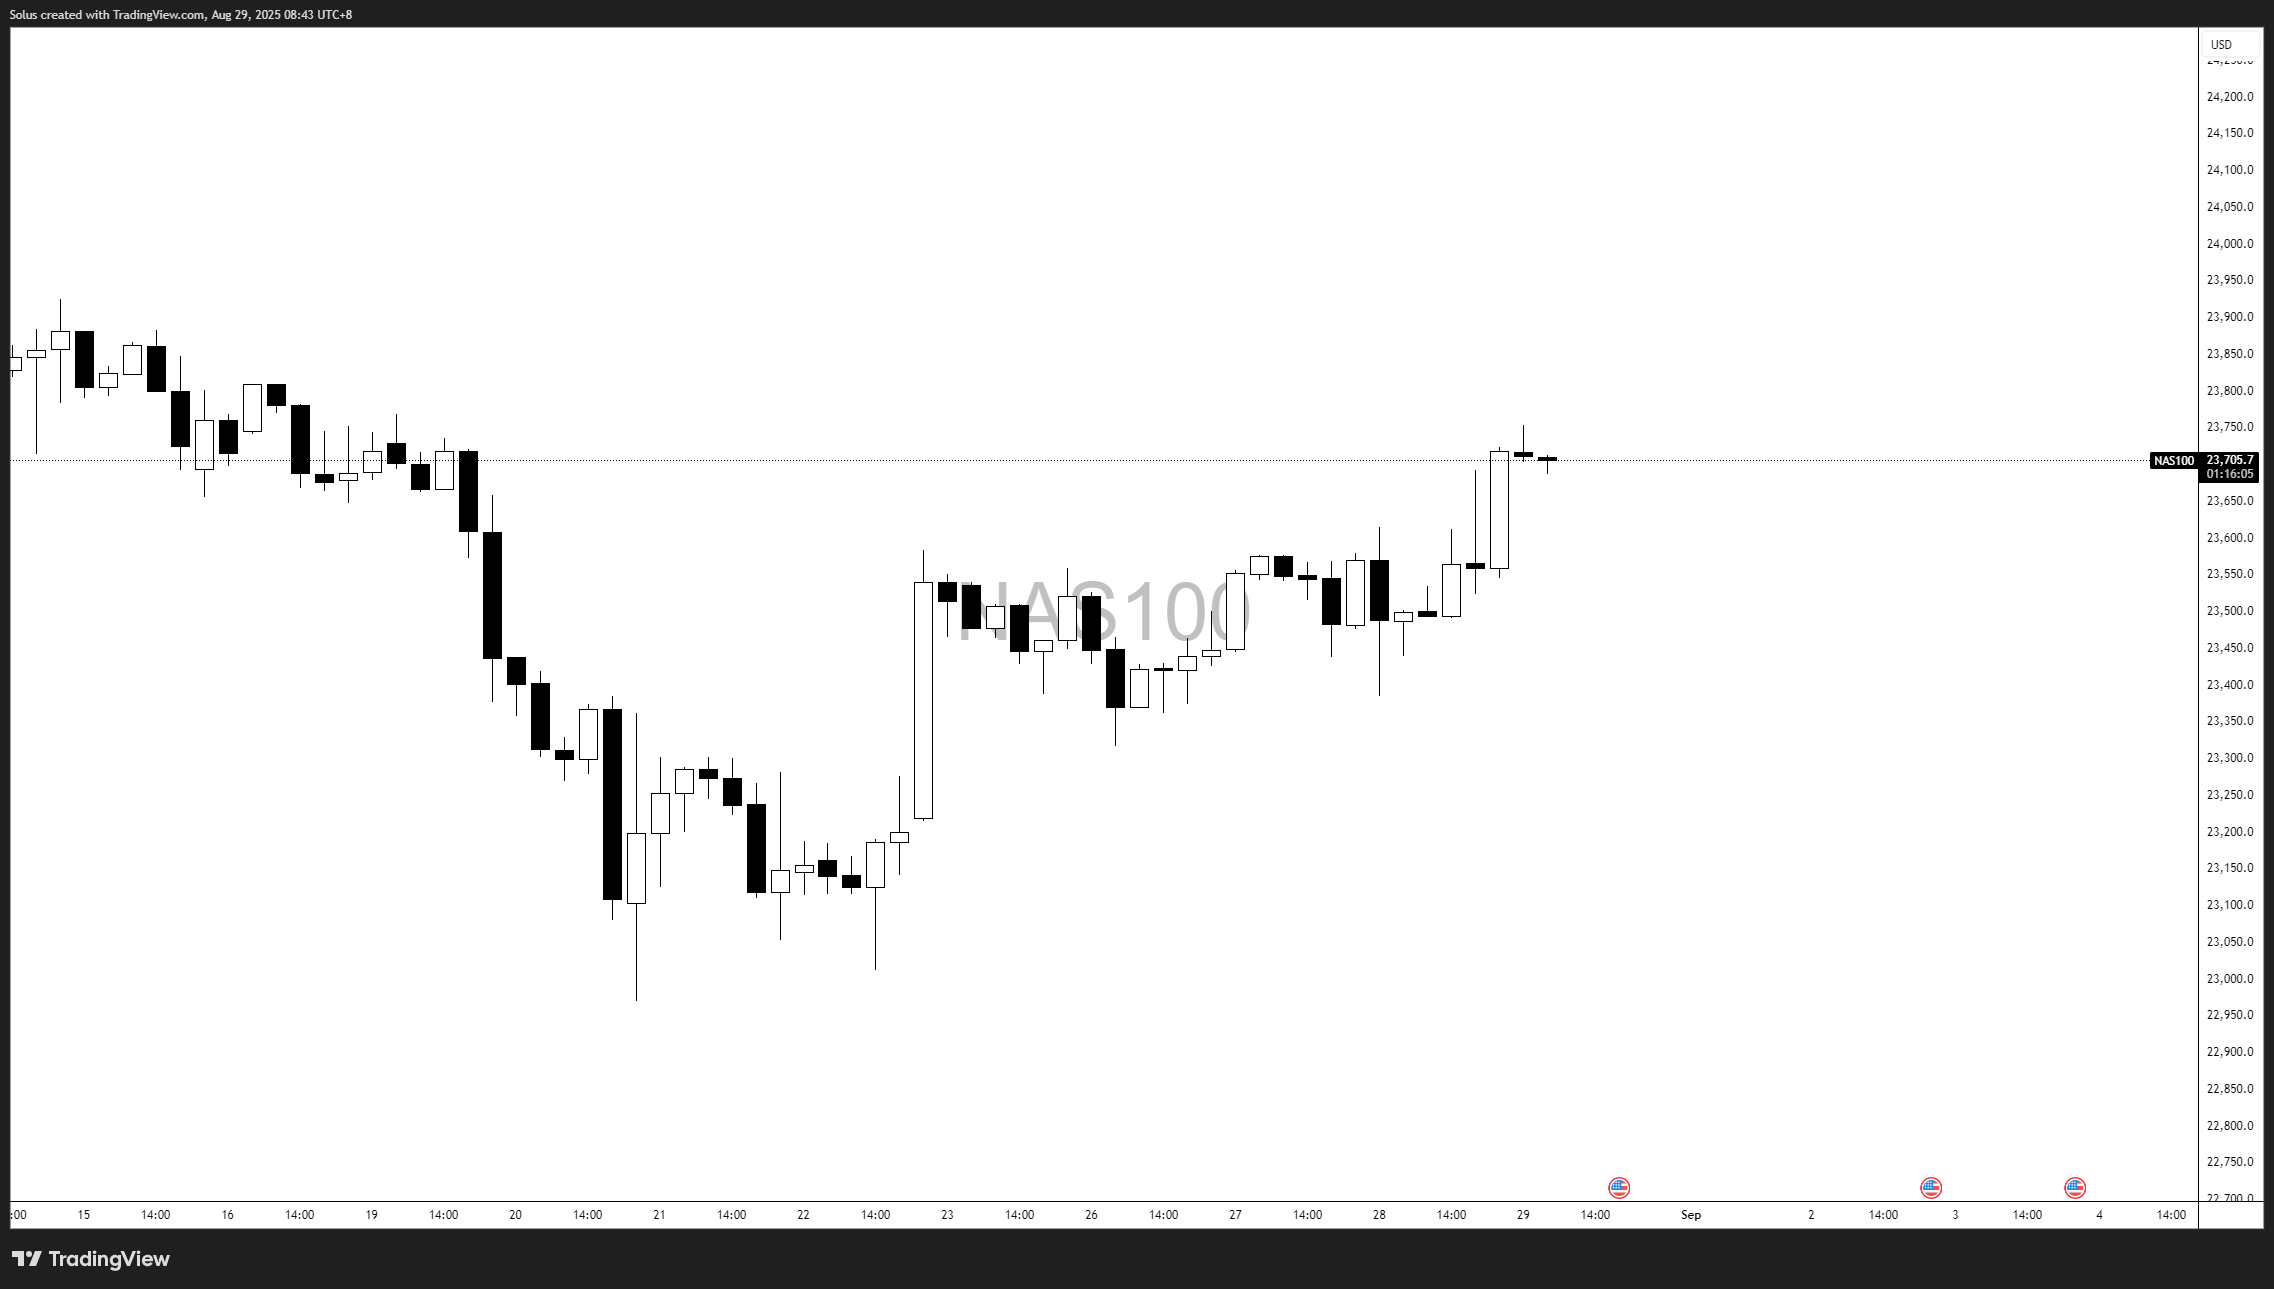
The NASDAQ 100 Price is consolidating near 23,700, showing signs of accumulation after its recent rally. Price action suggests two clear paths: either a clean breakout above resistance targeting 24,000, or a rejection into the demand zone highlighted on the chart.
Momentum favors buyers, but sustained support is critical for continuation.
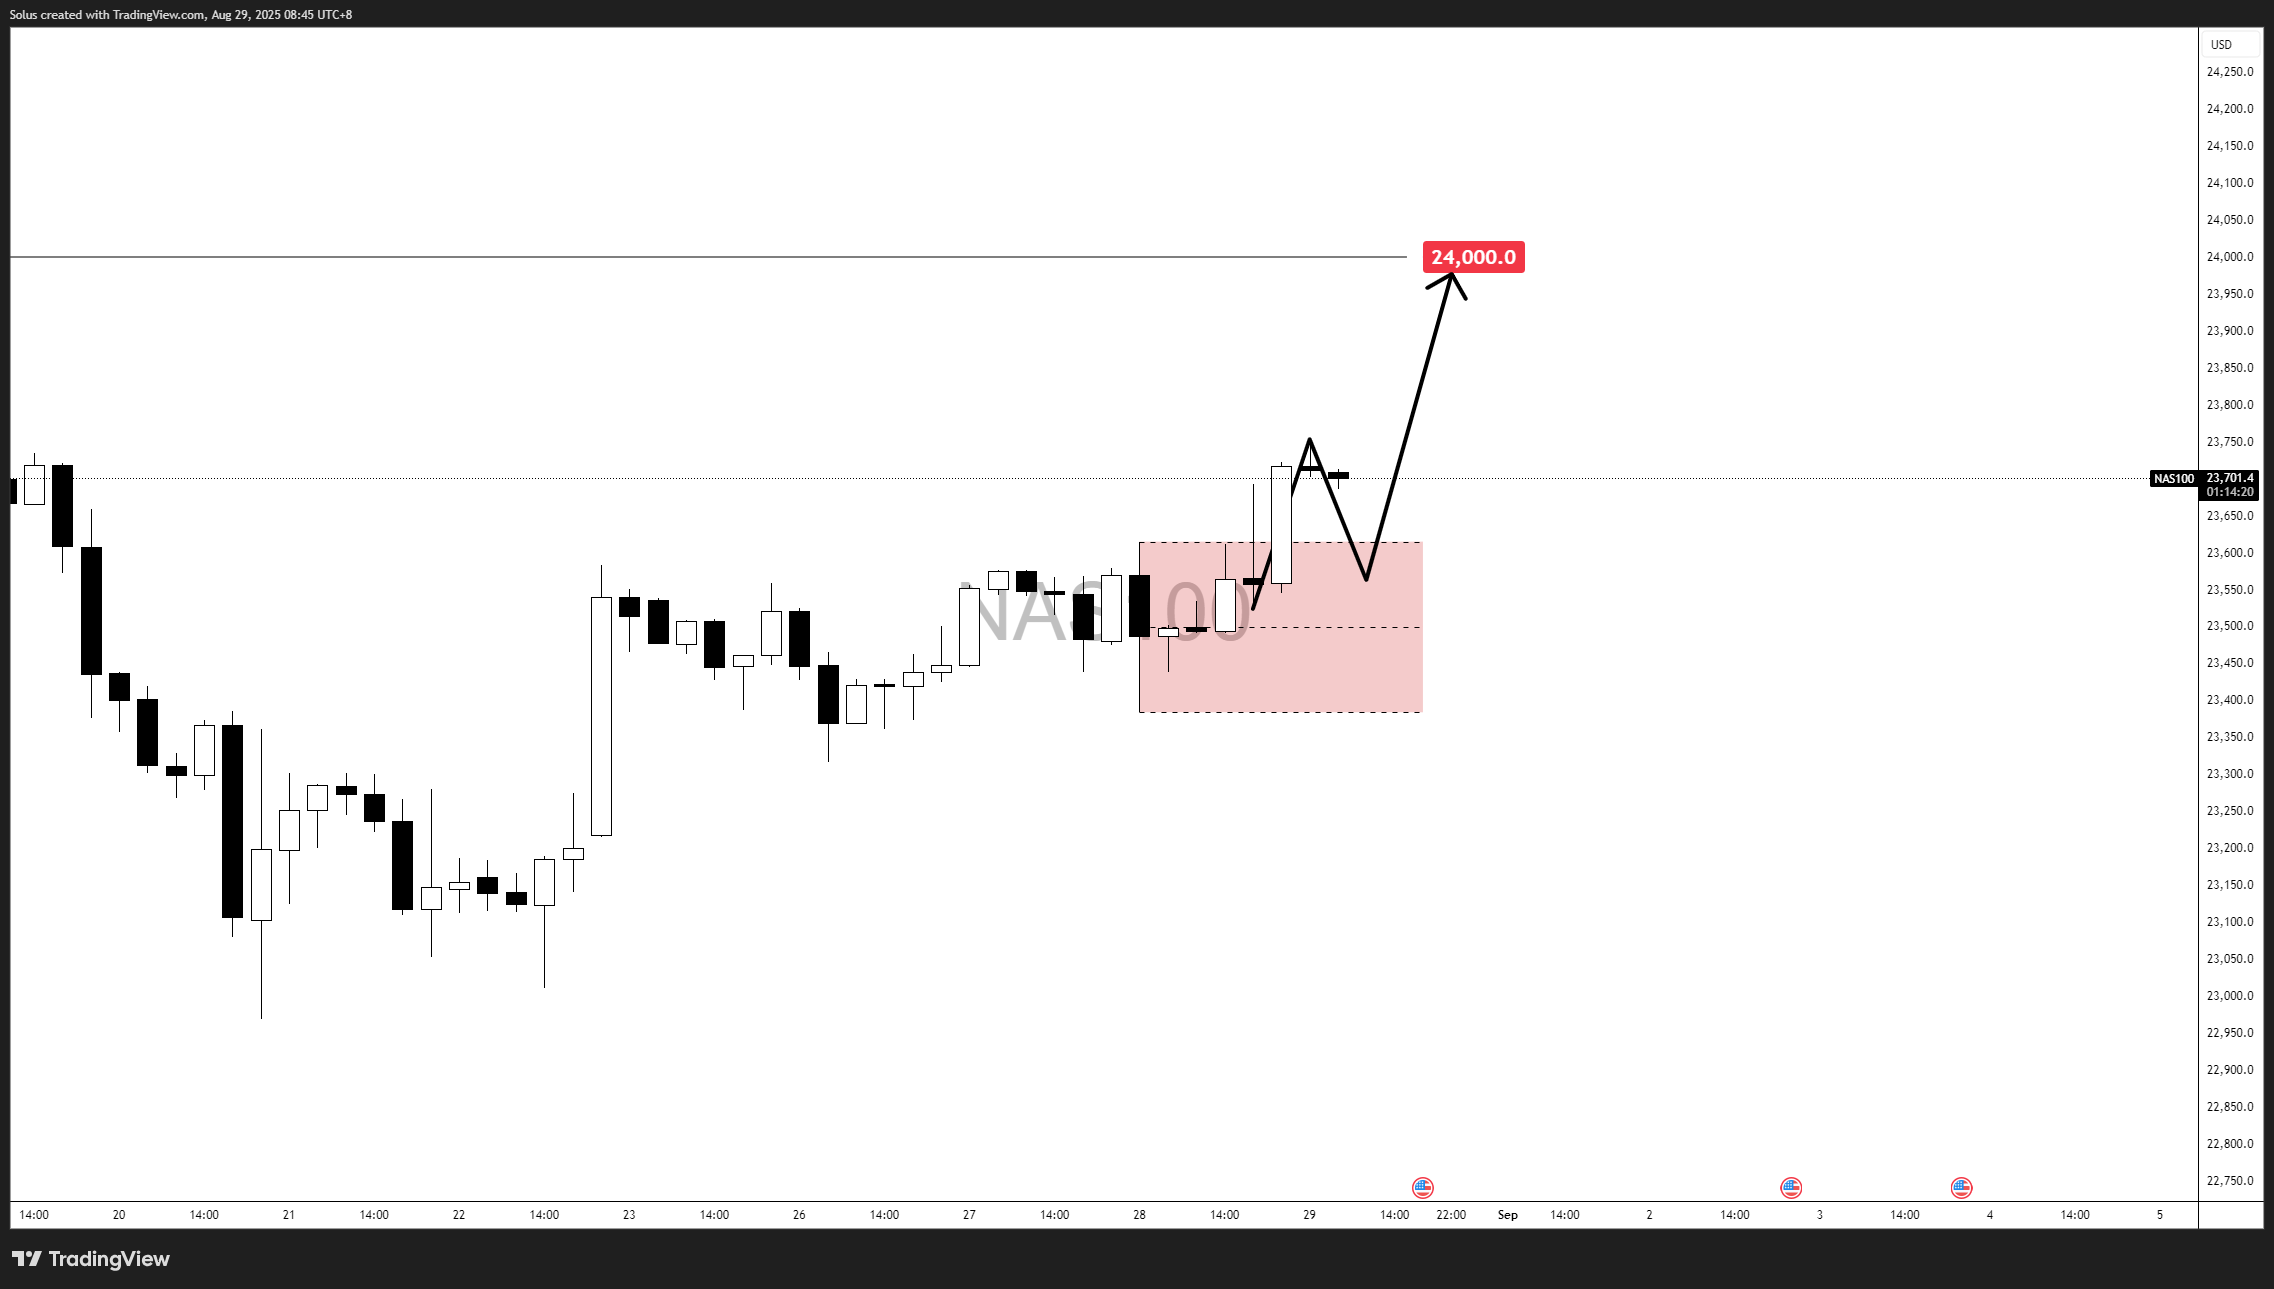
If NASDAQ 100 Price breaks and holds above 23,700–23,750, upside targets include:
Macro catalysts would include a softer Core PCE print or Fed guidance signaling readiness to ease.
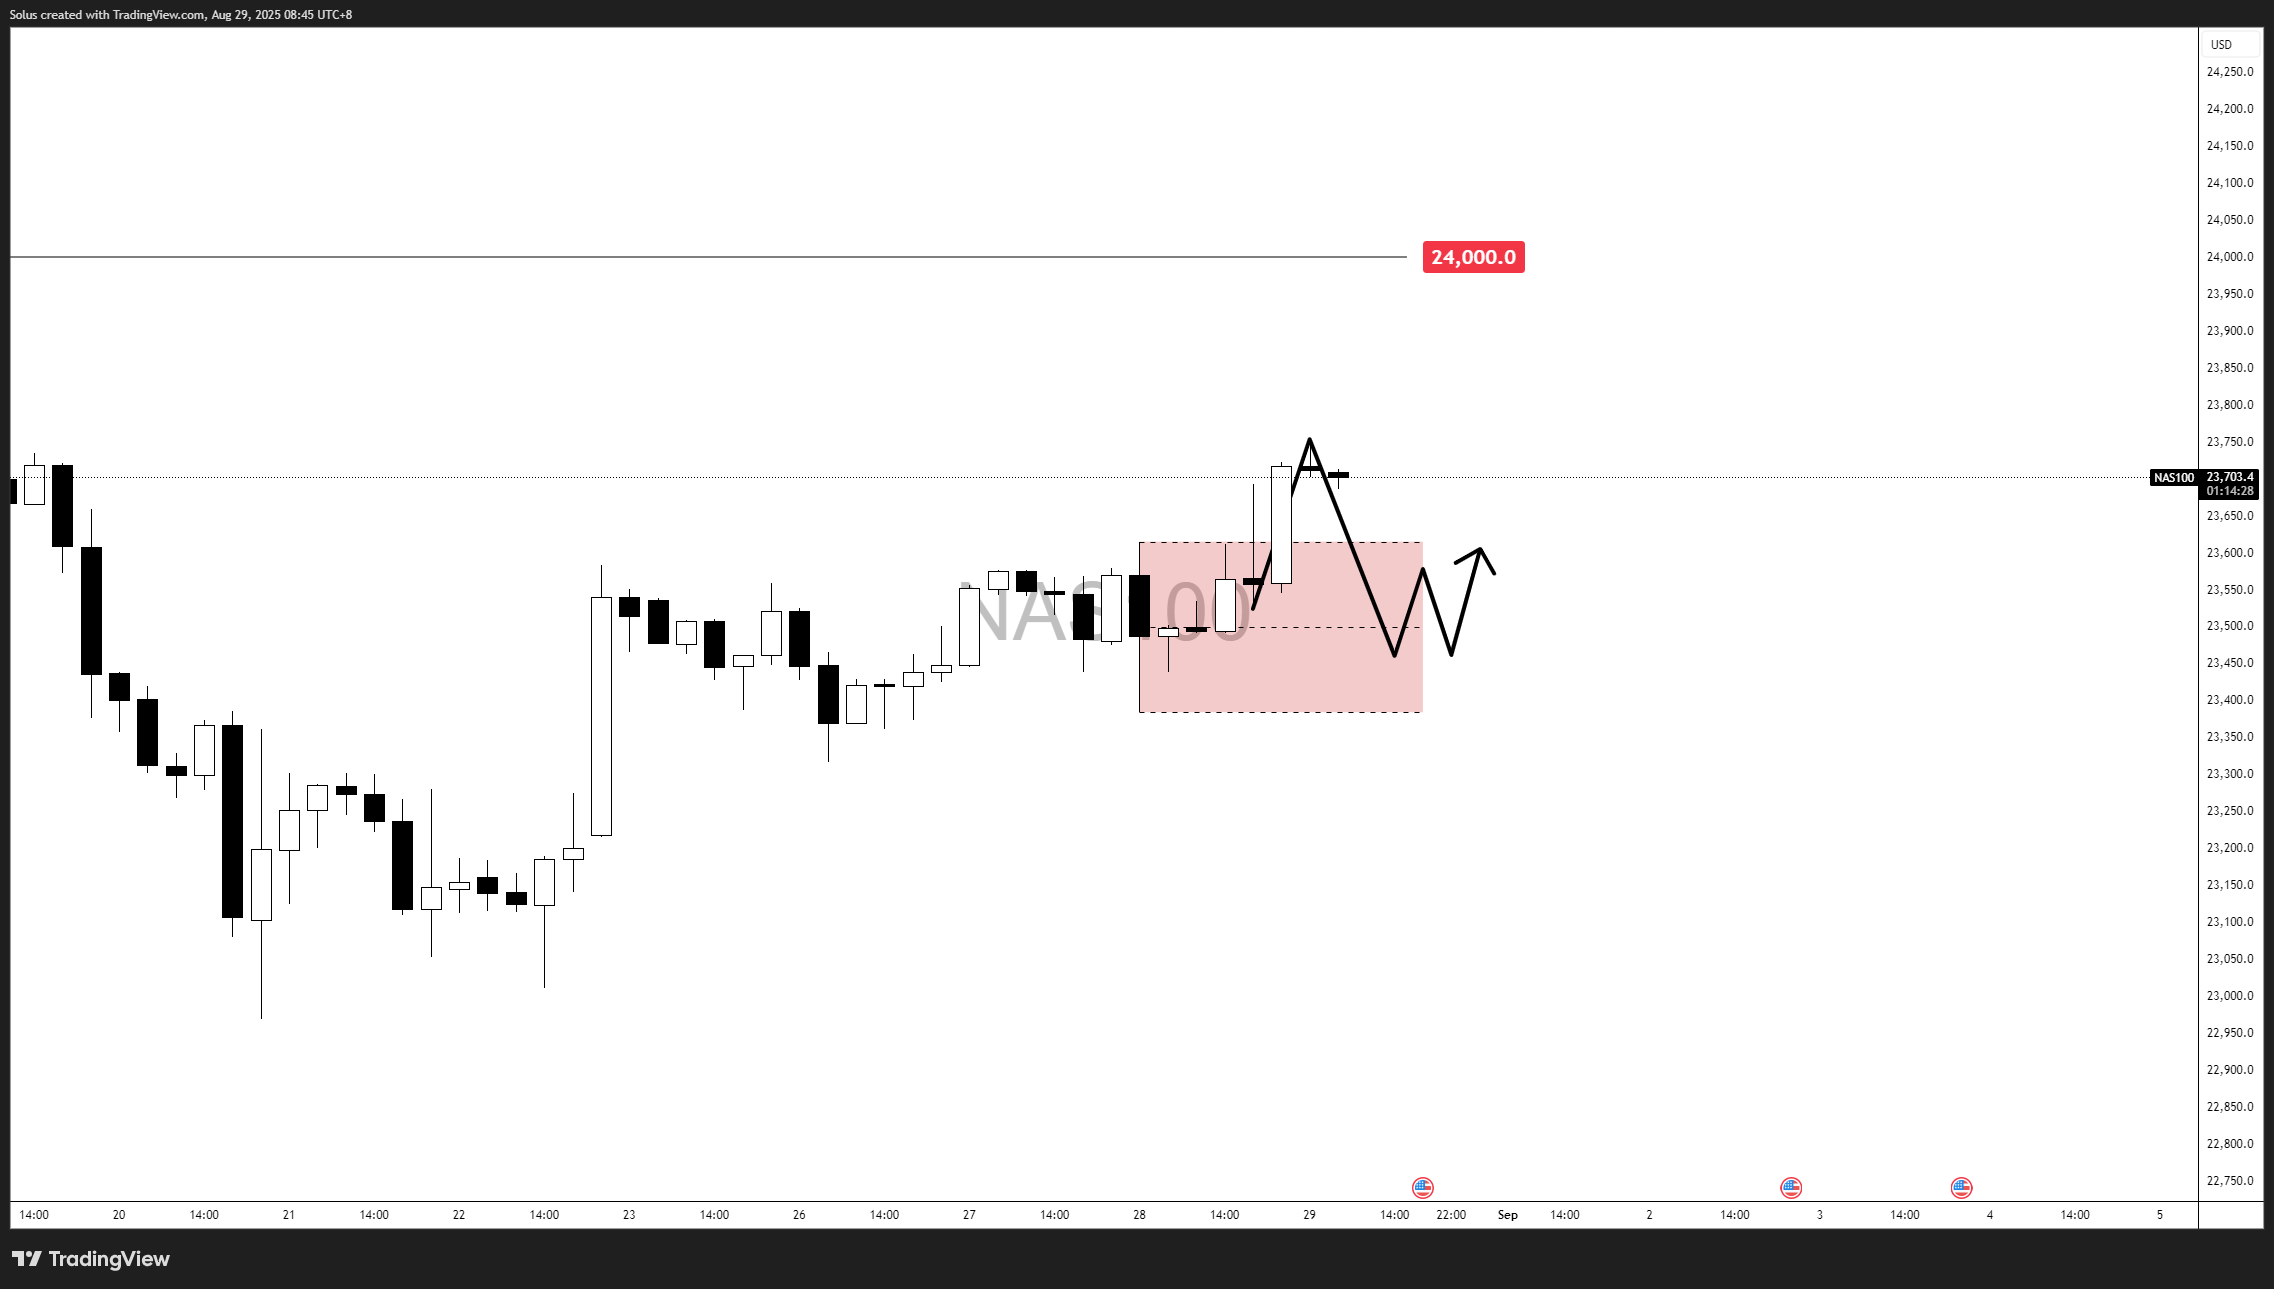
If NASDAQ 100 Price fails to hold above resistance and dips into the shaded demand area, a corrective wave could develop:
This bearish case would likely unfold if Core PCE surprises higher or if Fed officials adopt a more hawkish stance, triggering risk-off sentiment.
It’s time to go from theory to execution - risk-free.
Create an Account. Start Your Free Demo!
Looking for step-by-step approaches you can plug straight into the charts? Start here:
Sharpen your edge with proven tools and frameworks:
News moves markets fast. Learn how to keep pace with SMC-based playbooks:
From NASDAQ opens to DAX trends, here’s how to approach indices like a pro:
Gold remains one of the most traded assets — here’s how to approach it with confidence:
Candlesticks are the building blocks of price action. Master the most powerful ones:
Ready to go intraday? Here’s how to build consistency step by step:
Markets swing between calm and chaos. Learn to read risk-on vs risk-off like a pro:
Step inside the playbook of institutional traders with SMC concepts explained:
Forex pairs aren’t created equal — some are stable, some are volatile, others tied to commodities or sessions.
If you’ve ever been stopped out right before the market reverses — this is why:
Mindset is the deciding factor between growth and blowups. Explore these essentials:
The real edge in trading isn’t strategy — it’s how you protect your capital:
If you’re not sure where to start, follow this roadmap:
This way, you’ll grow from foundation → application → mastery, instead of jumping around randomly.
Follow me for more daily market insights!
Jasper Osita - LinkedIn - FXStreet - YouTube
This content may have been written by a third party. ACY makes no representation or warranty and assumes no liability as to the accuracy or completeness of the information provided, nor any loss arising from any investment based on a recommendation, forecast or other information supplies by any third-party. This content is information only, and does not constitute financial, investment or other advice on which you can rely.
ACY Securities is one of Australia's fastest growing multi-asset online trading providers, offering ultra-low-cost trading, rock-solid execution, technologically superior account management and premium market analysis.
Select the categories and companies you wish to follow directly to your person rss feed.
Create Custom RSS FeedSign up and join over 5,000 professional members who receive personalized news alerts, curated professional connections, and more for free!
Retail futures trading leader NinjaTrader Group has appointed Mark Omens as Senior Vice President, Commercial Strategy, bringing a 25-year veteran of derivatives marketplace CME Group into a newly created role focused on exchange partnerships and enterprise growth.
Gold Price Action Forecast: Will XAU/USD Drop to $3930? Meta Description: Read our Gold price action forecast to see if XAU/USD will drop to $3930.
BitDelta Securities Financial Services LLC (“BitDelta Securities”) today announced that it has received full regulatory approval from the Capital Market Authority (“CMA”) of the United Arab Emirates under the Category 5 — Arrangement and Advice license framework (License No. 20200000439). The approval follows the firm's receipt of In-Principal Approval earlier this year and represents the successful conclusion of the CMA's full licensing process, including the satisfaction of capital requirements, governance appointments, and operational setup.
Crypto.com has received a $400 million strategic investment from Citadel Securities, valuing the firm at $20 billion. It marks the first institutional funding round in the company's history, aimed at accelerating its expansion into tokenised securities, derivatives and other asset classes.
WTI’s pullback into $79–82 is the first major test of the bullish Elliott Wave count, with buyers targeting a renewed break above $85.

BitDelta Securities has secured a full CMA Category 5 licence in the UAE and opened a regulated office in Business Bay, Dubai. The firm operates as an introducing broker, connecting investors with licensed international brokers across multiple asset classes, with CEO Dr. Demetrios Zamboglou commenting on the milestone.
Index volatility is asleep while single stocks fight it out underneath, credit refuses to confirm the equity rally, and a bare macro calendar hands next week to oil.
Digital assets and FX brokerage GC Exchange FZE (GCEX) has appointed Mohammed A. Mulla as a Board Member of its Dubai-based entity, part of the wider GCEX Group.
Learn what Blockchain-as-a-Service is, how it works, and why businesses are using BaaS to build blockchain applications without managing infrastructure.
CFDs vs stocks compared on leverage, ownership, costs, dividends, taxes, and risk. Learn the differences between stocks and CFDs and discover which suits your investing or trading goals.


