just now

Liquidity Finder Ltd is incorporated in England and Wales, company number 10610740, registered address 167-169 Great Portland Street, Fifth Floor, London W1W 5PF, United Kingdom.
Published: just now

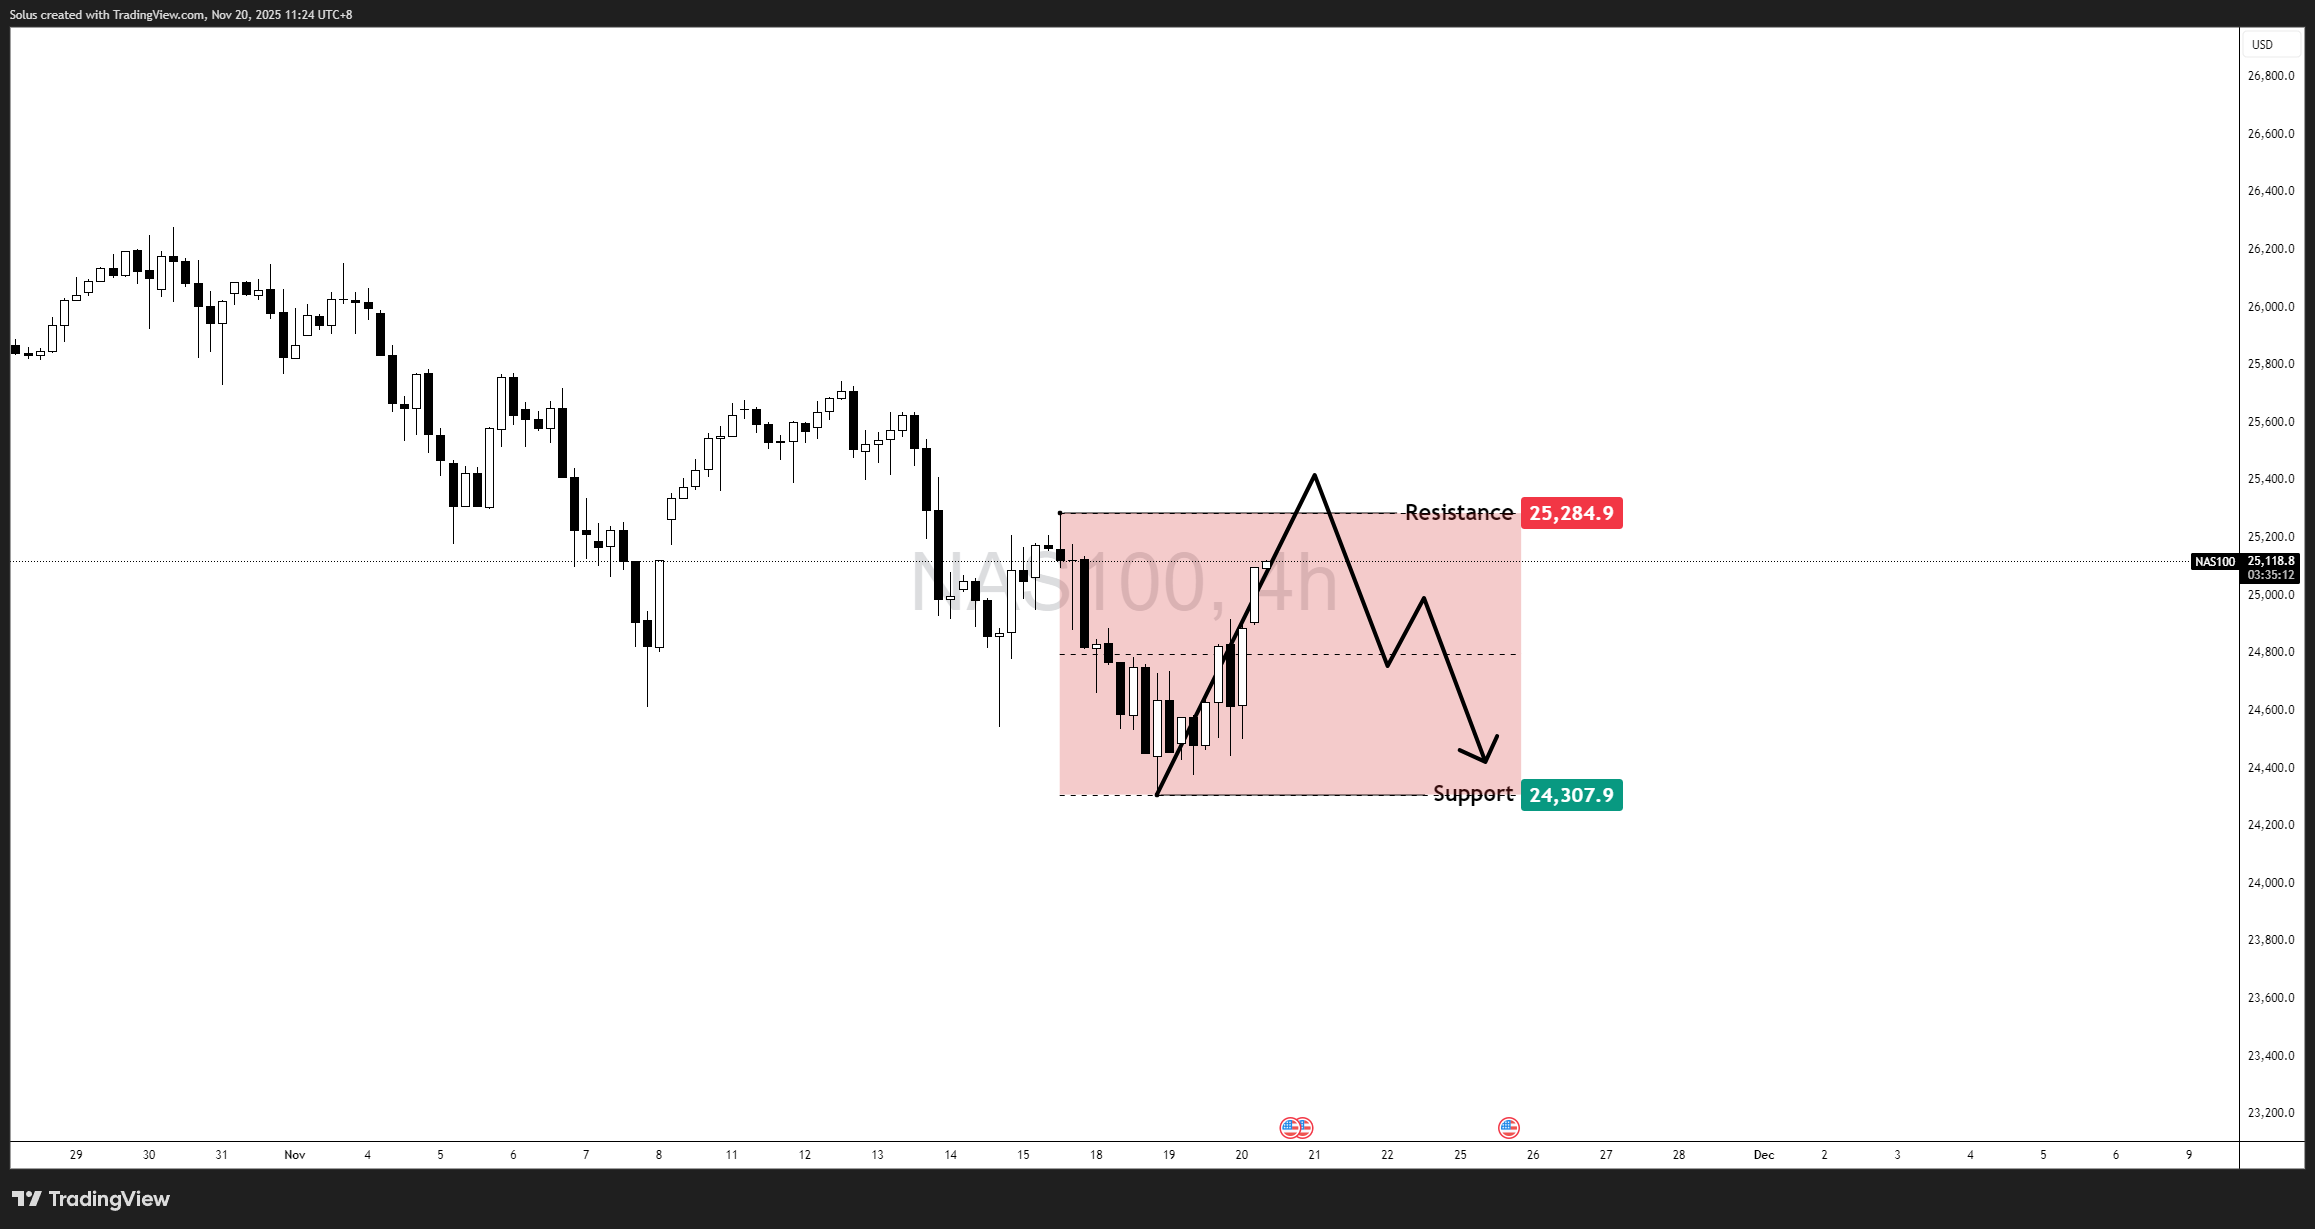
The Nasdaq 100 spent the past few sessions recovering strongly from its November lows, rebounding from 24,307 and climbing back into the 25,100–25,150 mid-range zone. While the candles look convincing, the broader picture reveals a different story: the index remains trapped inside a 4H range structure, boxed between 24,307 (support) and 25,284 (resistance).
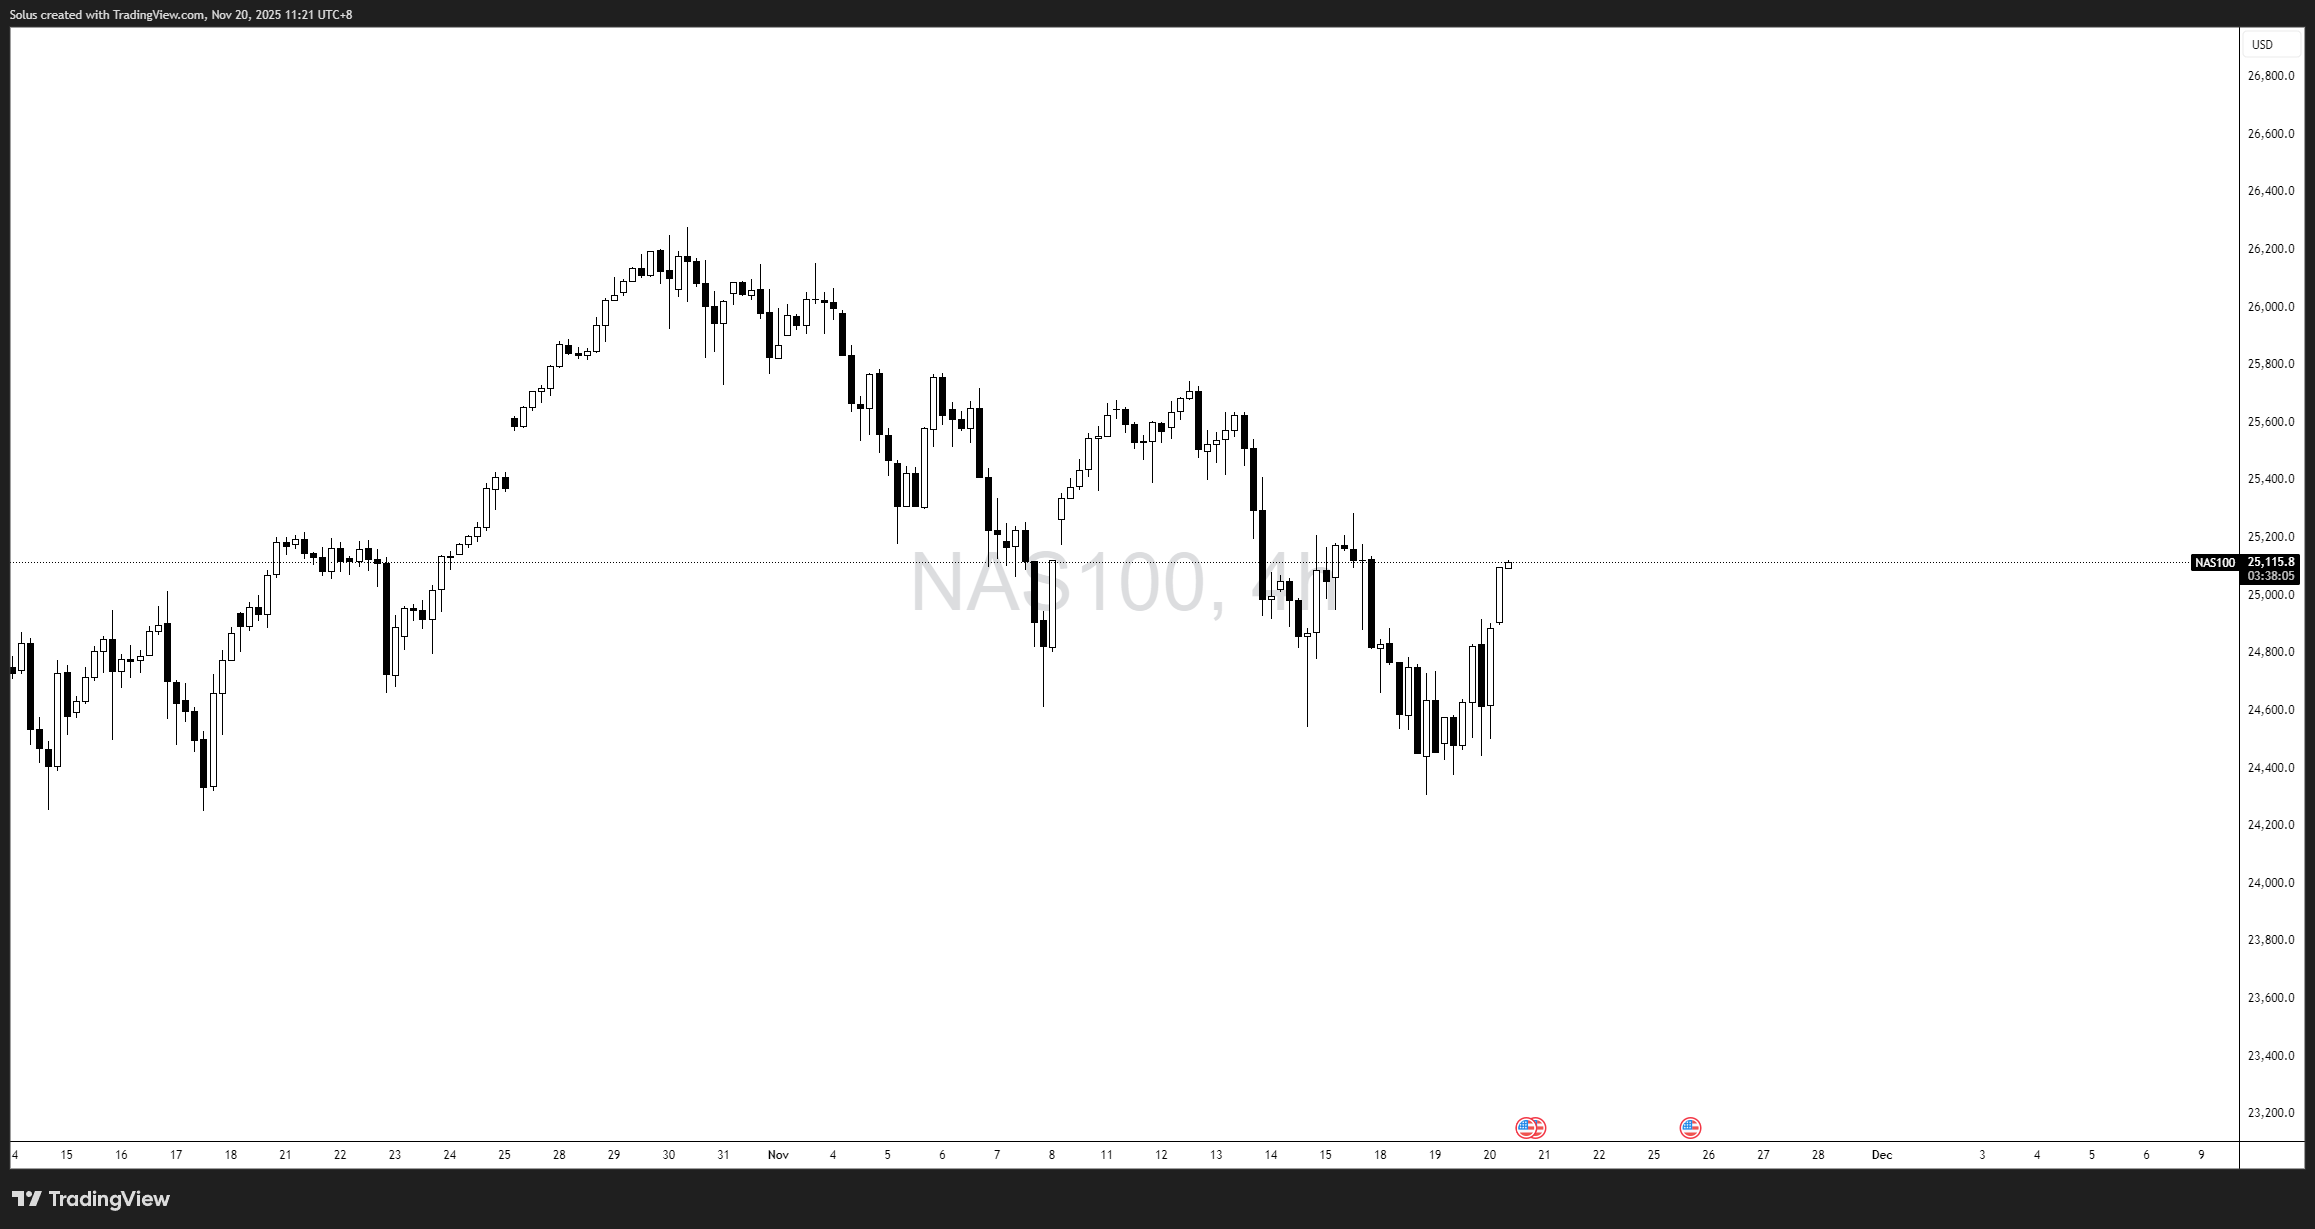
This means the rebound is impressive—but still unconfirmed. Until price breaks the range high, the move remains corrective rather than trend-defining.
The question traders are now asking:
Is this the start of a real recovery, or just another trap inside the box?
Strong reaction at 24,307
This zone continues to hold as firm demand, with clear willingness from buyers to defend the level aggressively.
Tech sentiment stabilizing
Megacap and AI names are seeing renewed bids, giving the Nasdaq a foundation for recovery.
No new adverse macro catalysts
Despite the government shutdown and delayed U.S. economic releases, new risk-off triggers are absent for now.
Price still below 25,284 resistance
This ceiling defines the entire range. Without a break, the narrative stays neutral.
Corrective, not impulsive structure
Current candles push upward, but not with the momentum normally associated with trend reversal.
Uncertain macro environment
Fed messaging, liquidity stress, and missing data due to the shutdown make institutions hesitant to fully commit.
Taken together, Nasdaq is strong in the short term, weak in the broader context, and stuck between confirmation and doubt.
While the micro backdrop of tech strength helps the rebound, the macro landscape remains blurry:
Fed tone remains pivotal
Slightly hawkish shifts or concern about liquidity can quickly stall tech rallies.
Shutdown-induced data delays
With labor and inflation releases at risk of disruption, traders lack full visibility, forcing reliance on sentiment over data.
Risk appetite improving but cautious
Investors are willing to buy dips but not chase highs without macro clarity.
This aligns with what we’re seeing in price: a bounce, not yet a breakout.
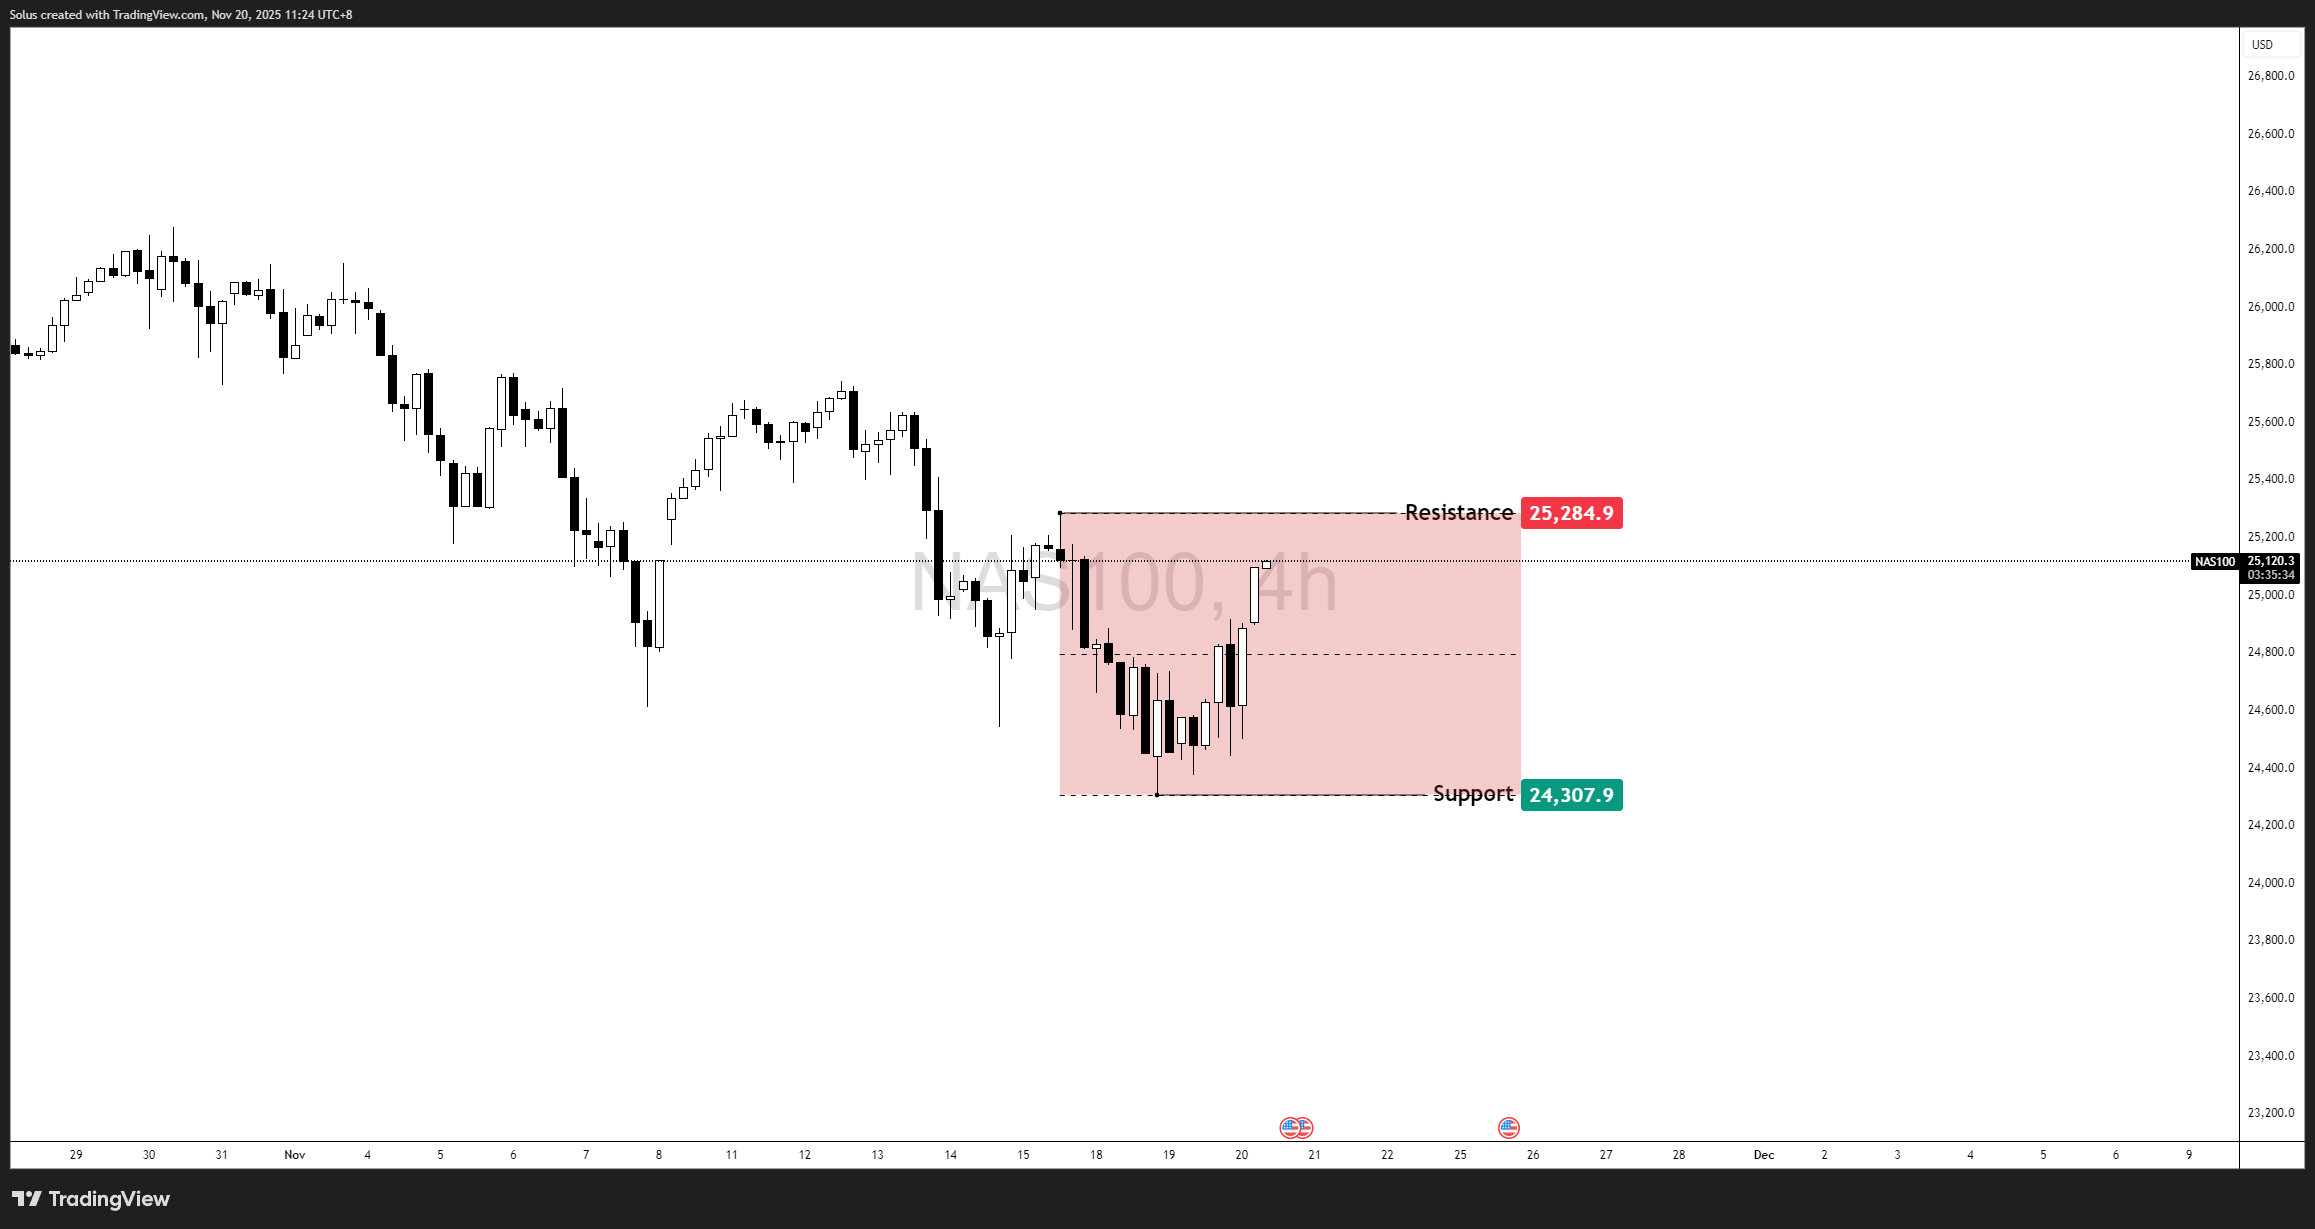
Price is rotating inside a defined 4H consolidation box. Your charts clearly outline two scenarios: a bullish breakout continuation or a bearish range rotation.
The rebound becomes a real breakout only if Nasdaq:
If this plays out, the market shifts from neutral to bullish with upside potential.
As per your markup, the bullish scenario requires confirmation. No breakout = no long bias.
If Nasdaq fails to break the resistance:
This aligns with your projected bearish sweep.
This is where the “trap” narrative becomes valid—strong-looking rebound, but still inside a range that invites a full sweep.
The Nasdaq 100 rebound looks impressive—but until 25,284 breaks, it remains just that: a rebound inside a box. The market is balanced, reactive, and waiting for confirmation.
For now, traders should treat the Nasdaq as a range market, not a trending one. Patience and confirmation remain the edge.
It’s time to go from theory to execution!
Create an Account. Start Your Live Trading Now!
Looking for step-by-step approaches you can plug straight into the charts? Start here:
Sharpen your edge with proven tools and frameworks:
News moves markets fast. Learn how to keep pace with SMC-based playbooks:
From NASDAQ opens to DAX trends, here’s how to approach indices like a pro:
Gold remains one of the most traded assets - here’s how to approach it with confidence:
Candlesticks are the building blocks of price action. Master the most powerful ones:
Ready to go intraday? Here’s how to build consistency step by step:
Markets swing between calm and chaos. Learn to read risk-on vs risk-off like a pro:
Step inside the playbook of institutional traders with SMC concepts explained:
Forex pairs aren’t created equal - some are stable, some are volatile, others tied to commodities or sessions.
If you’ve ever been stopped out right before the market reverses - this is why:
Mindset is the deciding factor between growth and blowups. Explore these essentials:
The real edge in trading isn’t strategy - it’s how you protect your capital:
If you’re not sure where to start, follow this roadmap:
This way, you’ll grow from foundation → application → mastery, instead of jumping around randomly.
Follow me for more daily market insights!
Jasper Osita - LinkedIn - FXStreet - YouTube
This content may have been written by a third party. ACY makes no representation or warranty and assumes no liability as to the accuracy or completeness of the information provided, nor any loss arising from any investment based on a recommendation, forecast or other information supplies by any third-party. This content is information only, and does not constitute financial, investment or other advice on which you can rely.
ACY Securities is one of Australia's fastest growing multi-asset online trading providers, offering ultra-low-cost trading, rock-solid execution, technologically superior account management and premium market analysis.
Select the categories and companies you wish to follow directly to your person rss feed.
Create Custom RSS FeedSign up and join over 5,000 professional members who receive personalized news alerts, curated professional connections, and more for free!
cBridge, by Spotware, has launched Markout Report, a risk intelligence module that lets brokers detect toxic flow, rank accounts by financial impact and act before losses accumulate, all within the bridge.
Sterling steadies after political uncertainty rattled gilt markets, while EUR/USD and EUR/GBP approach key technical levels ahead of today's European session.
GBP/AUD remains trapped in a well-defined bearish trend on both the weekly and daily timeframes.
Discover the key drivers, technical levels, and central bank expectations shaping the EUR/USD trend as the ECB prepares to hold rates and markets watch for a potential breakout.
Sydney-based multi-asset broker ACY Securities has introduced PAXGUSD, a new CFD instrument that allows clients to trade tokenised gold against the US Dollar 24 hours a day, seven days a week. The instrument is available across MetaTrader 4, MetaTrader 5, and the ACY Trading Platform.
Binance has lowered its VIP 3 Wallet Assets threshold from $3 million to $1 million and will now count OTC Spot Trading Volume at a 4x multiplier toward VIP qualification, removing the previous VIP 4 cap and allowing eligible users to progress through the full tier framework up to VIP 9.
Retail futures trading leader NinjaTrader Group has appointed Mark Omens as Senior Vice President, Commercial Strategy, bringing a 25-year veteran of derivatives marketplace CME Group into a newly created role focused on exchange partnerships and enterprise growth.
Gold Price Action Forecast: Will XAU/USD Drop to $3930? Meta Description: Read our Gold price action forecast to see if XAU/USD will drop to $3930.
BitDelta Securities Financial Services LLC (“BitDelta Securities”) today announced that it has received full regulatory approval from the Capital Market Authority (“CMA”) of the United Arab Emirates under the Category 5 — Arrangement and Advice license framework (License No. 20200000439). The approval follows the firm's receipt of In-Principal Approval earlier this year and represents the successful conclusion of the CMA's full licensing process, including the satisfaction of capital requirements, governance appointments, and operational setup.
Crypto.com has received a $400 million strategic investment from Citadel Securities, valuing the firm at $20 billion. It marks the first institutional funding round in the company's history, aimed at accelerating its expansion into tokenised securities, derivatives and other asset classes.