just now

Liquidity Finder Ltd is incorporated in England and Wales, company number 10610740, registered address 167-169 Great Portland Street, Fifth Floor, London W1W 5PF, United Kingdom.
Published: just now

Markets just got another sharp turn in the tape.
Iran has reportedly just sent a fresh proposal for negotiations with the U.S. through Pakistani mediators, oil eased on the news, and earnings are still doing enough to keep buyers engaged. That combination has pushed the S&P 500 back toward the 7,300 area, or close enough that traders now have to treat it as a live level. After the move into 7,265, the gap is not that wide anymore.
That does not mean 7,300 has to print exactly.
It means the market is already close enough for the bigger question to take over: does this good-news wave still have enough fuel to squeeze a little further, or is it setting up the sort of peak that gets followed by a mid-year shakeout?
In this piece, we’re looking at three things now shaping the next move:
The cleaner warning sign is not the S&P 500 itself. It is SOX/SPX.
SOX is the semiconductor index. Comparing it with the S&P 500 shows whether chip stocks are still outperforming the broader market.
For an AI-led rally, that ratio tells you whether the market’s strongest theme is still doing the heavy lifting.
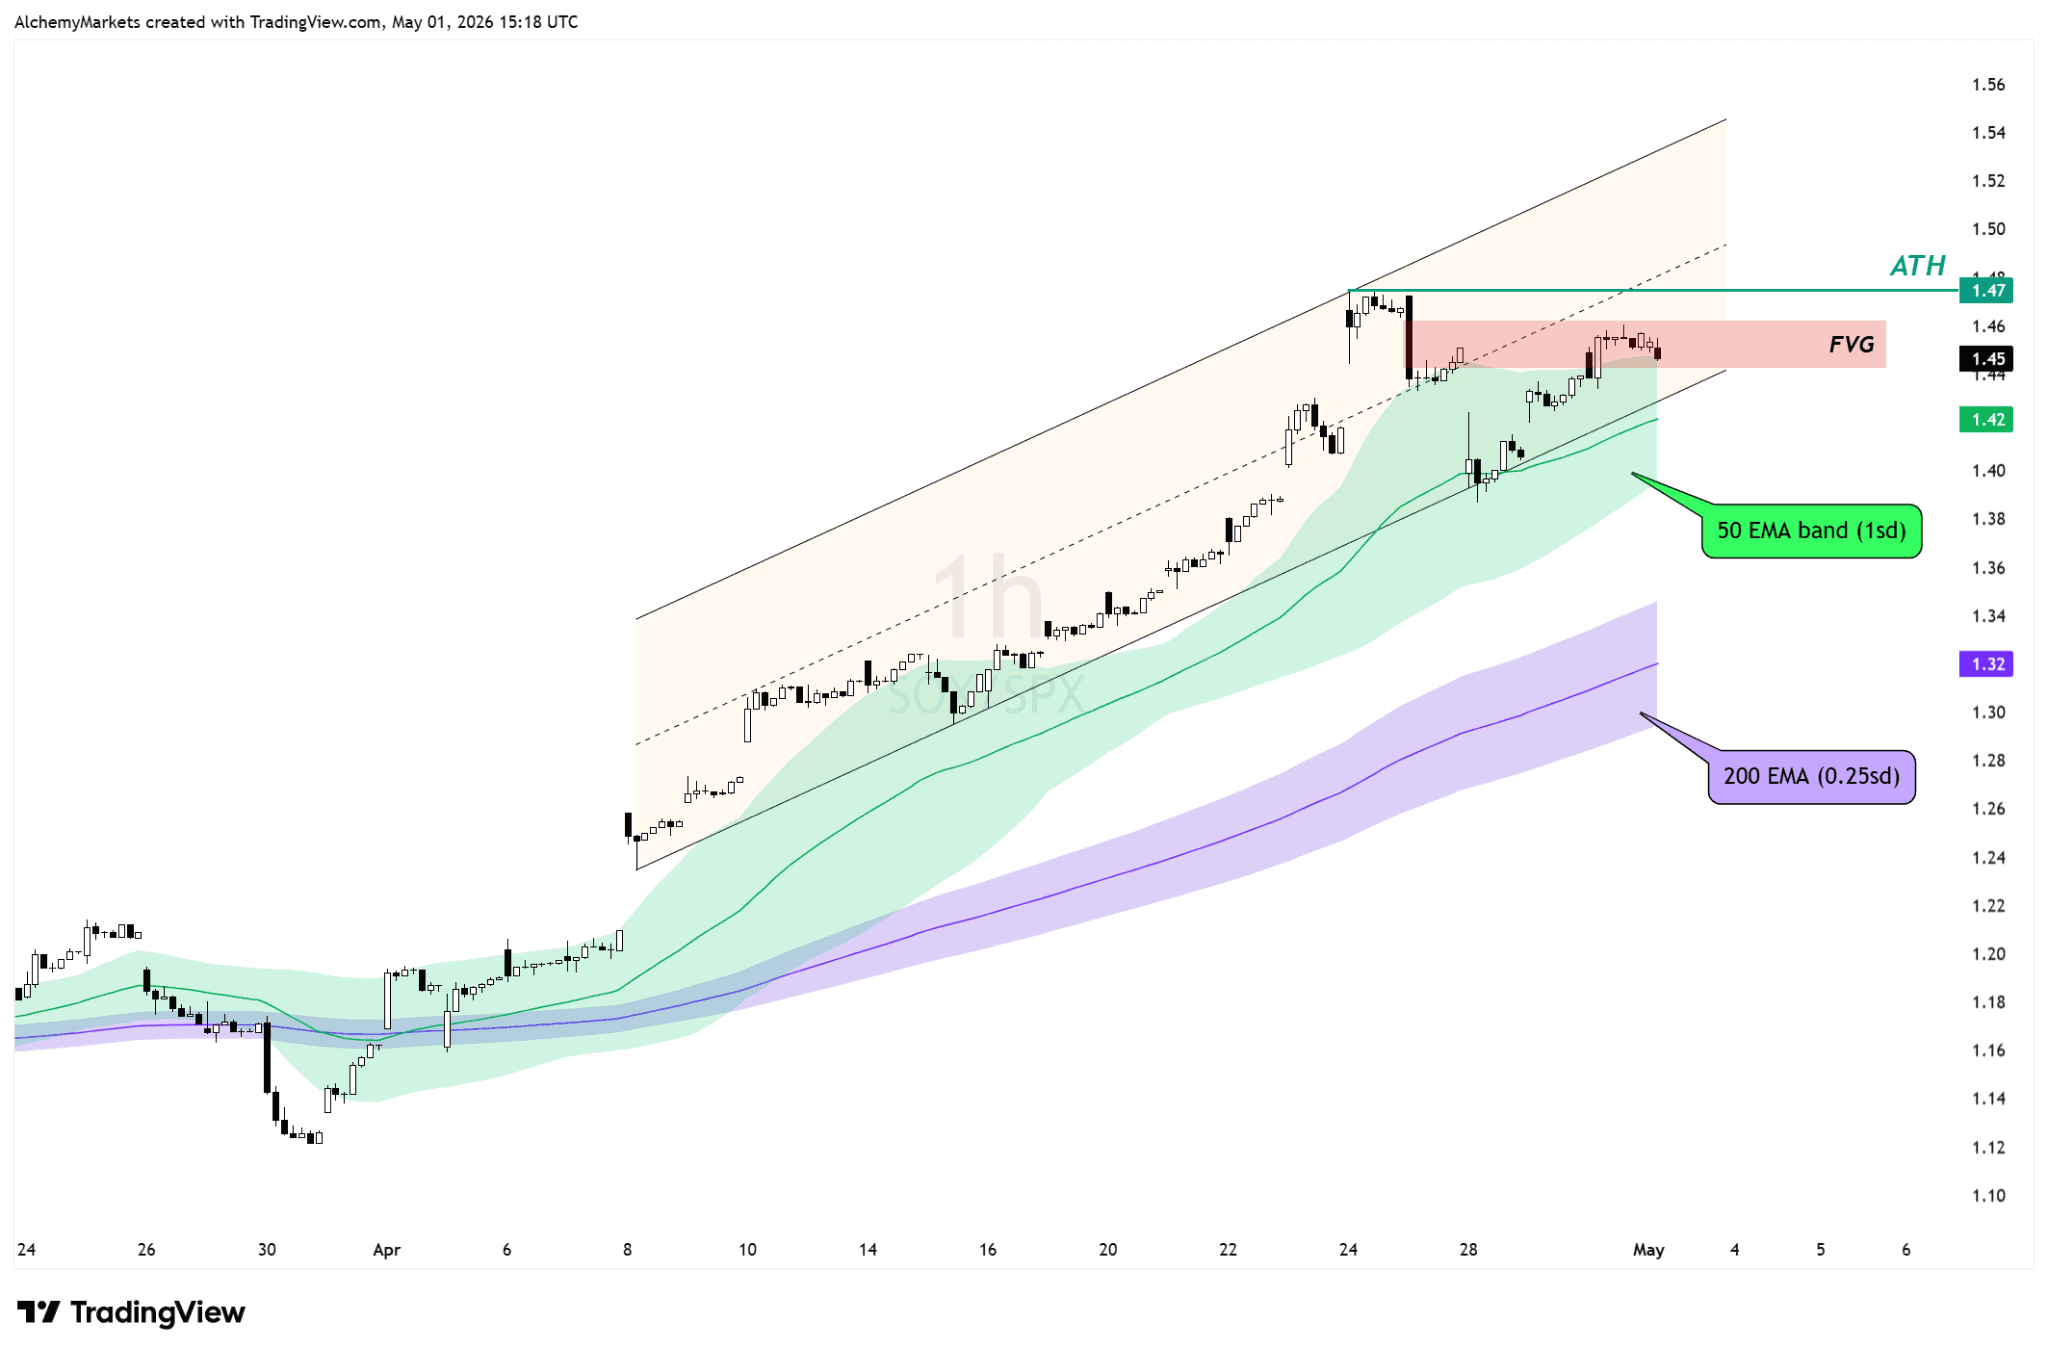
Right now, SOX/SPX is sitting in a potential rejection zone.
The ratio is pressing into the 1.45 to 1.46 area, where the fair value gap sits. However, a more interesting level would be the midline of the rising channel, which is near 1.47.
If semiconductors are stalling here or grinds higher, the index can still squeeze a little higher on earnings and improving Iran headlines.
However, if a breakdown begins, S&P 500 should begin to weaken as it is currently sustained by AI earning headlines.
The S&P 500 chart is now less about whether the rebound worked and more about how far this squeeze can still go.
https://twitter.com/Mr_Derivatives/status/2044896693750222913
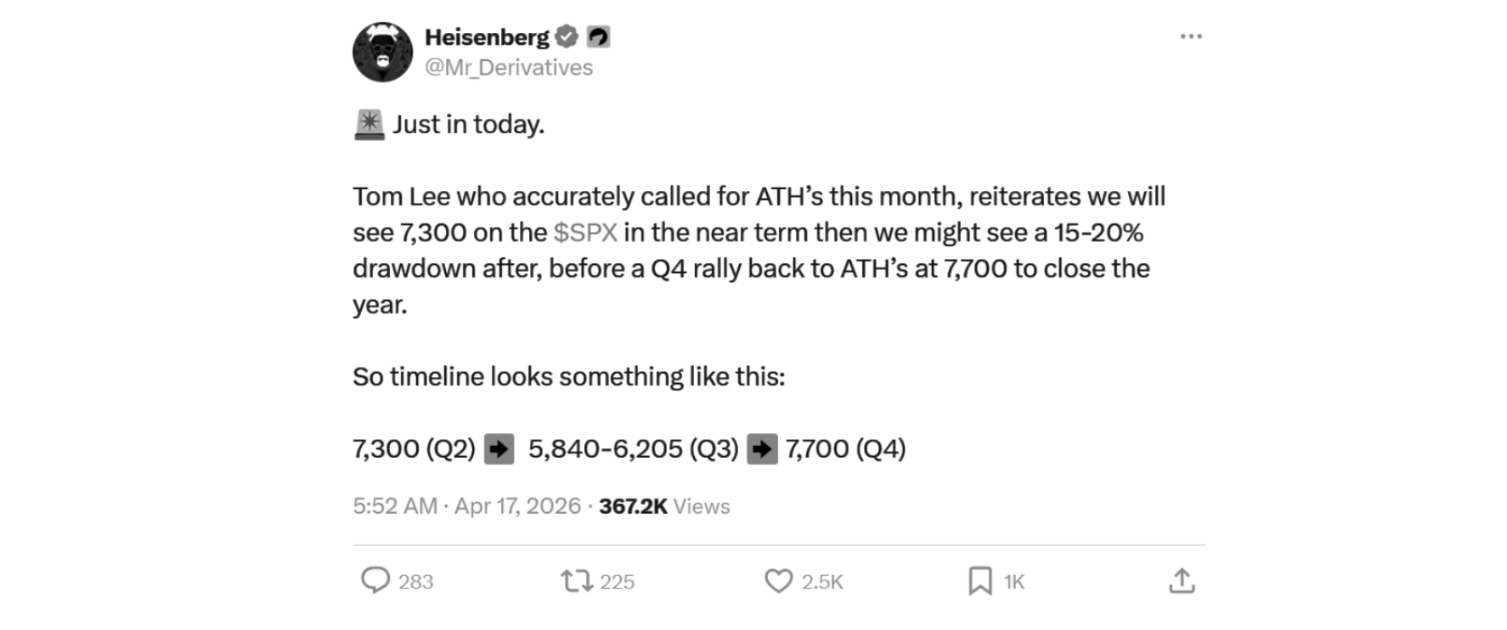
One projection making the rounds recently comes from Tom Lee of Fundstrat. Lee has argued that the S&P 500 can still push toward 7,300, helped by resilient earnings, easing inflation pressure and a market that has not fully chased the rally yet.
Separately, he has also said an S&P 500 move above 7,700 this year is “very probable,” after markets moved past early-year risks around Iran, private credit and Fed uncertainty.
That fits the current setup, but not as a straight-line melt-up story.
The S&P 500 has already traded into 7,265, so 7,300 does not need some heroic final leg. It only needs the current good-news wave to last a little longer.
Our read is that 7,300 is the interesting zone, not because it has to stop the market exactly, but because the risk-reward starts to change once price gets there.
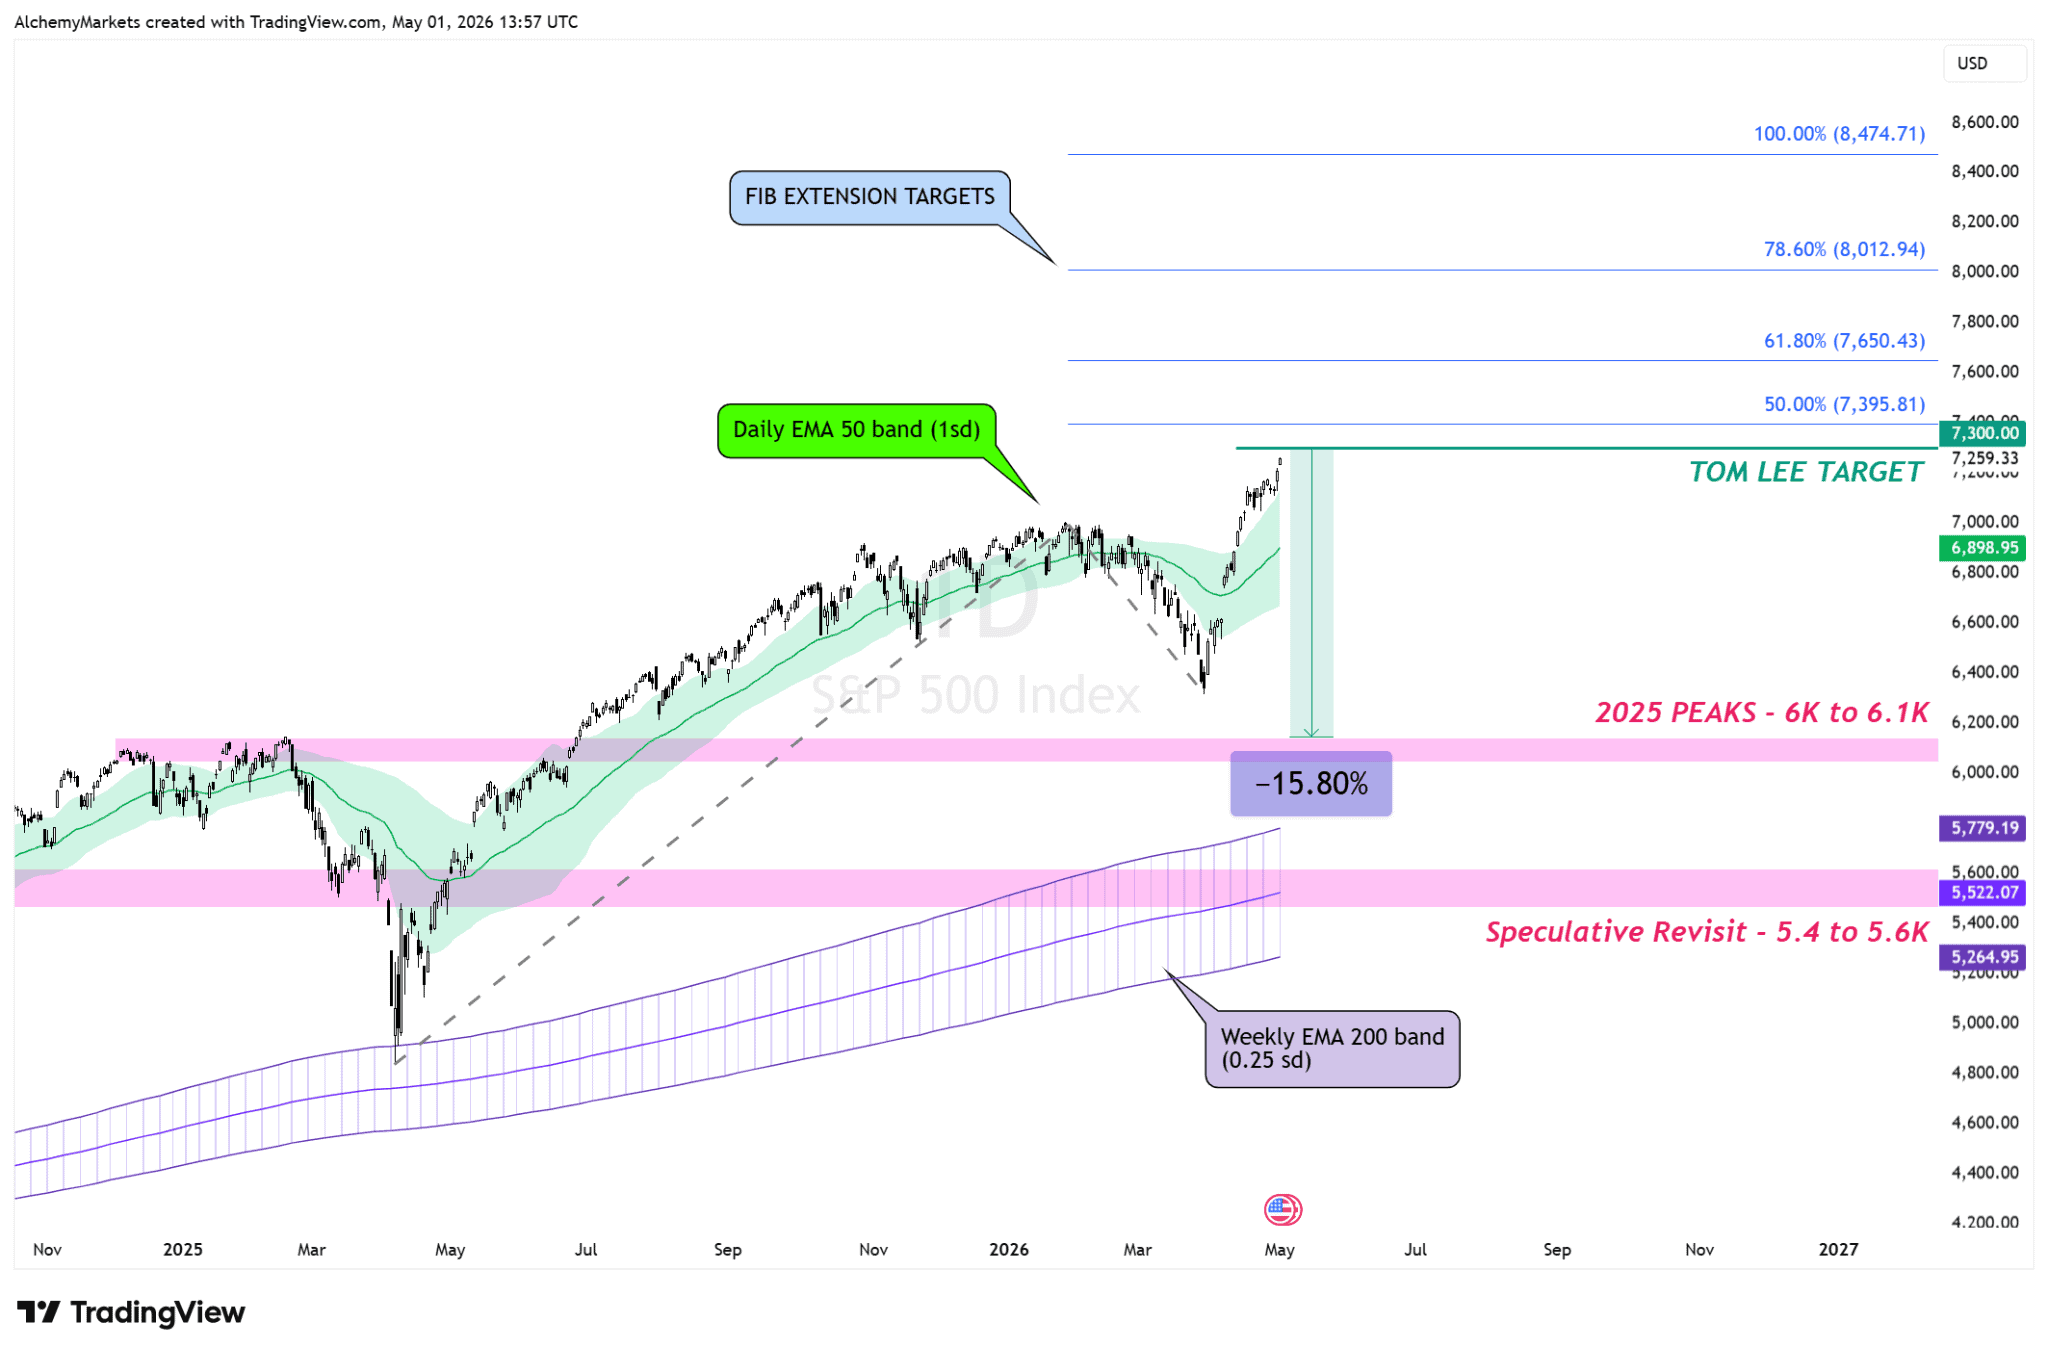
If semiconductors regain momentum and SOX/SPX pushes through its own resistance, the S&P 500 can still stretch beyond 7,300. In that case, the next upside references sit around 7,395 to 7,400, then 7,650 if momentum keeps running.
But those higher levels only matter if leadership holds underneath the surface.
If chip leadership keeps stalling while the S&P 500 pushes into 7,300, the move starts to look less like a fresh breakout and more like the final squeeze before correction risk takes over.
Take a look at this Midterm Election year seasonality chart from Artemis from February 2026 - it’s the typical price movement of S&P 500 during midterm election years.
Surprisingly, the path lines up extremely well with Tom Lee’s projections. May typically is a weaker month for the S&P leading into June, where the price then recovers and makes a new ATH into December.
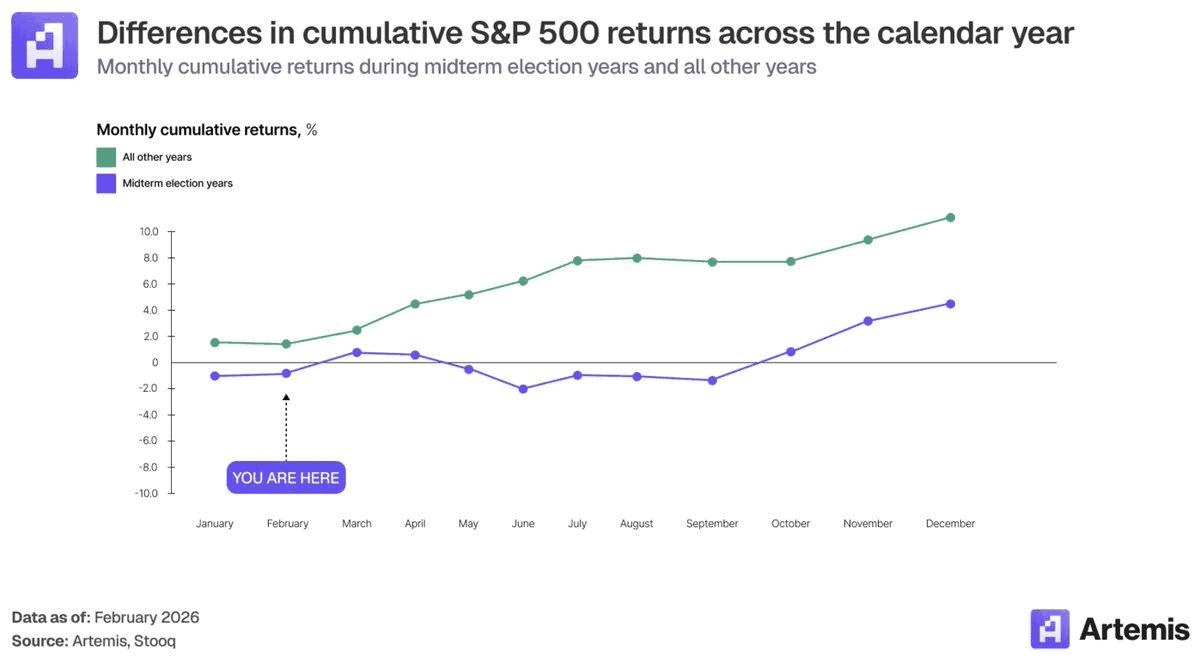
Although this is not a forecast, it is based on historical averages. So if the path ensues, we could see the following happen:
The year end targets could be near $7,700 as Tom Lee projected, but if not, Fib Extension levels could be good targets as well. Only time will tell if this typical mid-term pathing will rhyme true again in 2026.
Iran coming back to the table, softer oil and firm earnings have been enough to put S&P 7,300 back in play. But the more important read is underneath the headline index.
SOX/SPX is already in a potential rejection zone. If chip leadership pushes through it, the S&P 500 can still squeeze higher and 7,300 becomes easier to reach.
If chip leadership keeps stalling there, the index may still get close enough to test that area, but the move starts to look more like the last push of the leg than the start of a fresh one.
DISCLAIMER: For educational purposes only. Trading comes with substantial risk, leading to possible loss of your capital. Traders are advised to do their own due diligence before investing.
Alchemy Markets is a multi-asset brokerage providing retail traders with the same elite trading conditions, tools, and transparency typically reserved for institutions.
Select the categories and companies you wish to follow directly to your person rss feed.
Create Custom RSS FeedSign up and join over 5,000 professional members who receive personalized news alerts, curated professional connections, and more for free!
Retail futures trading leader NinjaTrader Group has appointed Mark Omens as Senior Vice President, Commercial Strategy, bringing a 25-year veteran of derivatives marketplace CME Group into a newly created role focused on exchange partnerships and enterprise growth.
Gold Price Action Forecast: Will XAU/USD Drop to $3930? Meta Description: Read our Gold price action forecast to see if XAU/USD will drop to $3930.
BitDelta Securities Financial Services LLC (“BitDelta Securities”) today announced that it has received full regulatory approval from the Capital Market Authority (“CMA”) of the United Arab Emirates under the Category 5 — Arrangement and Advice license framework (License No. 20200000439). The approval follows the firm's receipt of In-Principal Approval earlier this year and represents the successful conclusion of the CMA's full licensing process, including the satisfaction of capital requirements, governance appointments, and operational setup.
Crypto.com has received a $400 million strategic investment from Citadel Securities, valuing the firm at $20 billion. It marks the first institutional funding round in the company's history, aimed at accelerating its expansion into tokenised securities, derivatives and other asset classes.
WTI’s pullback into $79–82 is the first major test of the bullish Elliott Wave count, with buyers targeting a renewed break above $85.

BitDelta Securities has secured a full CMA Category 5 licence in the UAE and opened a regulated office in Business Bay, Dubai. The firm operates as an introducing broker, connecting investors with licensed international brokers across multiple asset classes, with CEO Dr. Demetrios Zamboglou commenting on the milestone.
Index volatility is asleep while single stocks fight it out underneath, credit refuses to confirm the equity rally, and a bare macro calendar hands next week to oil.
Digital assets and FX brokerage GC Exchange FZE (GCEX) has appointed Mohammed A. Mulla as a Board Member of its Dubai-based entity, part of the wider GCEX Group.
Learn what Blockchain-as-a-Service is, how it works, and why businesses are using BaaS to build blockchain applications without managing infrastructure.
CFDs vs stocks compared on leverage, ownership, costs, dividends, taxes, and risk. Learn the differences between stocks and CFDs and discover which suits your investing or trading goals.


