just now

Liquidity Finder Ltd is incorporated in England and Wales, company number 10610740, registered address 167-169 Great Portland Street, Fifth Floor, London W1W 5PF, United Kingdom.
Published: just now

The jobs report is out, and it gave markets just enough to keep the dollar story alive without making this a clean victory lap for USD bulls.
US nonfarm payrolls rose by 115,000 in April, beating expectations of 62,000, while the unemployment rate held at 4.3%. March was also revised higher to 185,000, so the labour market is slowing, but it is not exactly breaking either, according to BLS and Reuters.
| Event | Previous | Forecast | Actual |
| Nonfarm Payrolls | 185K | 62K | 115K |
| Unemployment Rate | 4.3% | 4.3% | 4.3% |
That keeps the market in a slightly awkward middle zone. The data was not weak enough to drag rate-cut hopes back into the centre of the conversation, but it was also not hot enough to instantly turn into an inflation-panic story.
Part of the reason this matters is that equities have already been leaning into optimism this week. The Iran war headlines have flipped back and forth, but markets have mostly treated earnings as the bigger driver, especially around AI and semiconductors.
The confusion for many people will be that backdrop conditions: War, inflation, strong jobs and rate holds, are all great for the dollar. And yet, equities continue to rally.
With this NFP release, that trend only continues. Fundamentally speaking, today's NFP is good for dollar, bad for markets; but it's very likely that AI bulls won't care.
Regardless, let's break down what we need to see on DXY to begin fathoming a correction on equities.
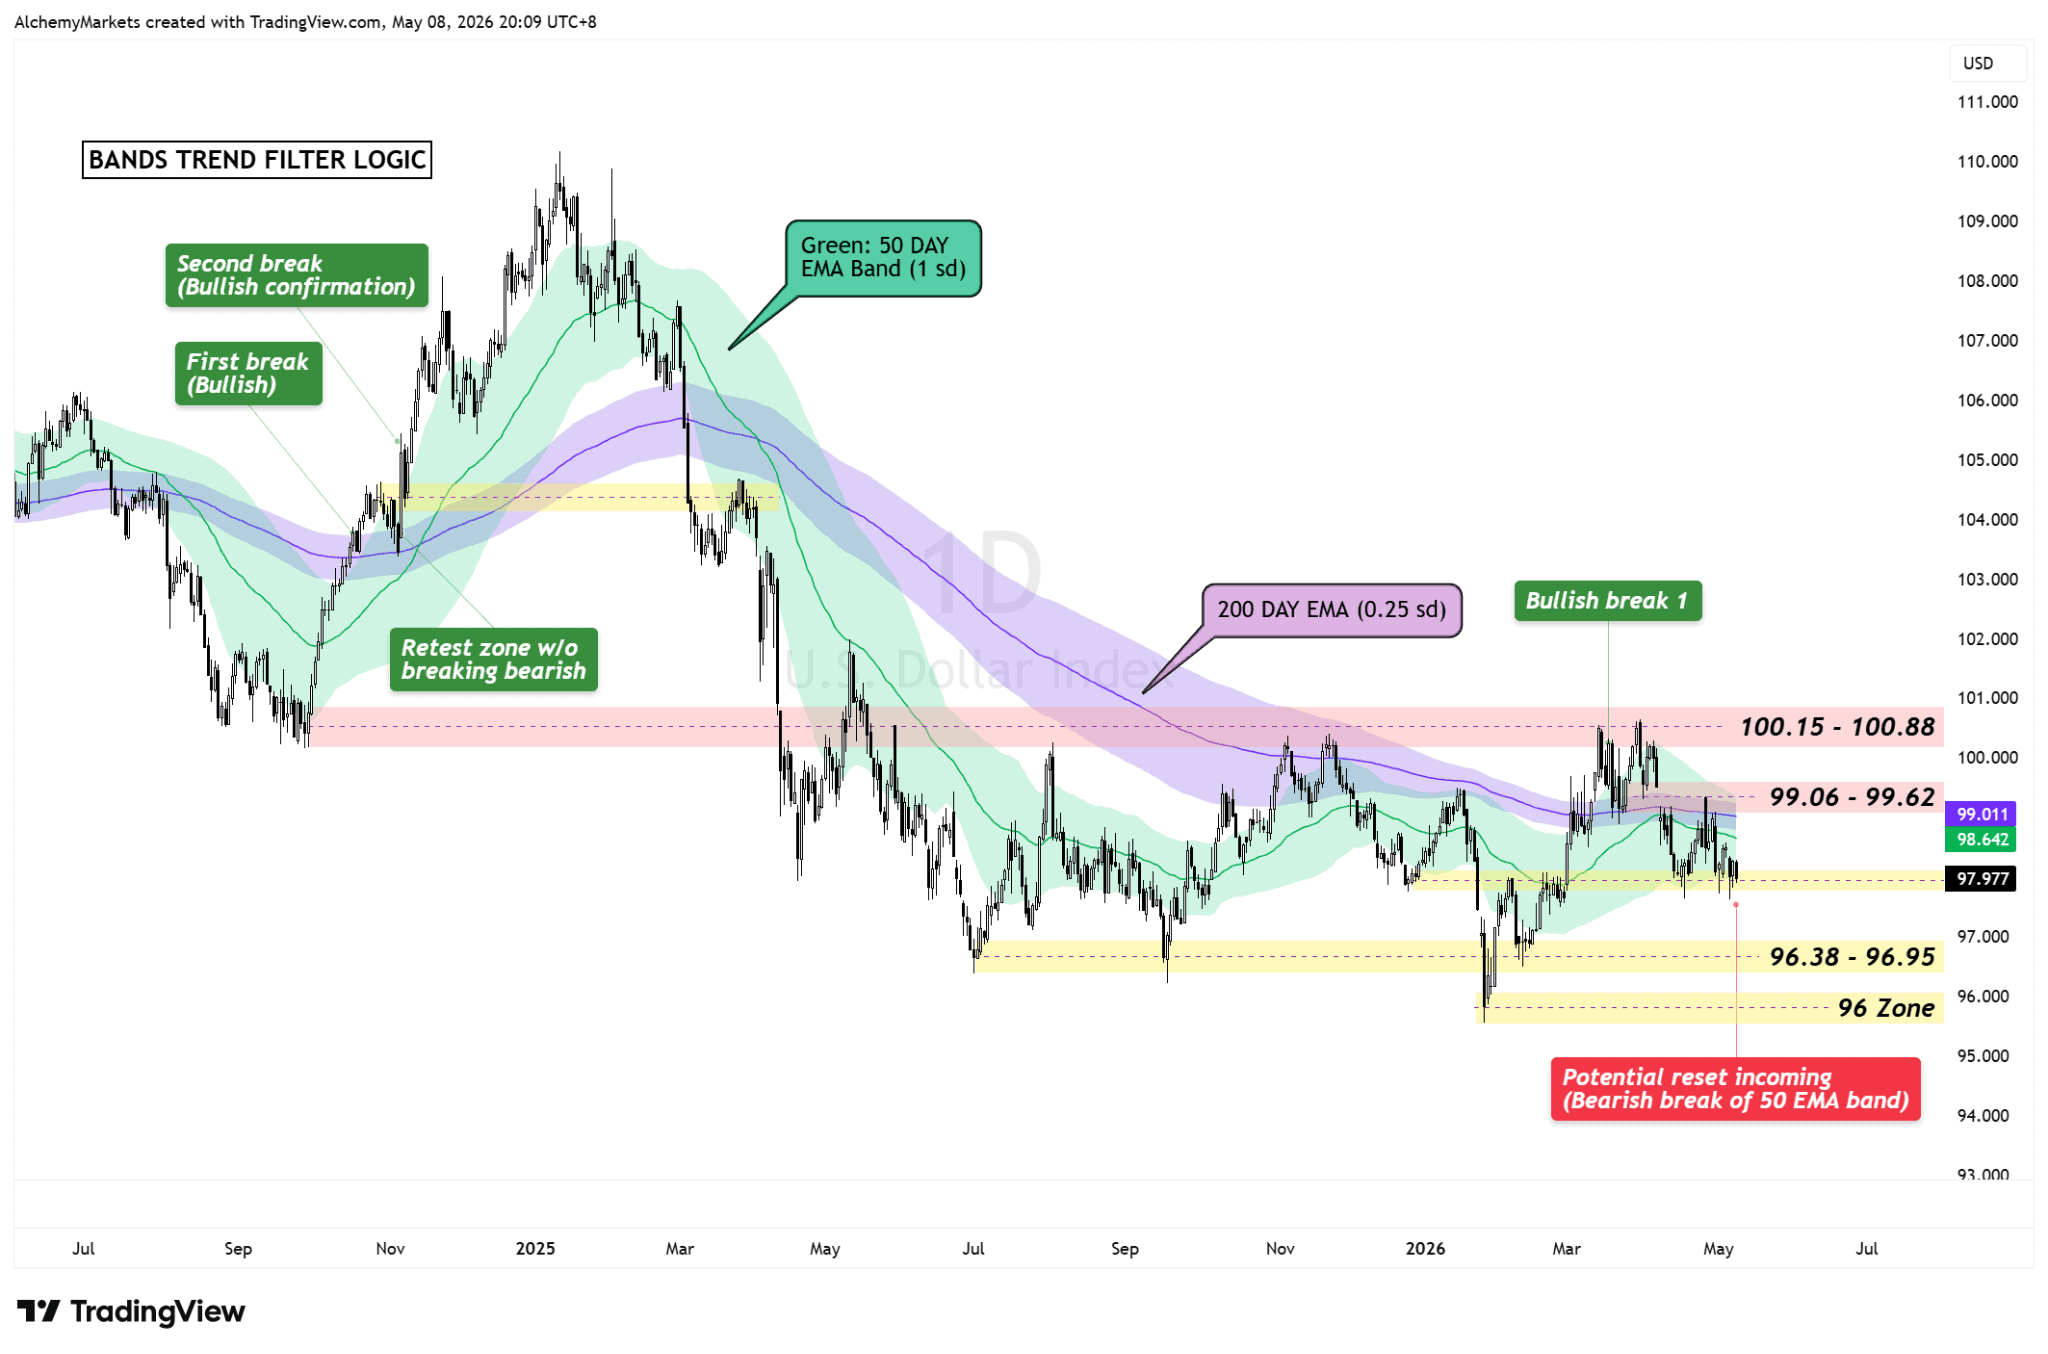
DXY daily chart: 50-day EMA band retest after the first bullish break.
For DXY, the setup is close, but not fully confirmed yet.
The dollar recently tested the 96 zone, bounced, and made an initial bullish break above the 50-day EMA band. Under this band logic, the first upside break is the early signal that momentum may be shifting.
The cleaner confirmation usually comes when price retests the band, avoids losing the opposite edge, and then pushes higher again.
But, we are now seeing some weakness. For the second time now, DXY is retesting its opposite edge (lower band) and potentially threatening a break down.
While the NFP beat gives dollar bulls a better reason to defend the area, but price still needs to show that the retest can hold.
If DXY can hold or reclaim this band area and push back through 99.06-99.62, the recovery setup looks more convincing. From there, the next zone sits around 100.15-100.88.
If the lower side of the band fails instead, the earlier bullish break starts to look more like another failed bounce, and the 96.38-96.95 zone comes back into view.
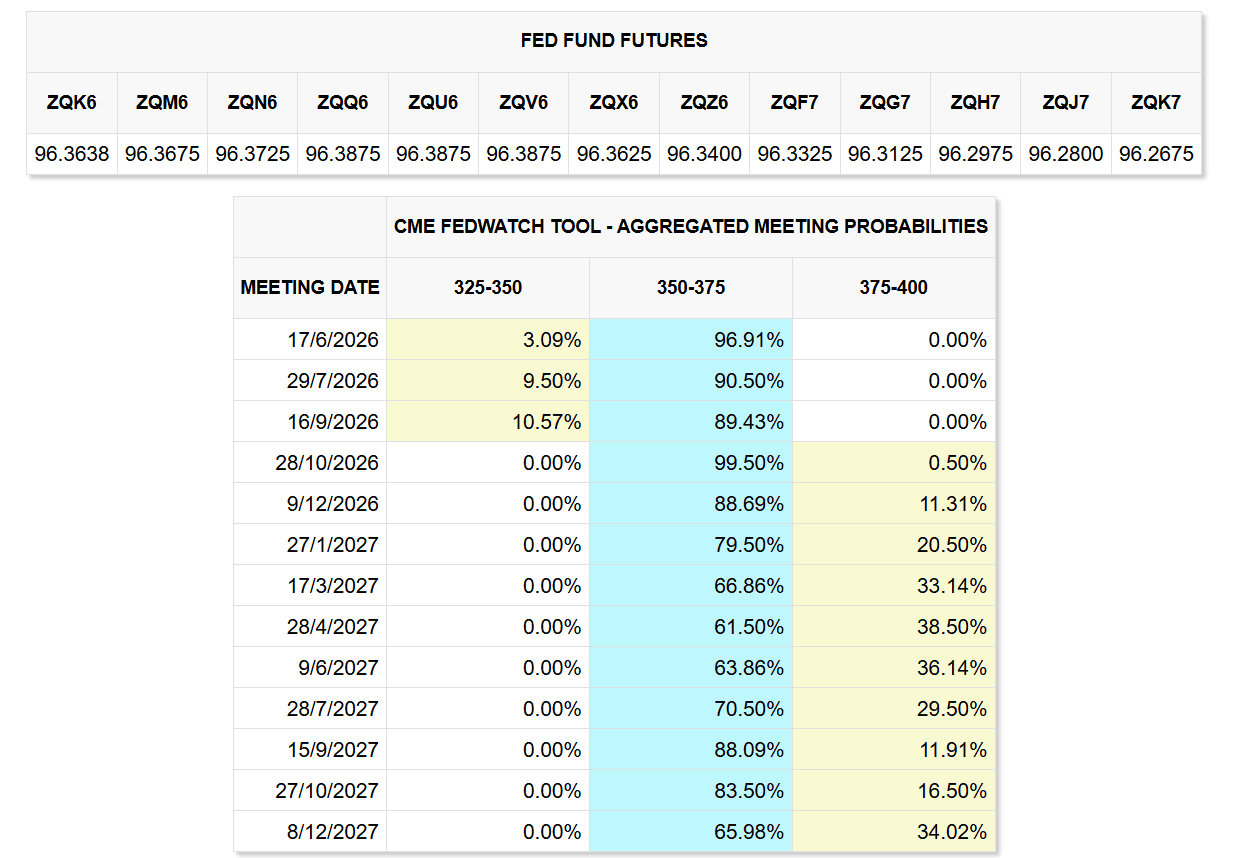
CME FedWatch probabilities: markets still lean heavily toward rates being held.
Fed pricing is the other half of the DXY story.
The Fed held rates at 3.50% to 3.75% in April and kept its focus on maximum employment and returning inflation to its 2% objective. It also flagged Middle East developments as a source of uncertainty, which matters when oil and inflation risk are still part of the background, according to the Federal Reserve.
After NFP, the market still leaned toward a hold rather than a fresh cutting cycle. Reuters reported that the chance of a December hike fell to 18% from around 23%, while the odds of rates staying unchanged rose to 74.1% from 70.1%, based on CME FedWatch pricing.
So this is not really a “cuts are back” setup. It is closer to a “labour is holding up, rates are still being held, and dollar bulls have not been kicked out yet” setup.
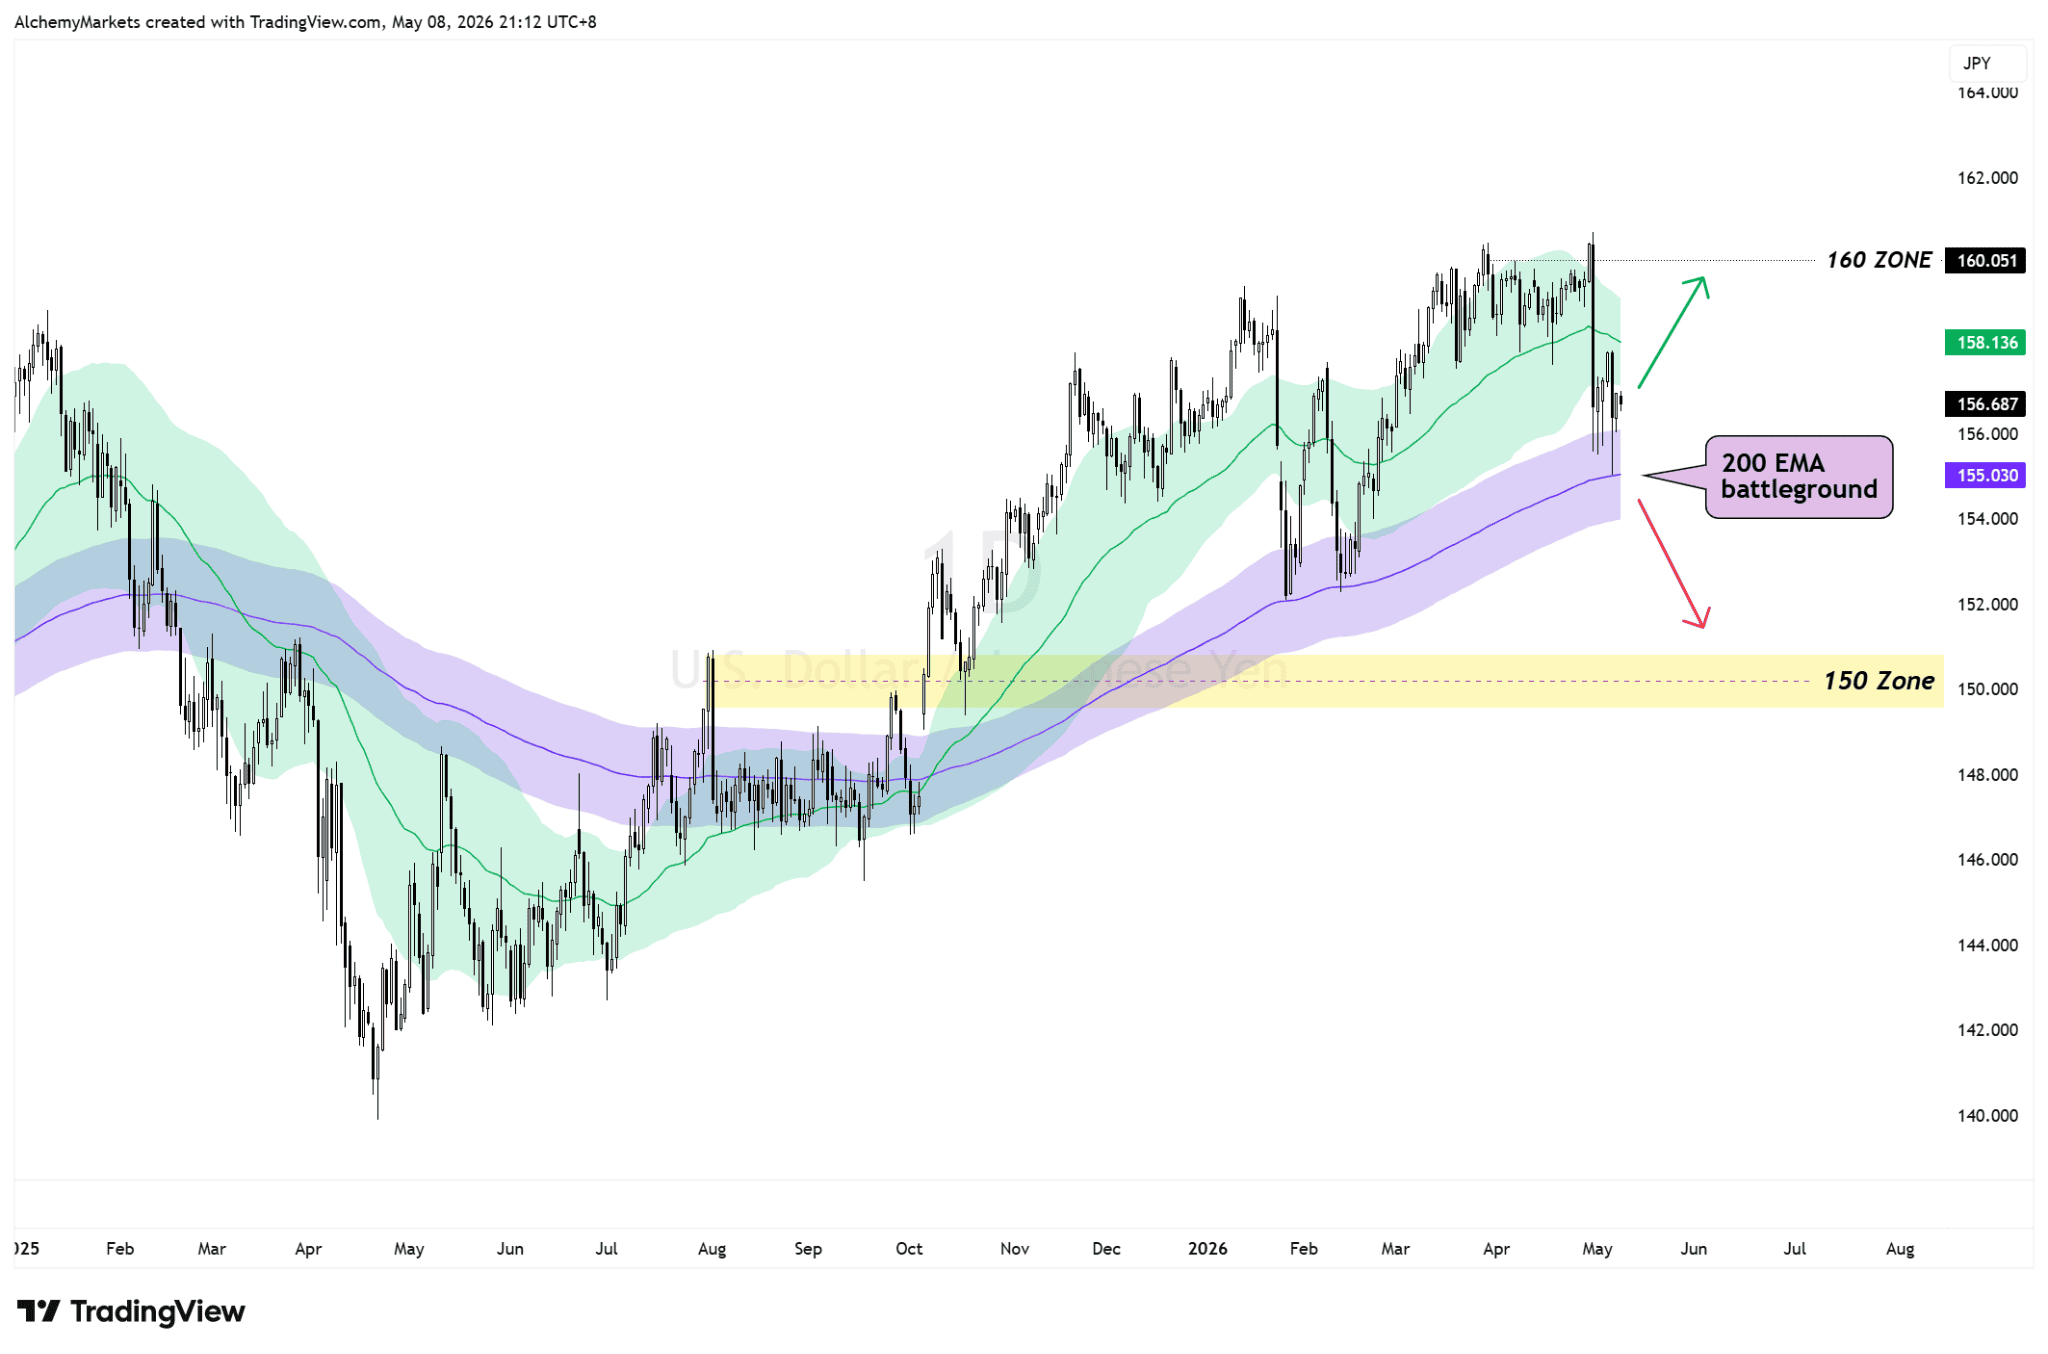
USD/JPY daily chart: price holds near the 200 EMA battleground after intervention pressure.
Japanese Yen is surviving partly because of interventions, but the question is - how long can that last?
Reuters reported that Japan intervened again during the early May holiday period, with Bank of Japan data suggesting officials may have spent around 5 trillion yen, or roughly $32 billion, between May 1 and May 6, following earlier suspected intervention of around $35 billion on April 30.
While USD/JPY holds the 200 EMA area, the technical case still leans constructive, with the 160 zone remaining the obvious upside magnet. If intervention pressure keeps capping the pair and price loses the 200 EMA instead, the risk is a deeper unwind toward the 150 zone.
In plain terms: The chart supports another push higher, but Japan is clearly trying to stop the move from turning too one-sided.
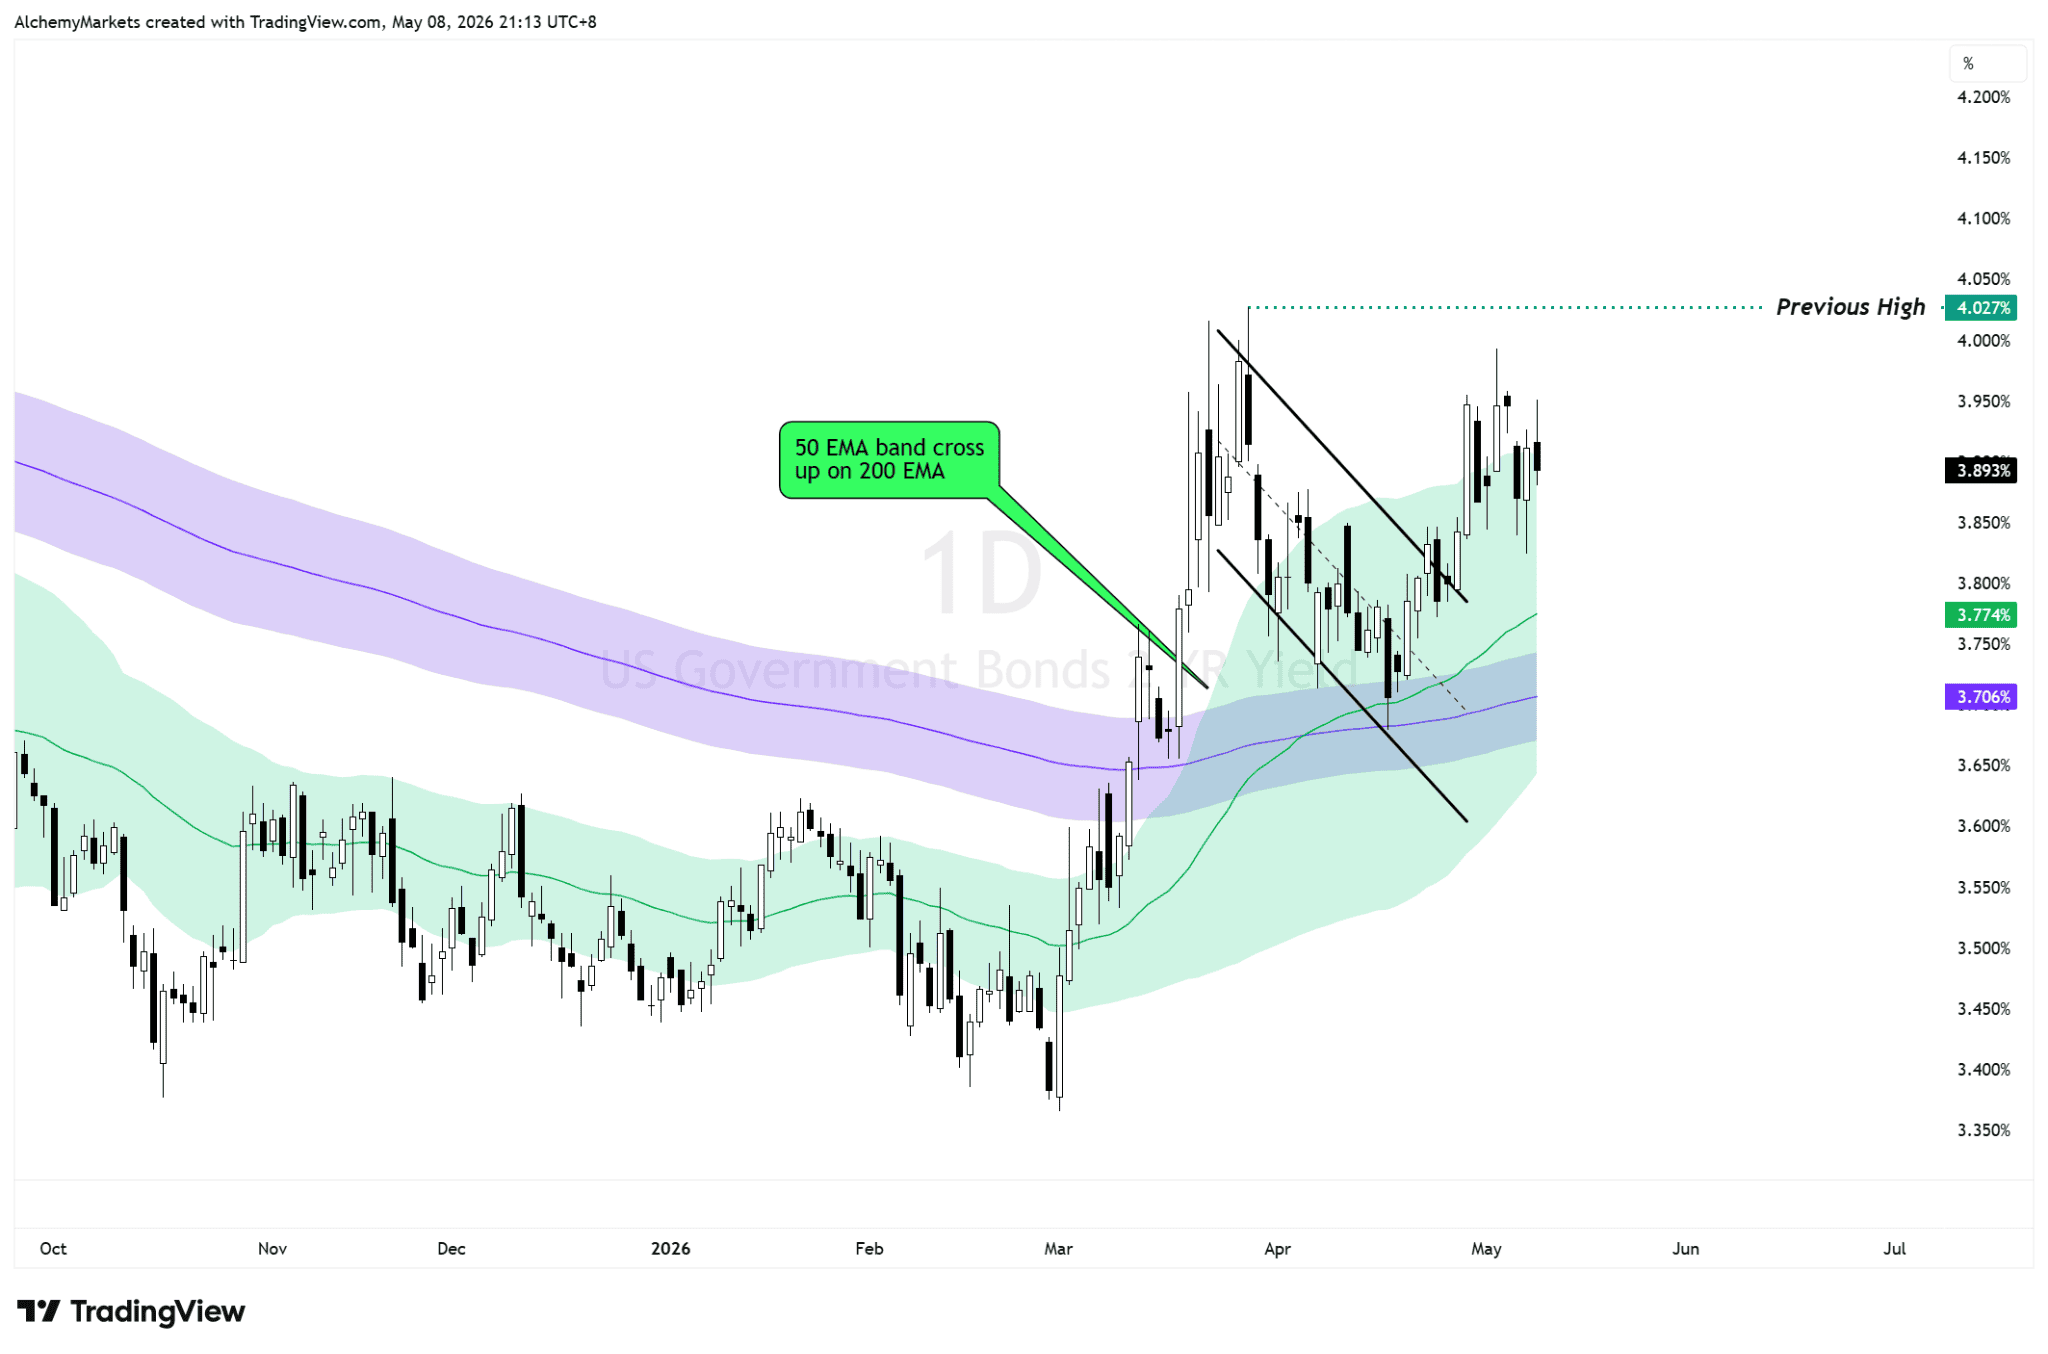
US 2-year Treasury yield chart: Fed-sensitive yield structure remains technically bullish.
The 2-year Treasury yield has broken out of its previous downward structure (bull flag), the 50 EMA band has crossed above the 200 EMA, and yields are still holding above that moving-average structure.
That fits the FedWatch picture pretty well. Markets are not pricing an aggressive return to cuts; they are mostly pricing a Fed that can stay on hold because the labour market is still firm enough.
The next area to watch is the previous high near 4.03%. A push through that area would likely support DXY and USD/JPY further, while a failed move back under the EMA band would weaken the dollar recovery setup.
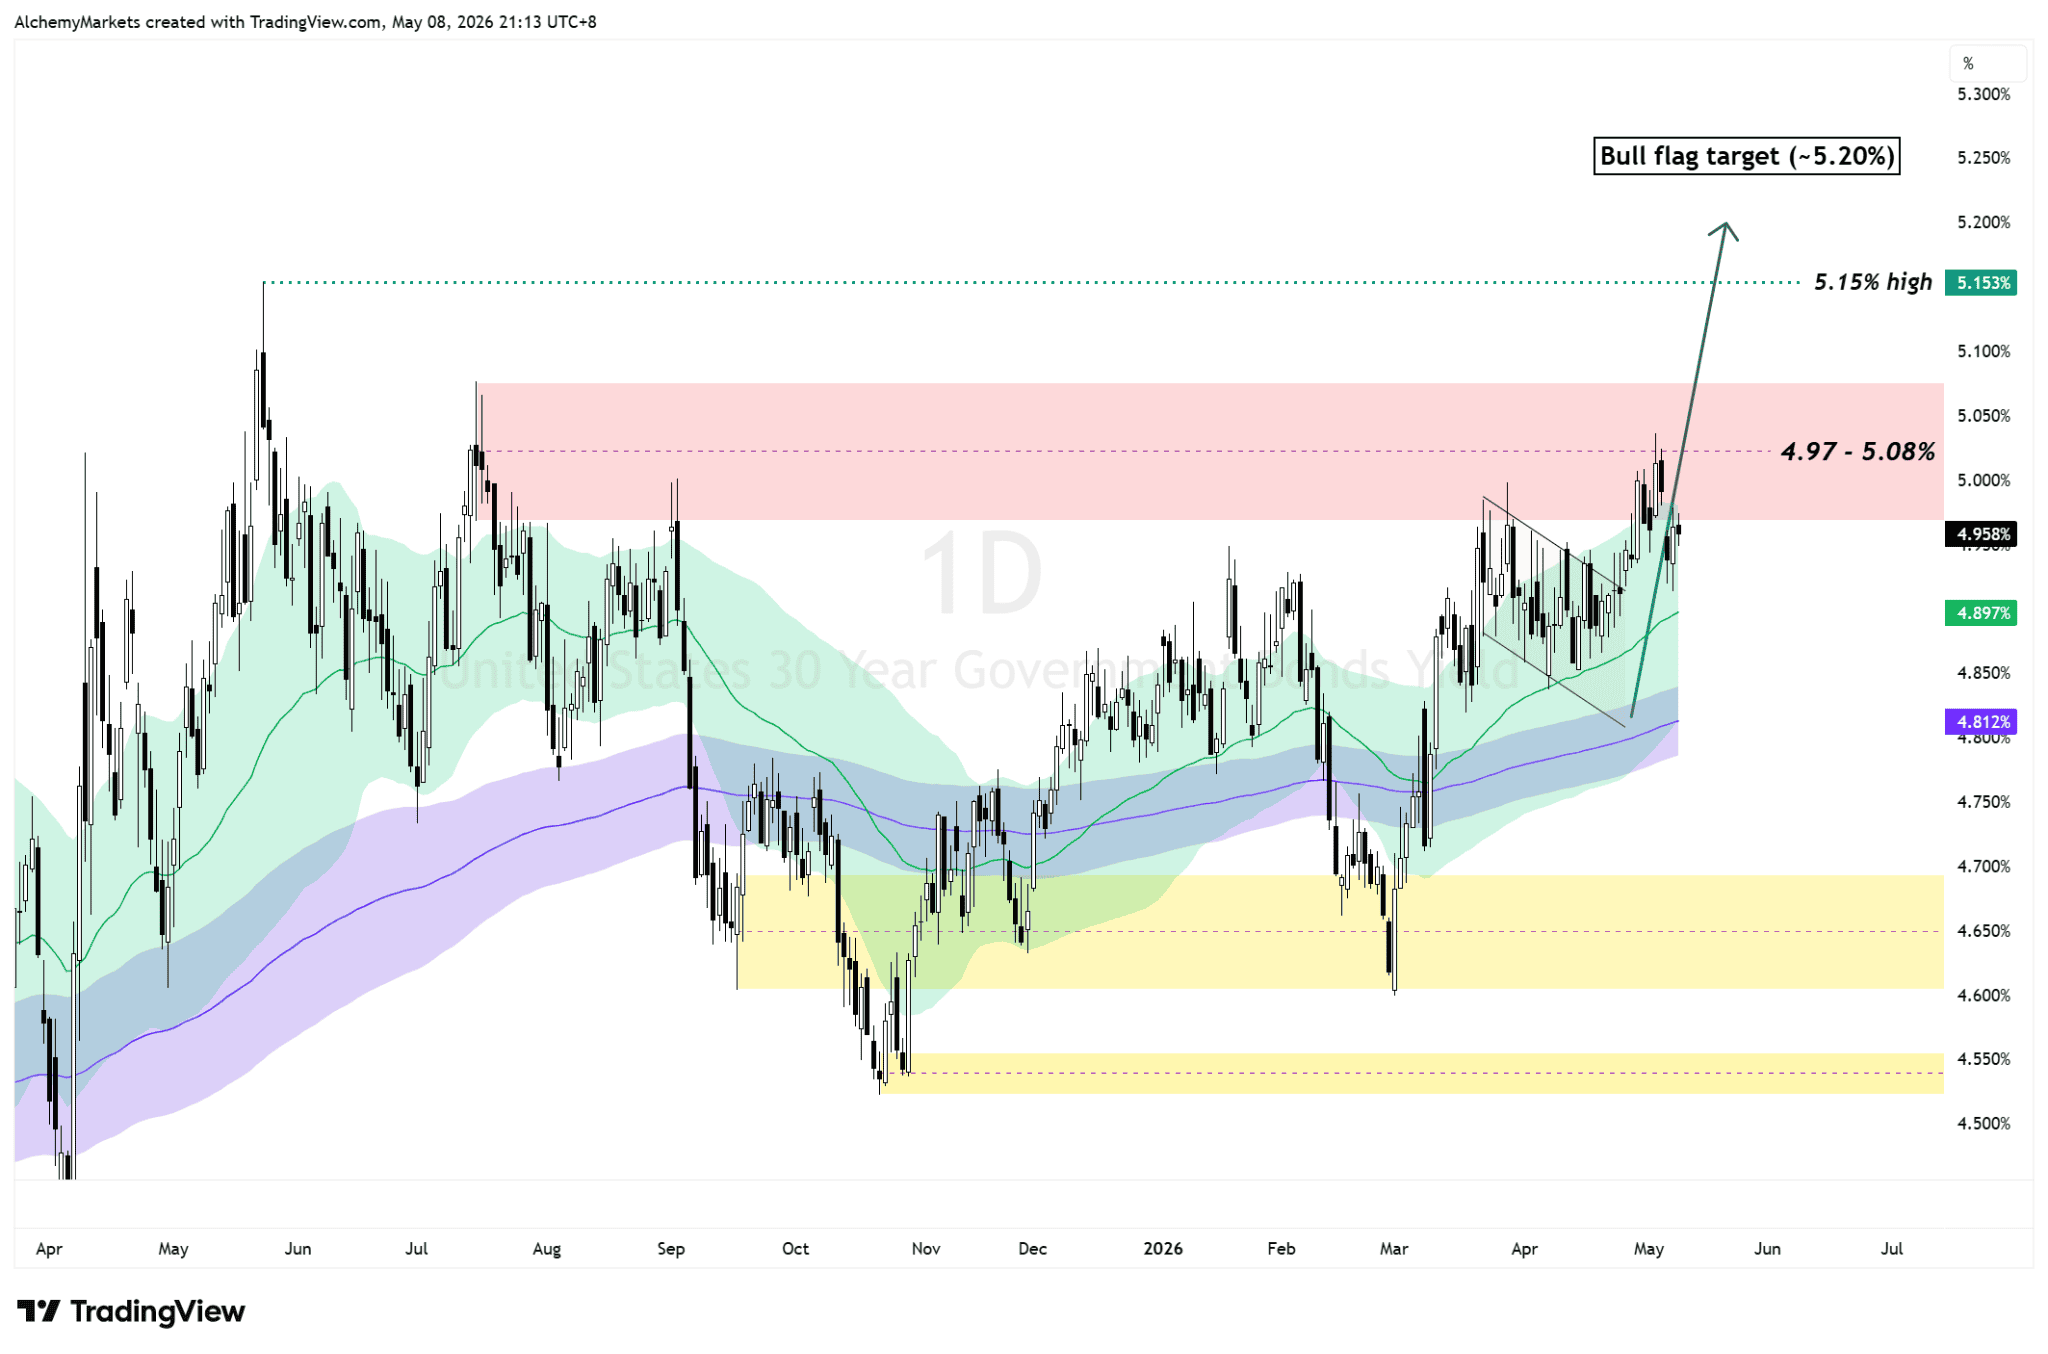
US 30-year Treasury yield chart: long-end yield presses into the 4.97%-5.08% zone.
The 30-year yield is the heavier long-end story.
It is pressing into the 4.97%-5.08% zone, with the previous high near 5.15% and a rough bull flag target around 5.20% if the breakout follows through.
That 5% level is where the equity rally can start to feel less comfortable, even if earnings and AI optimism are still doing their job - because the backdrop of oil supply shock, sticky inflation, and AI capex still exists. This is especially true if yields hold at 5% after breaking through the current zone.
Today’s NFP report was good enough to keep the soft-landing window open, but not weak enough to bring easy Fed-cut hopes back in any serious way.
For DXY, the focus is whether the 50 EMA band retest can hold.
For USD/JPY, the focus is whether 200 EMA support can survive intervention pressure.
For Treasury yields, the important point is that the 2Y and 30Y charts were already technically bullish, and NFP may now decide whether traders keep respecting those setups.
The market still has room to climb from here, especially if earnings optimism stays in control.
But if yields keep leaning higher, this rally gets a lot less comfortable, even if earnings still look optimistic on the surface.
DISCLAIMER: For educational purposes only. Trading comes with substantial risk, leading to possible loss of your capital. Traders are advised to do their own due diligence before investing.
Alchemy Markets is a multi-asset brokerage providing retail traders with the same elite trading conditions, tools, and transparency typically reserved for institutions.
Select the categories and companies you wish to follow directly to your person rss feed.
Create Custom RSS FeedSign up and join over 5,000 professional members who receive personalized news alerts, curated professional connections, and more for free!
Retail futures trading leader NinjaTrader Group has appointed Mark Omens as Senior Vice President, Commercial Strategy, bringing a 25-year veteran of derivatives marketplace CME Group into a newly created role focused on exchange partnerships and enterprise growth.
Gold Price Action Forecast: Will XAU/USD Drop to $3930? Meta Description: Read our Gold price action forecast to see if XAU/USD will drop to $3930.
BitDelta Securities Financial Services LLC (“BitDelta Securities”) today announced that it has received full regulatory approval from the Capital Market Authority (“CMA”) of the United Arab Emirates under the Category 5 — Arrangement and Advice license framework (License No. 20200000439). The approval follows the firm's receipt of In-Principal Approval earlier this year and represents the successful conclusion of the CMA's full licensing process, including the satisfaction of capital requirements, governance appointments, and operational setup.
Crypto.com has received a $400 million strategic investment from Citadel Securities, valuing the firm at $20 billion. It marks the first institutional funding round in the company's history, aimed at accelerating its expansion into tokenised securities, derivatives and other asset classes.
WTI’s pullback into $79–82 is the first major test of the bullish Elliott Wave count, with buyers targeting a renewed break above $85.

BitDelta Securities has secured a full CMA Category 5 licence in the UAE and opened a regulated office in Business Bay, Dubai. The firm operates as an introducing broker, connecting investors with licensed international brokers across multiple asset classes, with CEO Dr. Demetrios Zamboglou commenting on the milestone.
Index volatility is asleep while single stocks fight it out underneath, credit refuses to confirm the equity rally, and a bare macro calendar hands next week to oil.
Digital assets and FX brokerage GC Exchange FZE (GCEX) has appointed Mohammed A. Mulla as a Board Member of its Dubai-based entity, part of the wider GCEX Group.
Learn what Blockchain-as-a-Service is, how it works, and why businesses are using BaaS to build blockchain applications without managing infrastructure.
CFDs vs stocks compared on leverage, ownership, costs, dividends, taxes, and risk. Learn the differences between stocks and CFDs and discover which suits your investing or trading goals.


