just now

Liquidity Finder Ltd is incorporated in England and Wales, company number 10610740, registered address 167-169 Great Portland Street, Fifth Floor, London W1W 5PF, United Kingdom.
Published: just now

Q1 2026 sits at a point in the market cycle where many of the obvious questions have already been answered. Inflation is no longer accelerating, the Federal Reserve is no longer tightening aggressively, and recession fears that dominated prior years have eased.
What remains unresolved is how much growth is left, how patient policy will be, and how markets behave once relief has been priced in.
This outlook focuses on that transition. Not on calling a top, but on understanding where optimism remains justified and where risks are quietly building beneath the surface.
What does that mean for equities in the first quarter of 2026?
The macro backdrop has moved beyond crisis avoidance and into second-order effects. Markets are increasingly focused on the idea of a potential yen carry trade unwind, especially as US policy turns more accommodative and Japanese yields rise.
That concern is not baseless, but it is also being overstated by many traders.
At this stage, there are no technical indications that a systemic unwind is unfolding. Price action across equities, volatility, and credit markets does not confirm crisis conditions. What we are seeing instead is heightened sensitivity to a risk that traders know exists, but cannot yet see.
In other words, the fear is visible, but the damage is not.
This creates an important distinction for Q1 2026:
The prevailing mode is therefore cautiously bullish, not complacent. Participation remains justified, but awareness matters more than it did earlier in the cycle.
To understand why this risk is being talked about at all, we need to look at Japanese yields.
Before diving into our equities analysis, let’s first set the big picture.
For years, Japanese bond yields barely moved. That made the yen cheap to borrow and easy to sell, which helped fund global risk trades across equities, credit, and commodities.
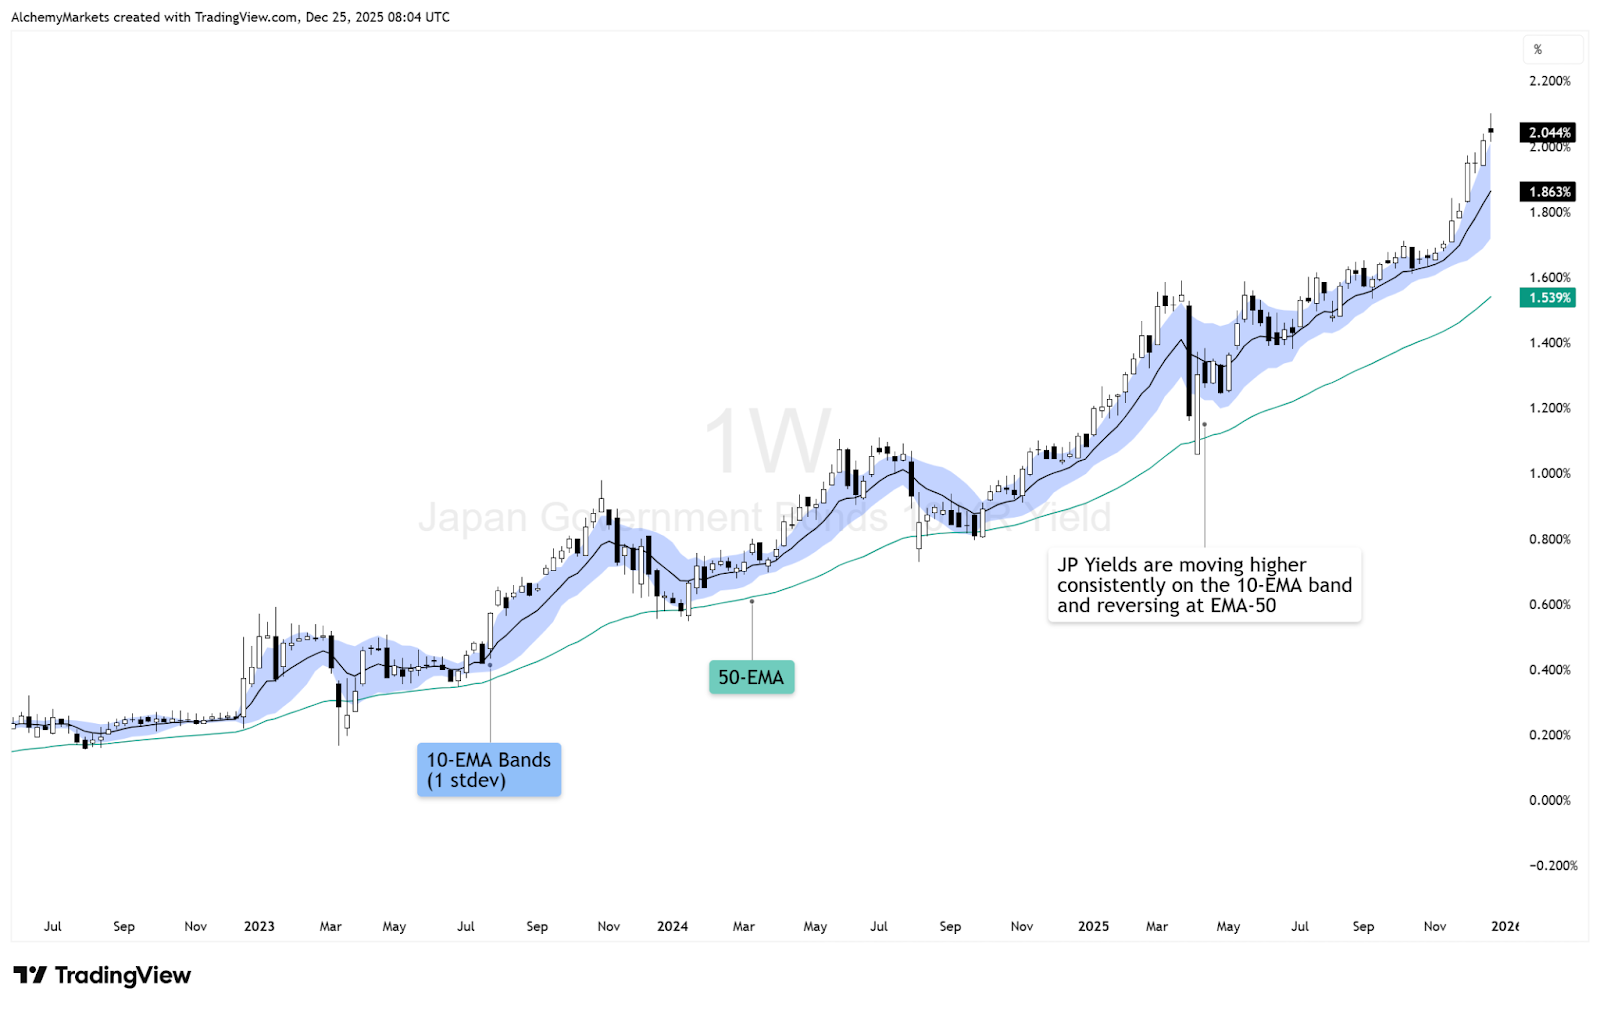
That regime has clearly changed in 2025. Japanese 10-year government bond yields have risen to their highest level in over a decade, pushing above key technical levels and trending firmly above the 10-EMA. This is not a short-term spike. It reflects a structural shift away from extreme yield suppression.
What the magnitude tells us:
This explains why traders are alert. However, it is important to be precise.
Historically, carry trade stress only becomes destabilising when yield moves are fast, disorderly, or policy-forced, particularly in correlation to the US 10 Year Yields.
If we take a look at the US 10 year yields MINUS Japanese 10 year yield chart (Weekly timeframe), the context becomes obvious:
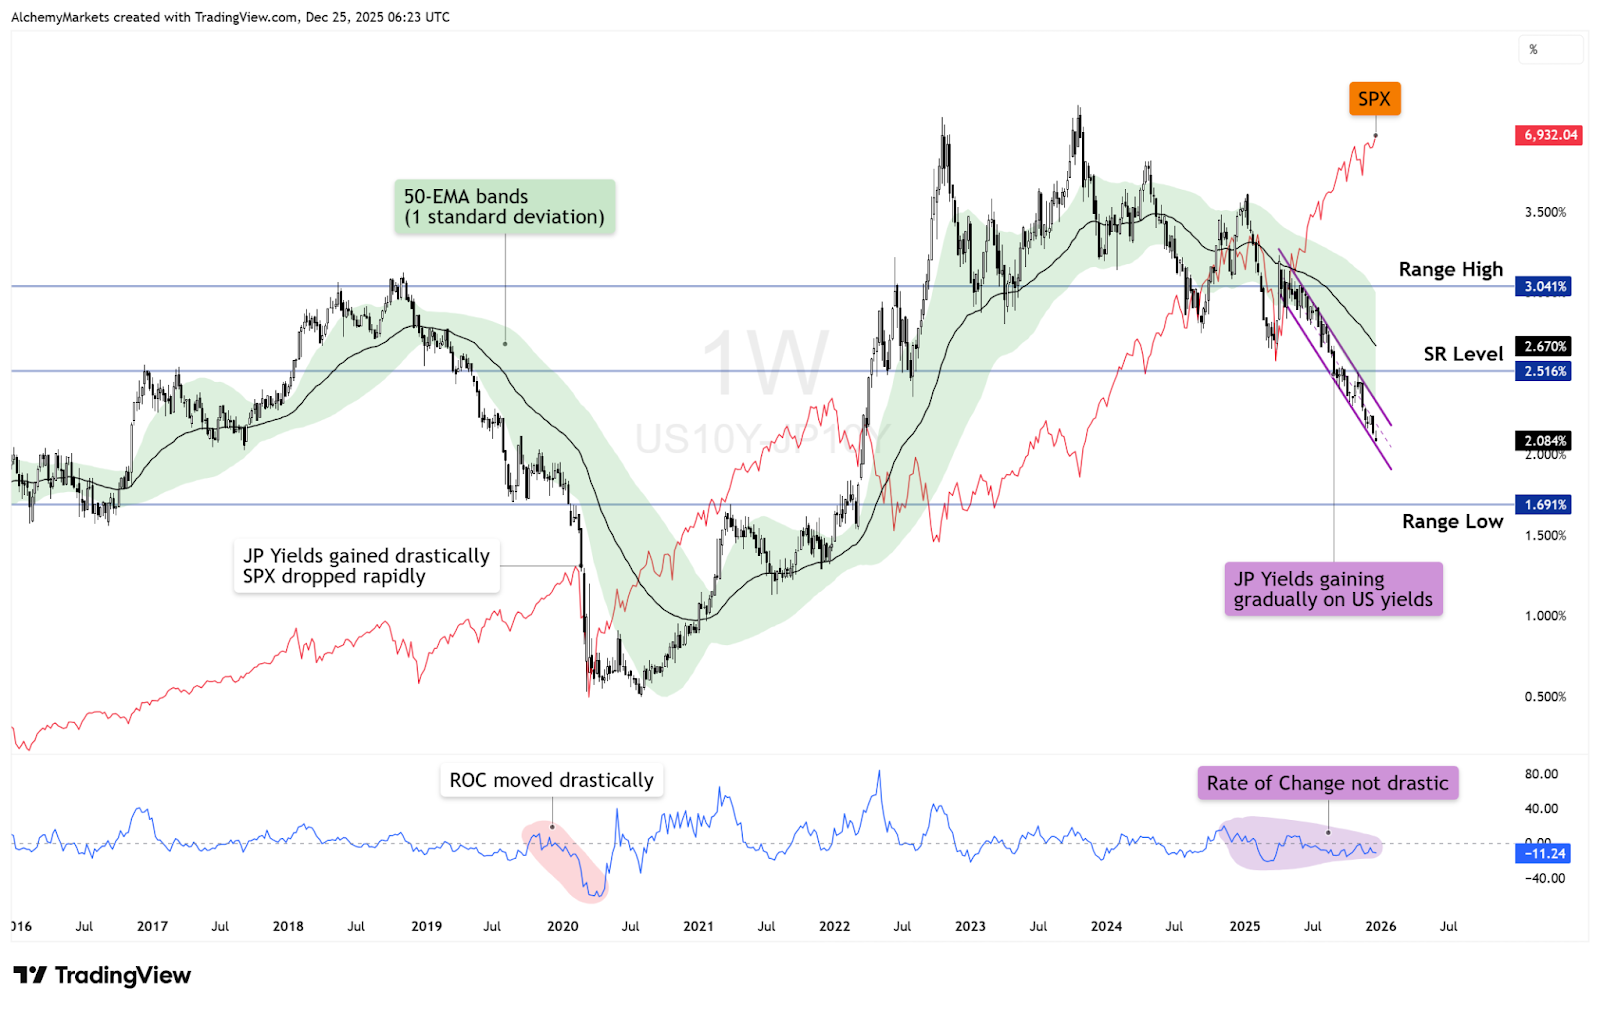
Notice how the S&P 500 typically suffers sharp drawdowns only when US yields collapse rapidly against their Japanese counterparts.
The 2020 Comparison: In the first highlighted section, the Rate of Change (ROC) moved drastically. As Japanese yields gained ground rapidly, the SPX experienced a sharp, vertical drop.
The 2025 Context: Current data shows a different story. While Japanese yields are gaining, the transition has been gradual and technically orderly. The ROC is currently stable, rather than impulsive.
Therefore, the implication is not an imminent crisis, but reduced tolerance for excess leverage. Risk-taking adjusts before it unwinds. That is the phase markets are currently in.
US yields reinforce this interpretation. The 10Y–2Y spread on the monthly chart suggests the most restrictive phase of policy is behind us. The curve has begun to normalise, signalling easing pressure rather than renewed stress.
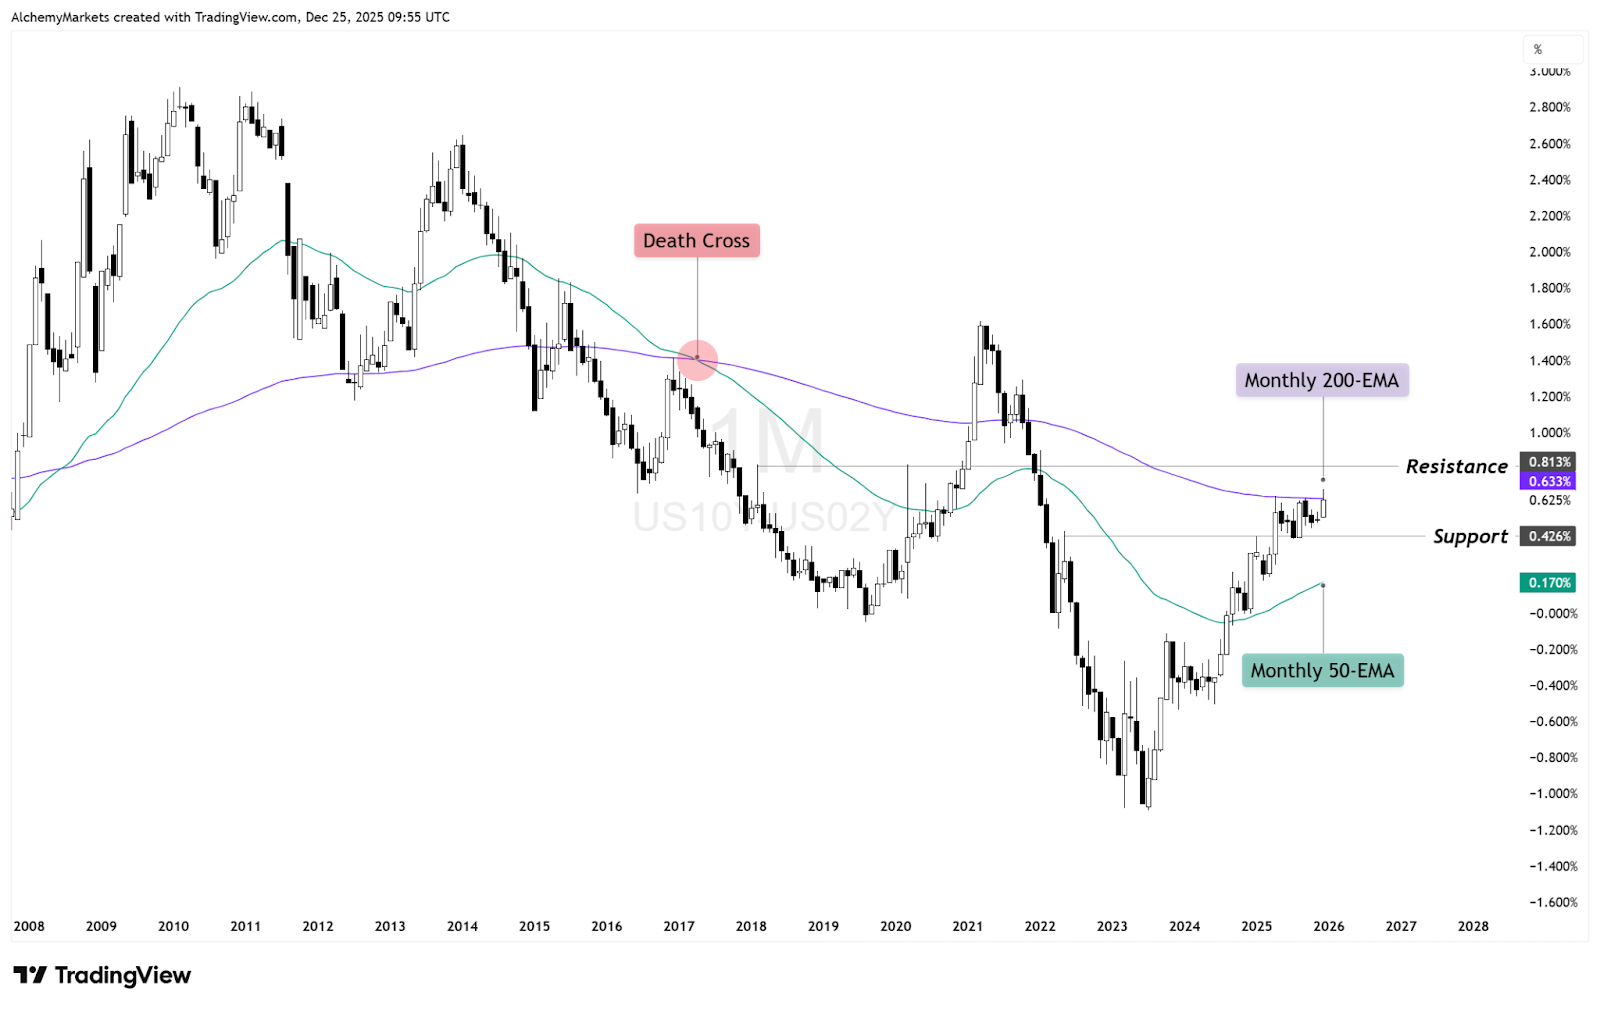
For traders, this means:
Lower policy stress supports equities, but it does not eliminate funding risks elsewhere. It simply prevents those risks from becoming acute.
From a technical perspective, the spread is approaching overhead resistance near the 200-EMA on the monthly chart, which could lead to a temporary pause (consolidation), or in the worst case, rejection.
That said, the policy transition toward easing is now underway, so a harsh rejection is unlikely. The remaining question for 2026 is not if but when and how quickly rates are cut. Move too quickly, and funding markets, particularly yen-based carry trades, may react abruptly.
The S&P 500 remains the anchor for global risk sentiment. Here we have the S&P 500 (CFD: US500 on Alchemy Markets) daily timeframe, with volume-profile based trading levels.
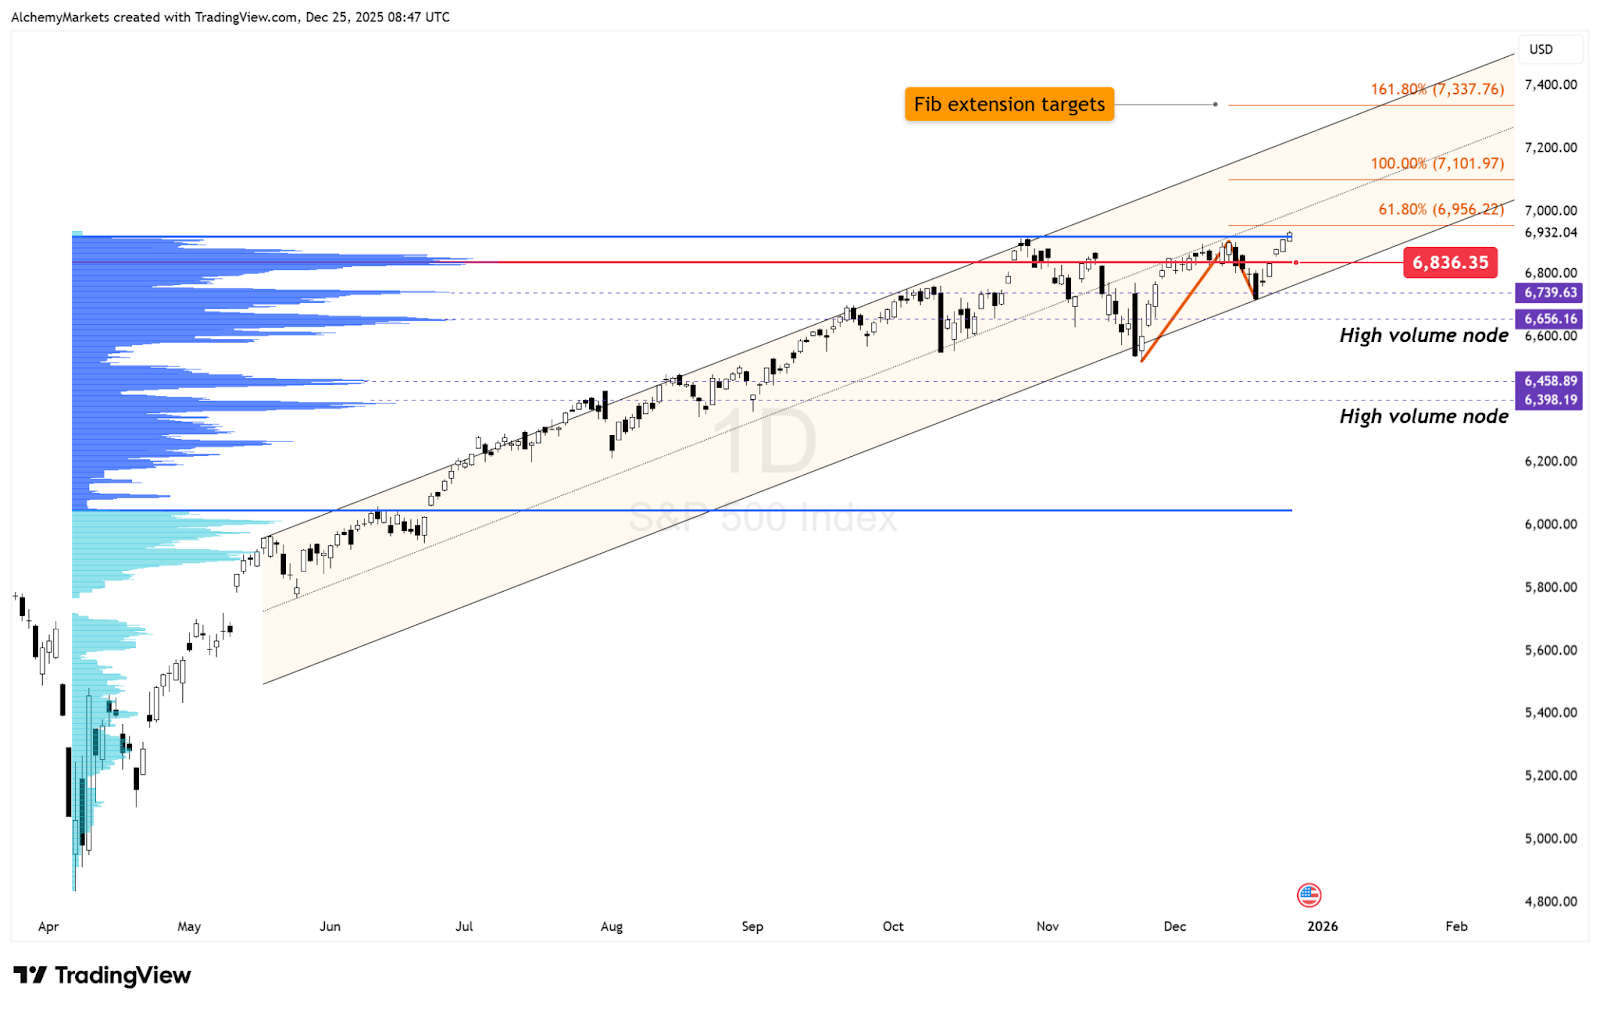
From the chart, the message is straightforward:
However, the character of price action has changed.
Momentum has cooled, and gains are becoming harder-earned. This is consistent with a market that has already priced policy relief and now requires confirmation through earnings and participation.
Possible outcomes in Q1 2026:
The S&P is not signalling danger. It is signalling maturity (end of cycle behaviour).
The Nasdaq presents a more fragile picture. Here we have the Nasdaq (CFD: USTEC on Alchemy Markets) daily timeframe.
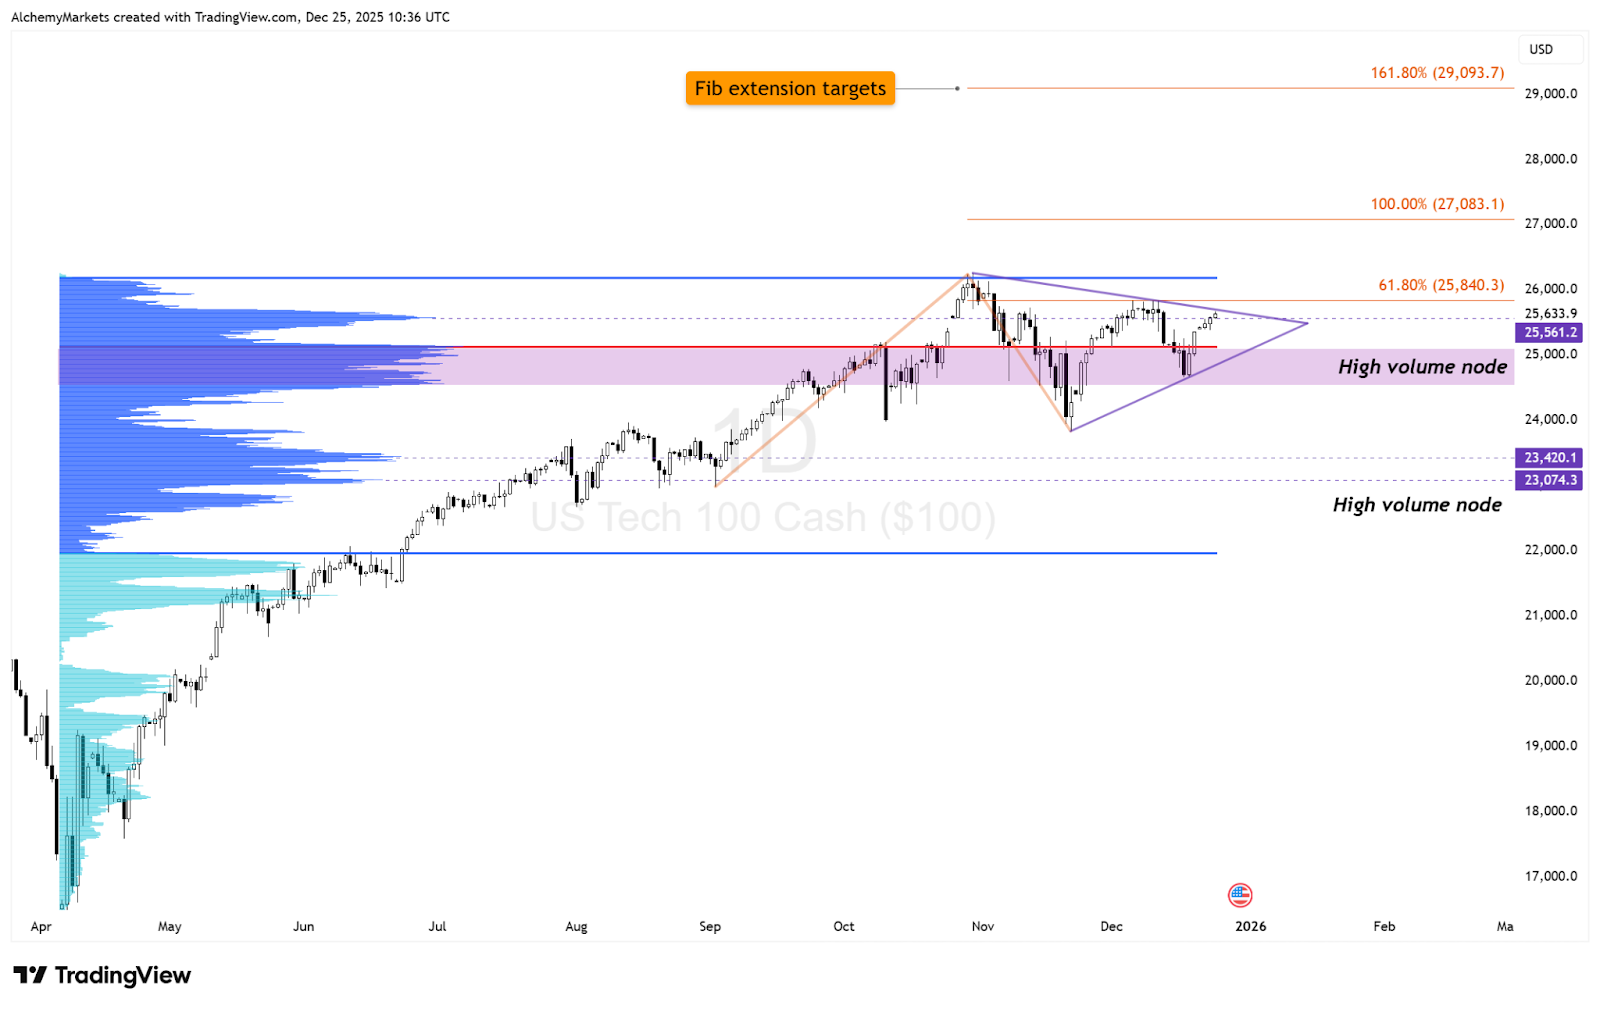
While price has not broken down, the chart shows:
This reflects leadership fatigue rather than outright risk aversion. Moving into Q1, traders should be aware of Nasdaq’s increased sensitivity to earnings and positioning.
Large-cap growth has carried the market for much of the cycle. As funding conditions tighten slightly and policy becomes less of a tailwind, that leadership is being challenged.
For Q1 2026, this means:
Importantly, weakness here does not automatically translate into a bearish market. It signals rotation within equities rather than a broader retreat from risk.
The Dow continues to play a confirming role. Here we have the Dow Jones (CFD: US30 on Alchemy Markets) daily timeframe.
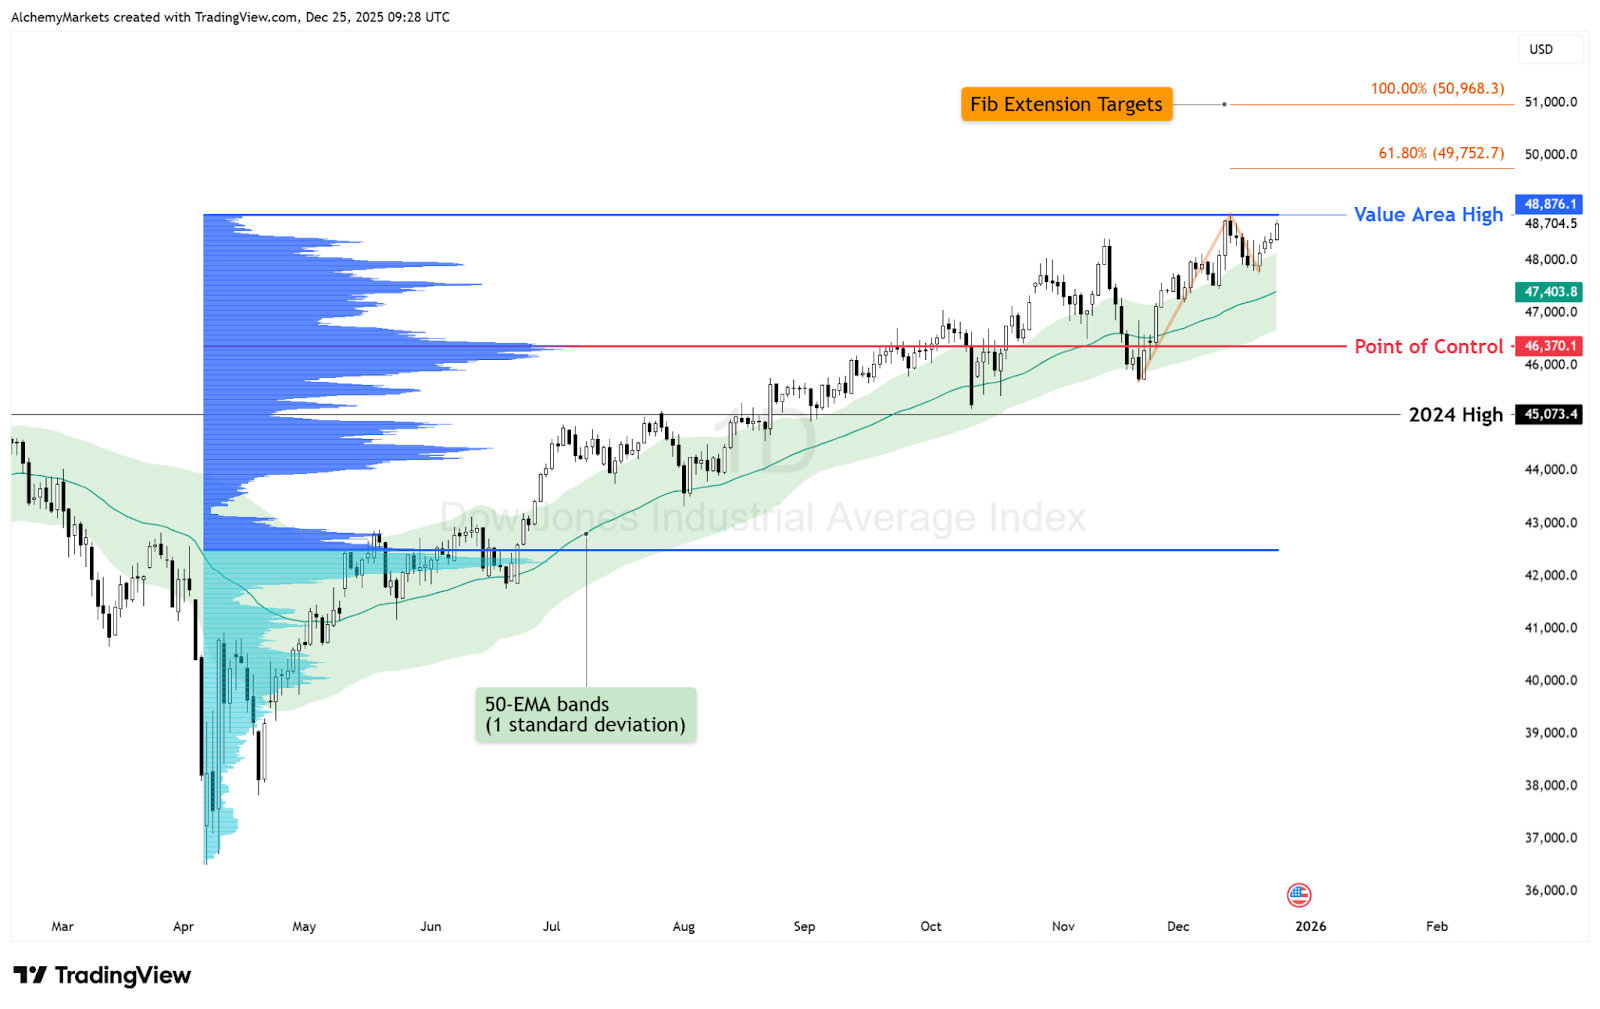
From a technical perspective:
The Dow’s healthier Q4 performance compared to the Nasdaq points to rotation within the market, consistent with late-cycle behaviour.
Rather than a broad risk-off move, investors appear to be shifting away from rate-sensitive tech leadership toward areas offering cash flow stability and valuation support.
For Q1, this means:
As long as the Dow holds its structure, it reinforces the idea that risk appetite remains present, even if it is being expressed more selectively.
European equities remain constructive, but less self-driven. Here we have the Dax (CFD: DE30 on Alchemy Markets) weekly timeframe.
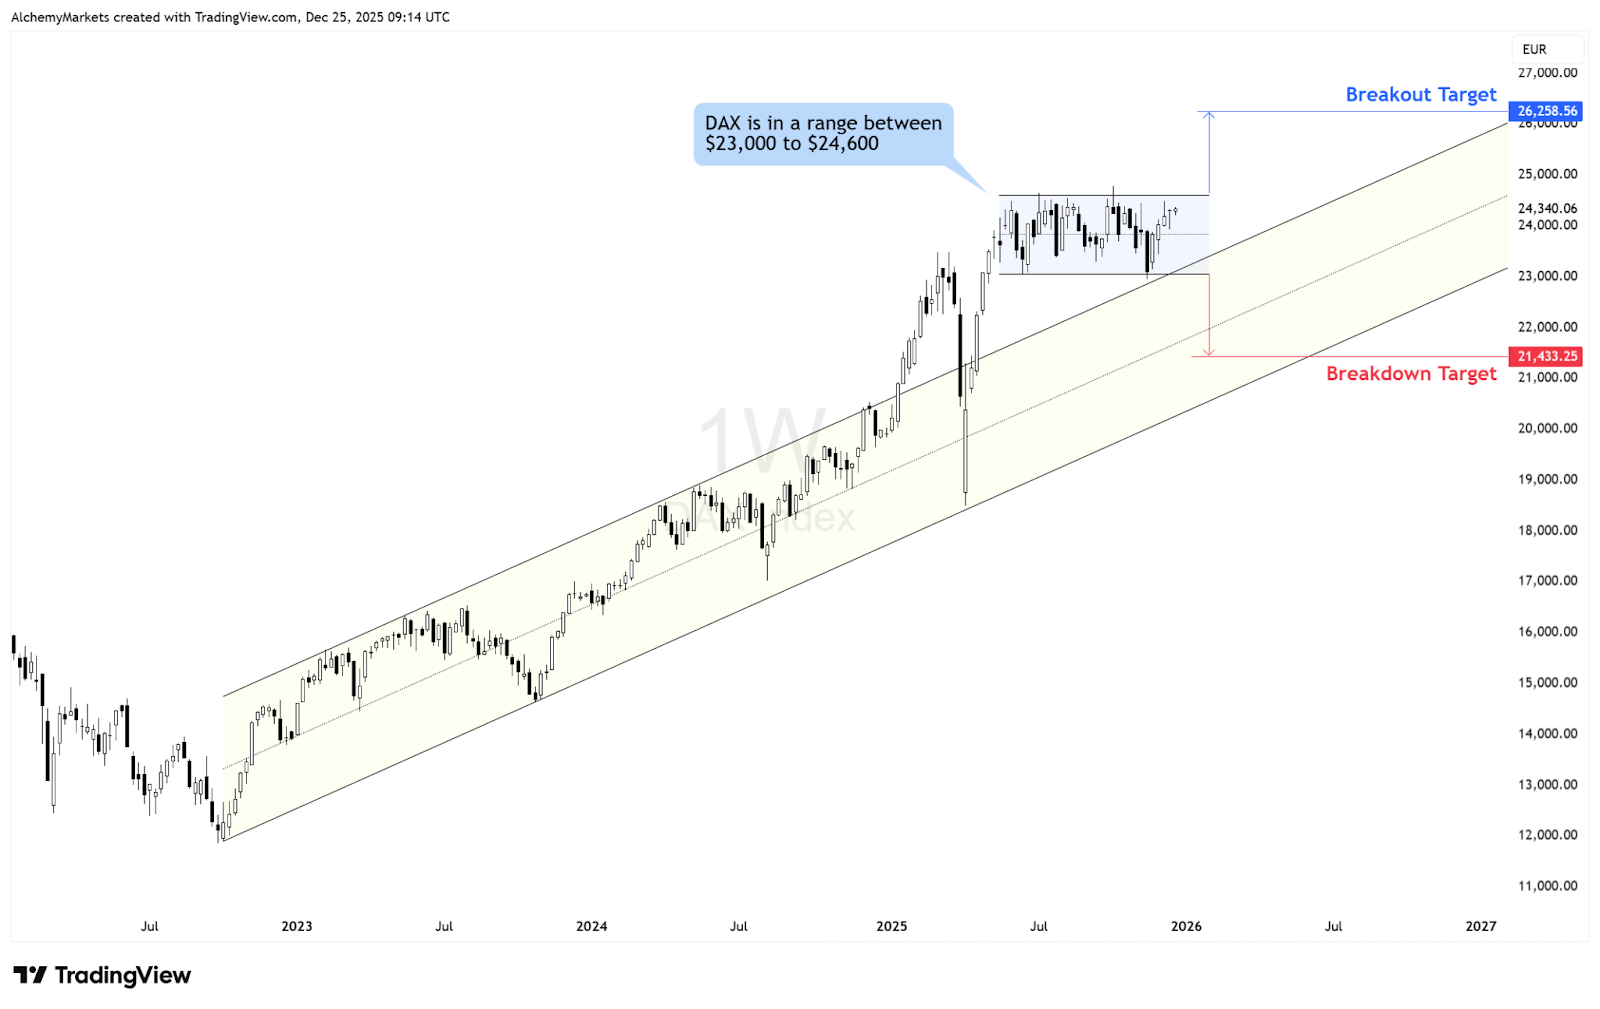
The DAX chart shows:
This suggests participation in the European markets without excess enthusiasm.
Possible outcomes in Q1:
Europe benefits from global risk stability and easing financial conditions, but remains more exposed to external shocks. The trend remains valid, but the conviction is conditional.
Basically, watch the range until it breaks.
The FTSE reflects the defensive side of global rotation. Here we have the FTSE (CFD: UK100 on Alchemy Markets) daily timeframe.
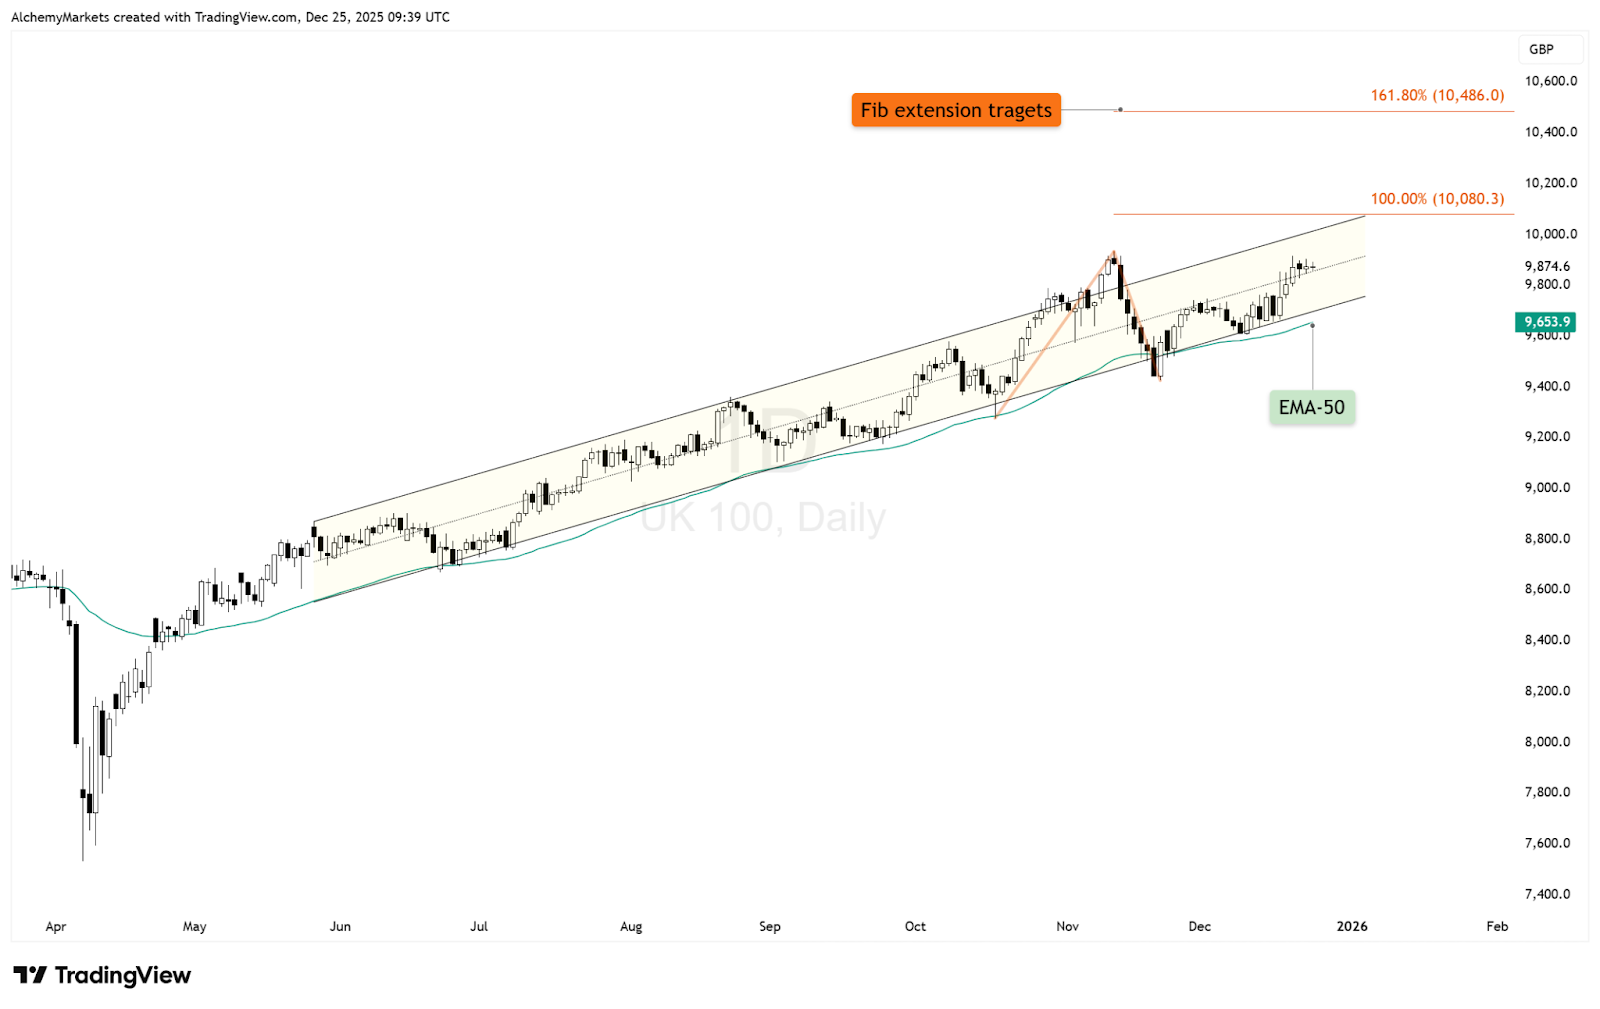
Technically:
Possible outcomes in Q1 2026:
This index acts less as a driver and more as a stabiliser, consistent with an environment where investors value resilience over growth optionality.
Across yields, equities, and volatility, the signals are aligned.
As Q1 begins:
This often pulls volatility forward into early Q1, even within broader uptrends. The key takeaway for Q1 2026 is not imminent breakdown, but heightened sensitivity to surprises.
Markets can still move higher, but they are simply less forgiving of mistakes (more fragile).
Our stance remains cautiously bullish, supported by policy shifts, while staying alert to the risks building quietly in the background.
DISCLAIMER: For educational purposes only. Trading comes with substantial risk, leading to possible loss of your capital. Traders are advised to do their own due diligence before investing.
Alchemy Markets is a multi-asset brokerage providing retail traders with the same elite trading conditions, tools, and transparency typically reserved for institutions.
Select the categories and companies you wish to follow directly to your person rss feed.
Create Custom RSS FeedSign up and join over 5,000 professional members who receive personalized news alerts, curated professional connections, and more for free!
Sydney-based multi-asset broker ACY Securities has introduced PAXGUSD, a new CFD instrument that allows clients to trade tokenised gold against the US Dollar 24 hours a day, seven days a week. The instrument is available across MetaTrader 4, MetaTrader 5, and the ACY Trading Platform.
Binance has lowered its VIP 3 Wallet Assets threshold from $3 million to $1 million and will now count OTC Spot Trading Volume at a 4x multiplier toward VIP qualification, removing the previous VIP 4 cap and allowing eligible users to progress through the full tier framework up to VIP 9.
Retail futures trading leader NinjaTrader Group has appointed Mark Omens as Senior Vice President, Commercial Strategy, bringing a 25-year veteran of derivatives marketplace CME Group into a newly created role focused on exchange partnerships and enterprise growth.
Gold Price Action Forecast: Will XAU/USD Drop to $3930? Meta Description: Read our Gold price action forecast to see if XAU/USD will drop to $3930.
BitDelta Securities Financial Services LLC (“BitDelta Securities”) today announced that it has received full regulatory approval from the Capital Market Authority (“CMA”) of the United Arab Emirates under the Category 5 — Arrangement and Advice license framework (License No. 20200000439). The approval follows the firm's receipt of In-Principal Approval earlier this year and represents the successful conclusion of the CMA's full licensing process, including the satisfaction of capital requirements, governance appointments, and operational setup.
Crypto.com has received a $400 million strategic investment from Citadel Securities, valuing the firm at $20 billion. It marks the first institutional funding round in the company's history, aimed at accelerating its expansion into tokenised securities, derivatives and other asset classes.
WTI’s pullback into $79–82 is the first major test of the bullish Elliott Wave count, with buyers targeting a renewed break above $85.

BitDelta Securities has secured a full CMA Category 5 licence in the UAE and opened a regulated office in Business Bay, Dubai. The firm operates as an introducing broker, connecting investors with licensed international brokers across multiple asset classes, with CEO Dr. Demetrios Zamboglou commenting on the milestone.
Index volatility is asleep while single stocks fight it out underneath, credit refuses to confirm the equity rally, and a bare macro calendar hands next week to oil.
Digital assets and FX brokerage GC Exchange FZE (GCEX) has appointed Mohammed A. Mulla as a Board Member of its Dubai-based entity, part of the wider GCEX Group.