just now

Liquidity Finder Ltd is incorporated in England and Wales, company number 10610740, registered address 167-169 Great Portland Street, Fifth Floor, London W1W 5PF, United Kingdom.
Published: just now
The recent sell-off in equities has left investors asking the familiar question: where are we in this downturn? With the S&P 500 pulling back 10% from its February highs, we are now officially in a technical correction. What began as a fundamental reaction to weaker economic data and renewed tariff concerns quickly evolved into a broader risk event. As stocks declined, momentum accelerated, triggering forced unwinds of sizable trades and amplifying the sell-off.
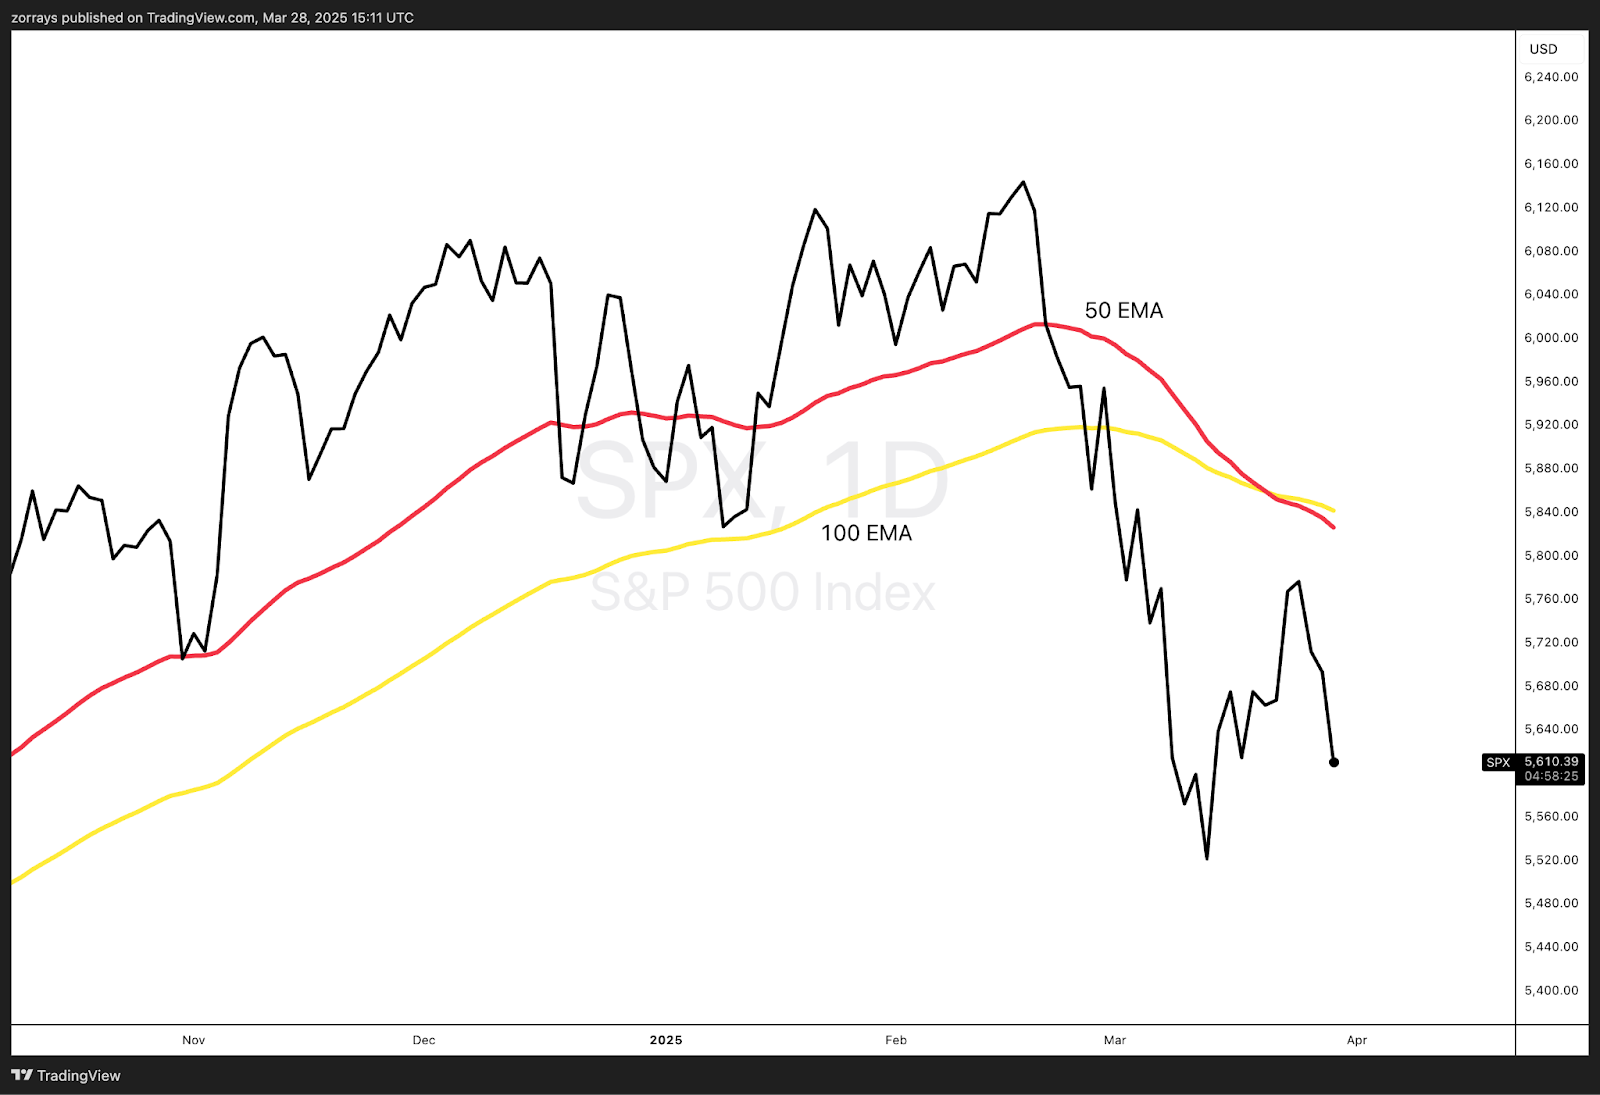
A key inflection point in this move came as the S&P 500 broke through key short-term (red) and medium-term (yellow) momentum levels. This breach intensified the downside pressure, forcing risk reductions across the market. As a result, U.S. equity exposure has seen a significant unwind, with approximately $70 billion in positioning cleared out.
However, history offers valuable perspective. In previous instances of 10% declines, equities have typically staged strong recoveries over the following 3, 6, and 12 months. Given the technical nature of this sell-off, the market now appears much cleaner in terms of positioning. With sentiment resetting and forced selling largely behind us, this presents an opportunity—conditions are aligning for a potential rebound, making this a compelling time to start looking at equities again.
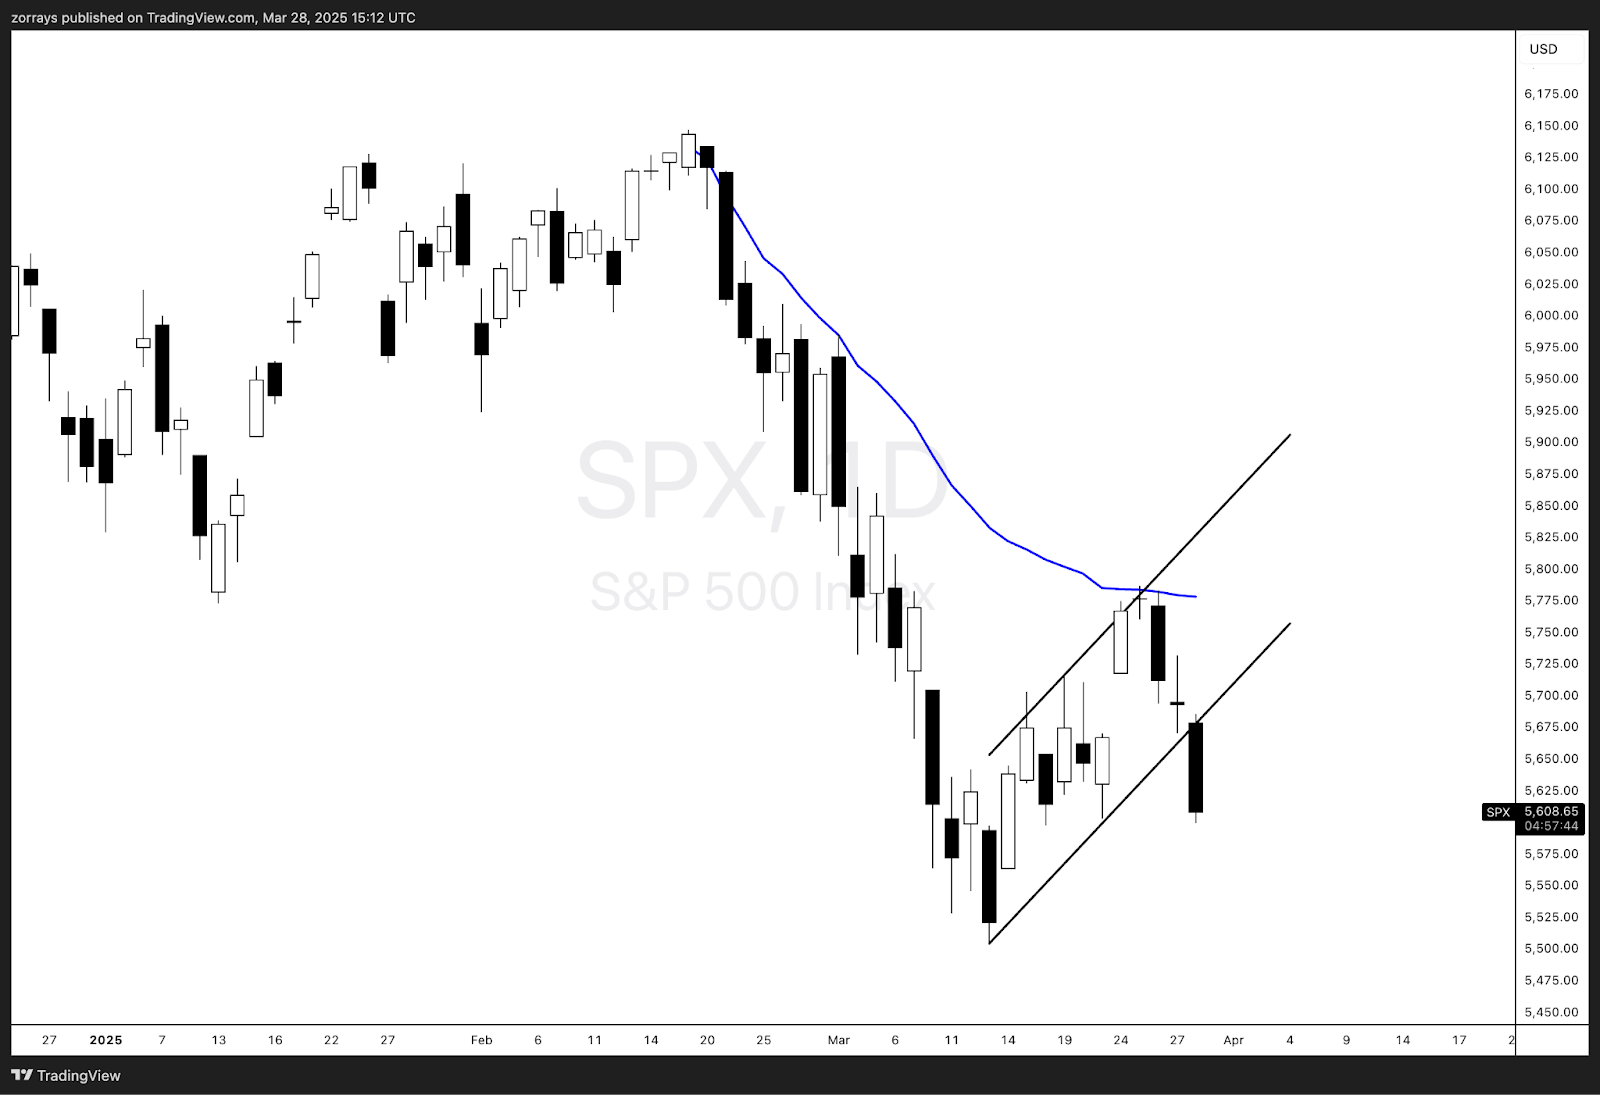
The S&P 500 (SPX) is once again at a technical inflection point, but with a more cautious tone following the latest price action. After rebounding within an upward channel, the index has now broken below that structure and clearly rejected the anchored VWAP (blue line in the chart). This rejection confirms that the bounce was likely a temporary relief rally rather than the beginning of a broader recovery.
With the index failing to reclaim that key momentum level, renewed selling pressure has emerged, suggesting the correction may not be over. The breakdown from the rising channel weakens the bullish case in the near term and opens the door to further downside. Unless SPX can quickly regain footing above the VWAP, momentum appears to favour sellers, and we may see a retest of the recent lows before any meaningful recovery can take hold.
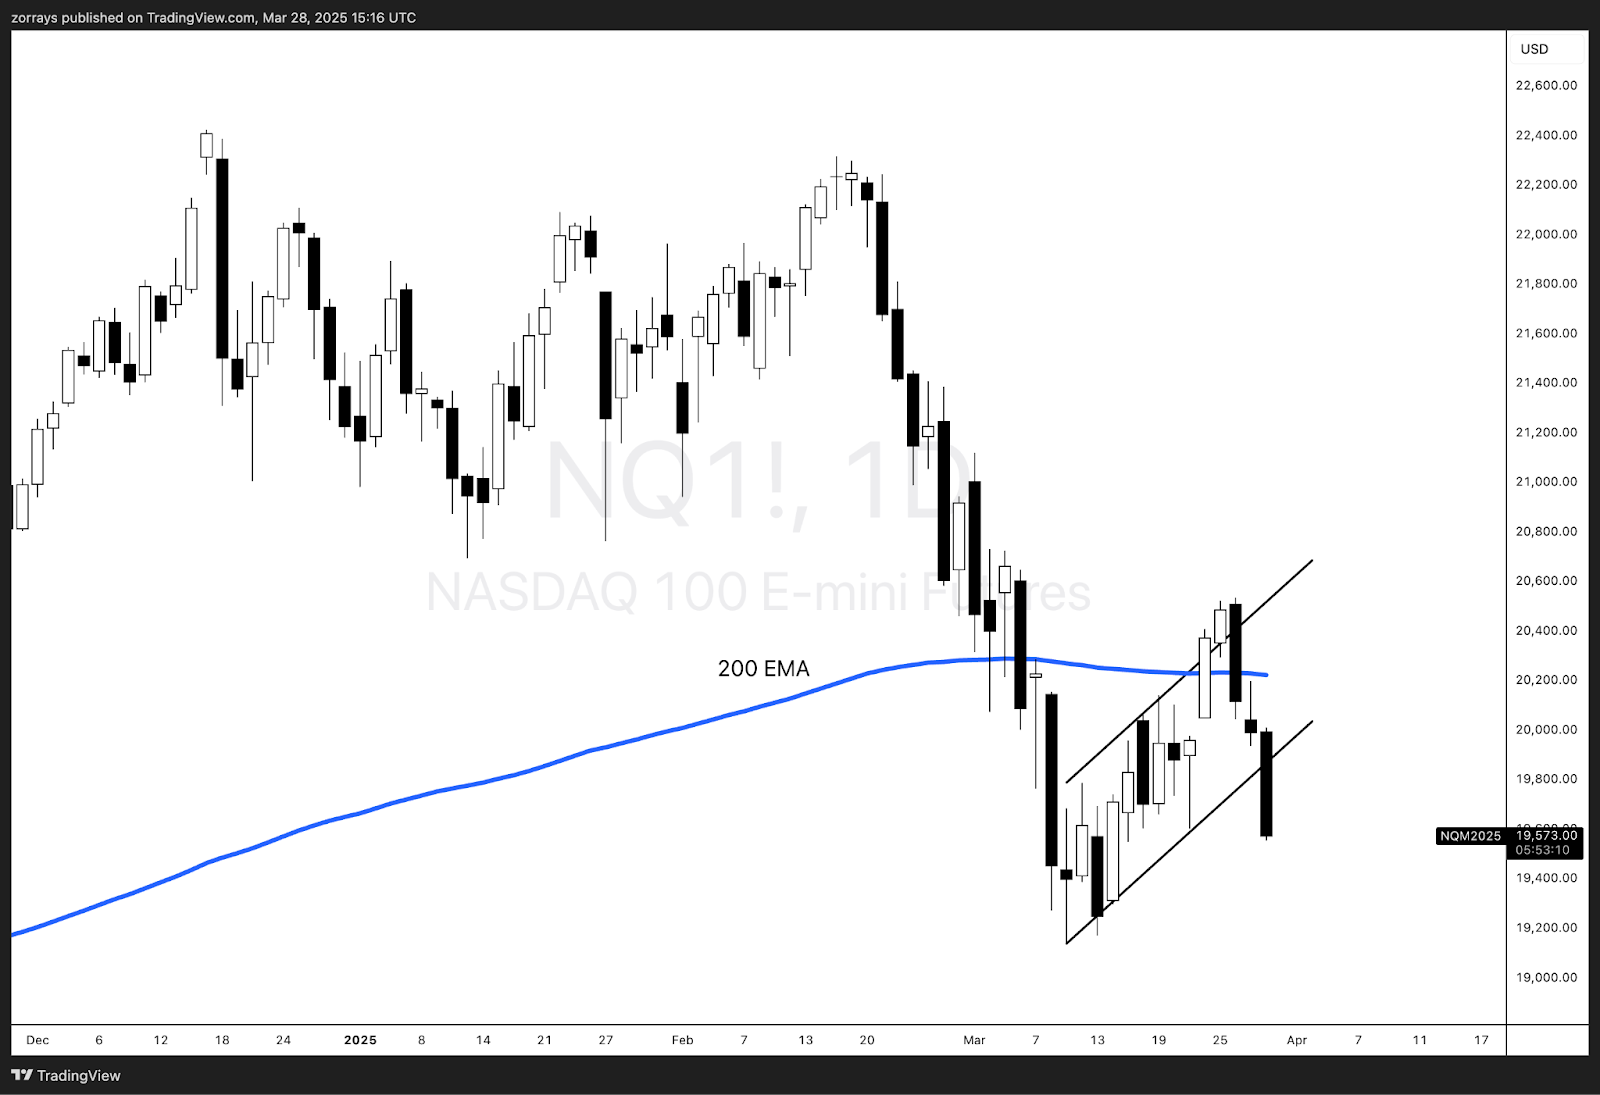
The NASDAQ 100 (NQ) has come under renewed pressure after forming a bearish flag pattern and failing to hold above the 200-day EMA (blue line in the chart). While the recent rally out of the March lows initially looked constructive, the sharp rejection at this long-term trend indicator signals that the move may have been a temporary relief rally. The breakdown from the flag suggests continuation of the broader downtrend, and unless buyers step in quickly, further downside toward the 19,000 zone could be on the cards. The rejection reinforces that tech remains vulnerable amid ongoing concerns around valuations and policy headwinds.
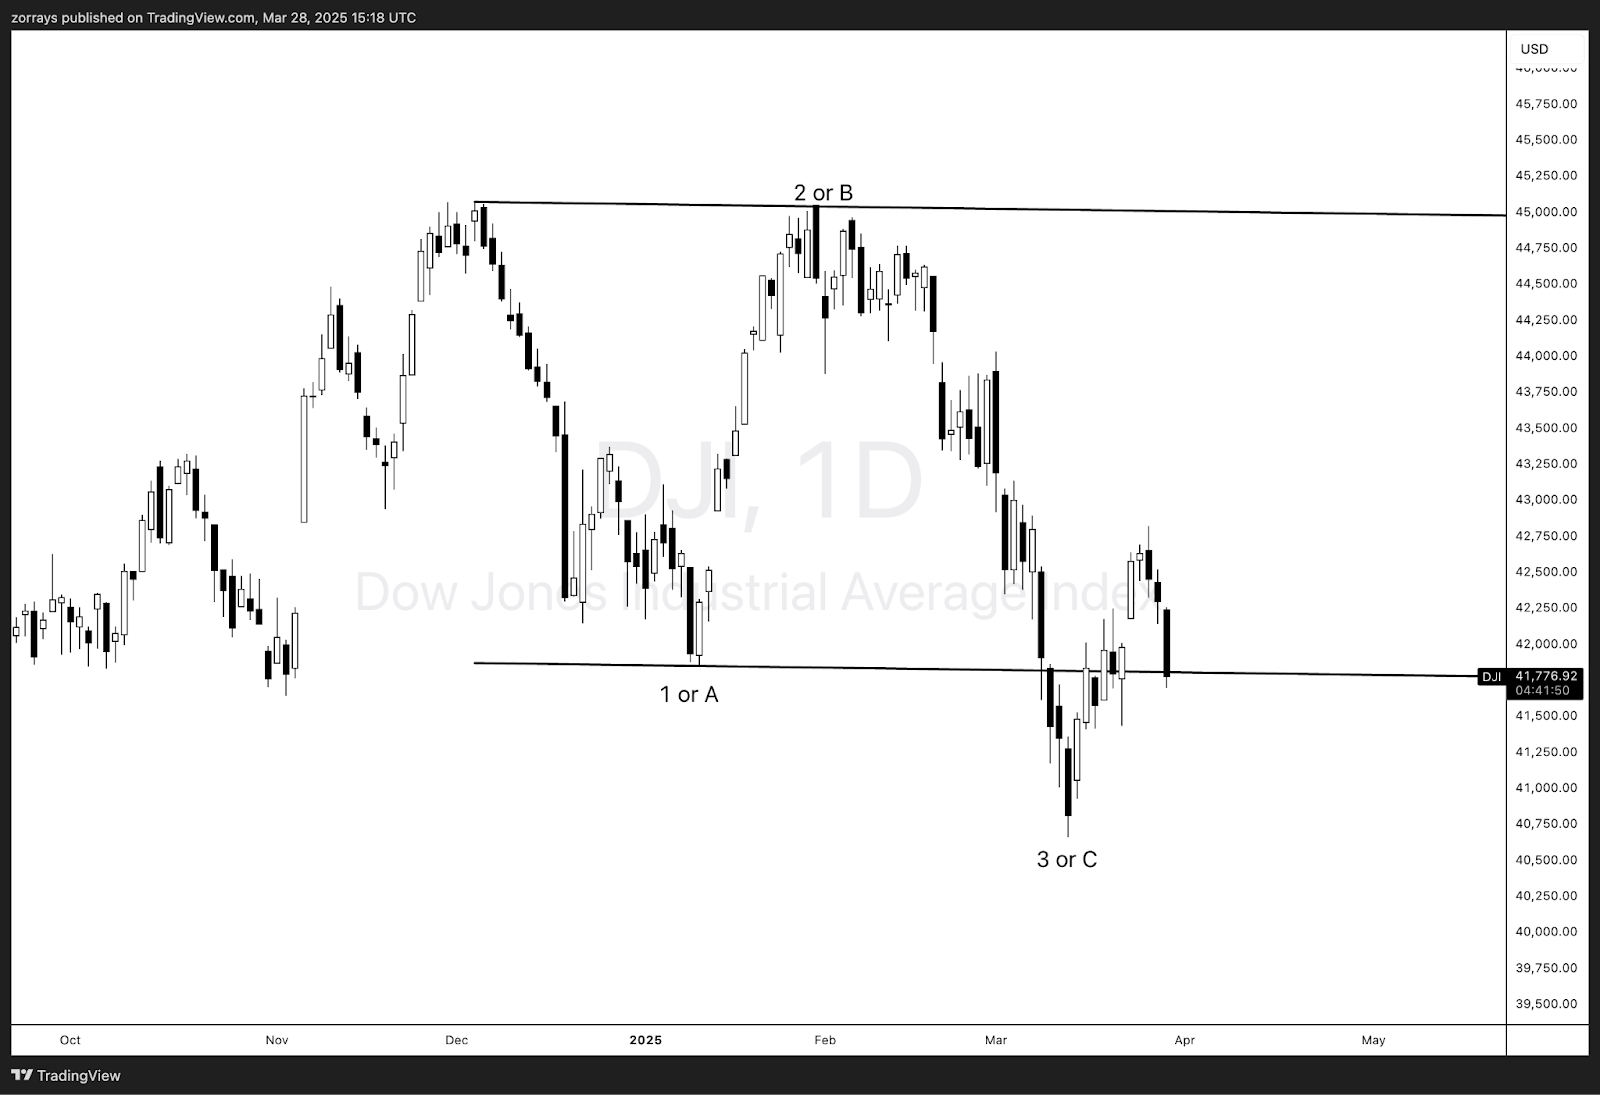
Dow Jones Industrial Average (DJI) has been the most resilient of the three major indices, experiencing a more controlled sell-off and already reclaiming key support. This relative strength supports the idea that the broader market correction is reaching exhaustion and aligns with the primary count that equities could turn bullish in the next two quarters. The Dow’s structure suggests it is the most likely index to lead a recovery, reinforcing the case for a more constructive equity outlook.
Overall, while macroeconomic risks still loom, technical signals indicate that equities are positioned for a potential rebound. The next major test for SPX at the anchored VWAP, the Nasdaq’s ability to sustain its breakout, and the Dow’s continued resilience will be key indicators of where markets head next. If the rally holds, equities could see a strong recovery into the second half of 2025, but failure at key resistance levels may lead to another wave of selling before a more sustained move higher.
The UK stock market is at an inflection point, with fundamental and technical factors suggesting a period of consolidation before the next directional move. The FTSE 100 (UKX) has been resilient, recently trading around 8,700, but a correction towards the 8,300 region seems plausible before a stronger trend emerges.
From a fundamental perspective, several macroeconomic headwinds could contribute to near-term weakness. The UK's GDP growth forecast is expected to be revised lower to around 1% for 2025, signaling slower economic expansion. Additionally, fiscal tightening measures, including further public spending cuts, could weigh on consumer sentiment and business investment. The Bank of England’s decision to maintain rates at 4.5% also suggests a cautious approach, with policymakers navigating the risks of inflation persistence and sluggish growth.
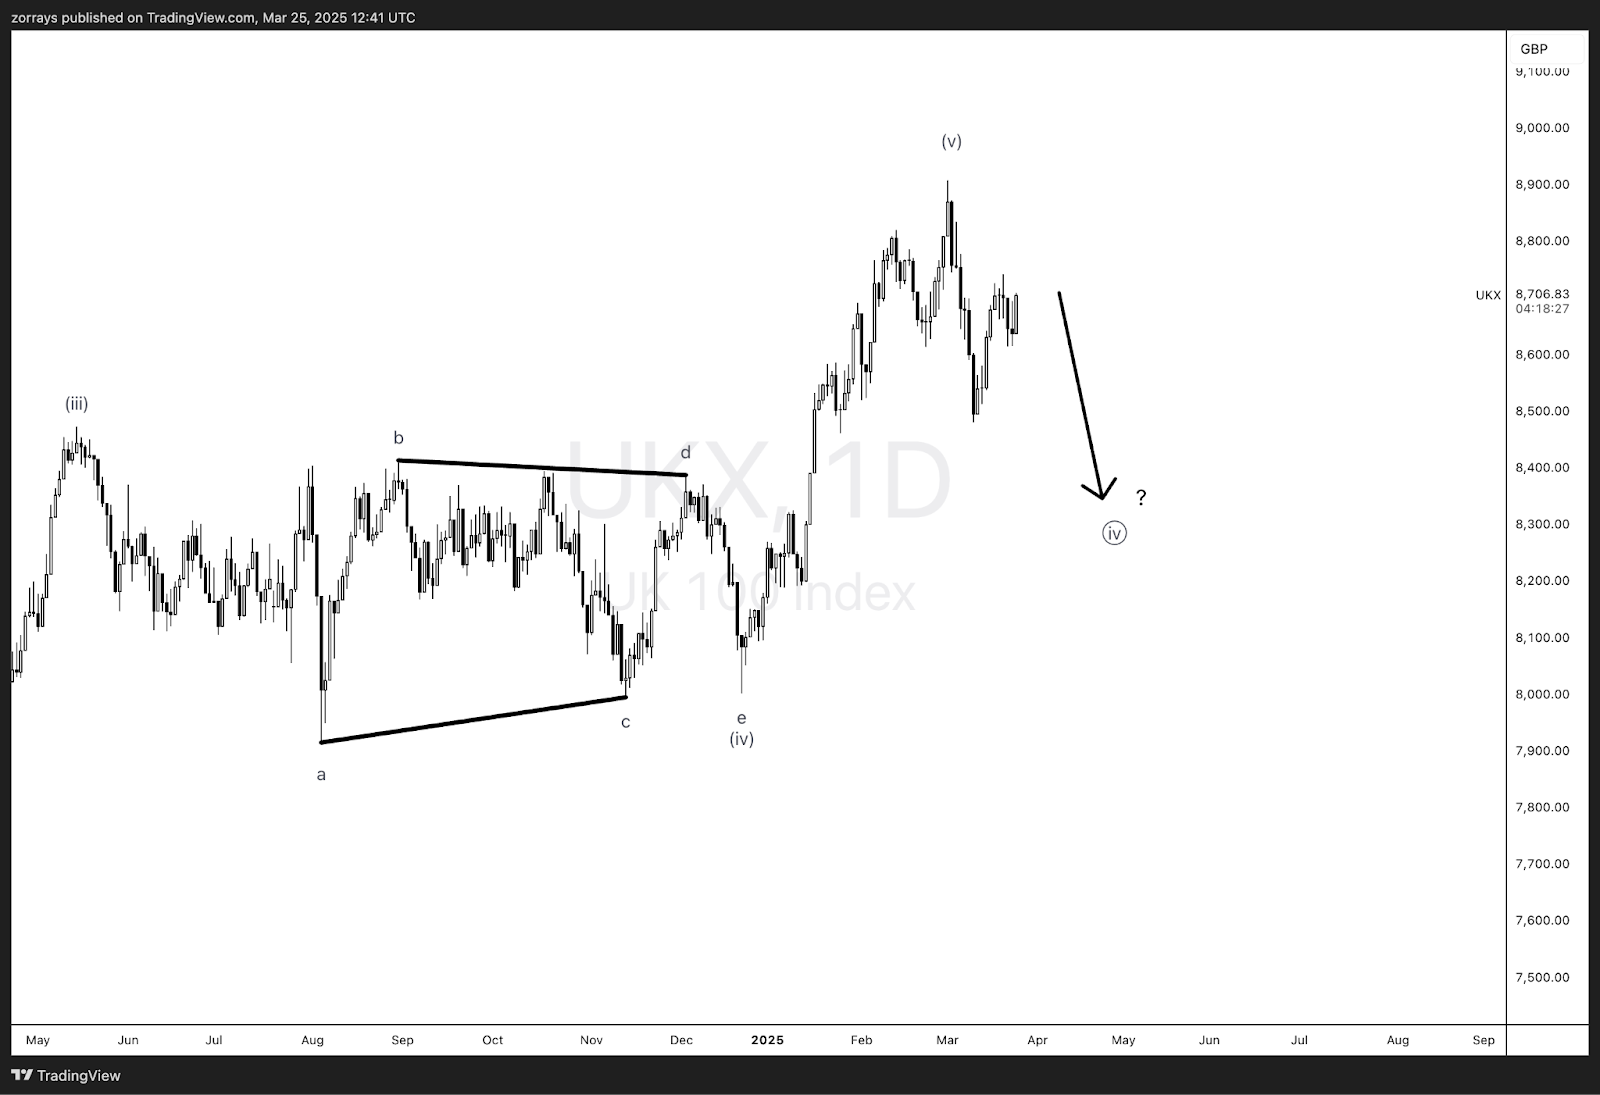
On the technical side, UKX appears to have completed a five-wave structure to the upside, and a Wave (iv) correction could now be unfolding. The current price action suggests the index may retrace towards the 8,300–8,000 (8000 being an invalidation level) region, where strong support levels align with prior consolidation zones. If this pullback materialises, it could offer a more attractive entry point for long-term investors. However, should the FTSE reclaim recent highs with strong momentum, it could signal that the correction is brief and that the bullish trend remains intact.
Overall, while the UK equity market remains structurally strong, near-term volatility and potential downside should not be ruled out. Investors should closely watch economic policy developments, fiscal adjustments, and global trade conditions, as these will dictate whether UKX stabilizes above key support levels or extends its correction further.
The DAX 40 has surged to record highs, reflecting strong corporate earnings, fiscal stimulus, and robust international investment. The index’s impressive rally has been largely driven by SAP SE, which alone accounts for over 40% of the recent gains, as the company benefits from its transition to cloud services and AI integration. Additionally, the German government’s approval of a €1 trillion spending plan for infrastructure and defense has further fueled investor optimism. However, while the fundamental backdrop remains supportive, the technical picture suggests that the DAX may be overextended and due for a correction.
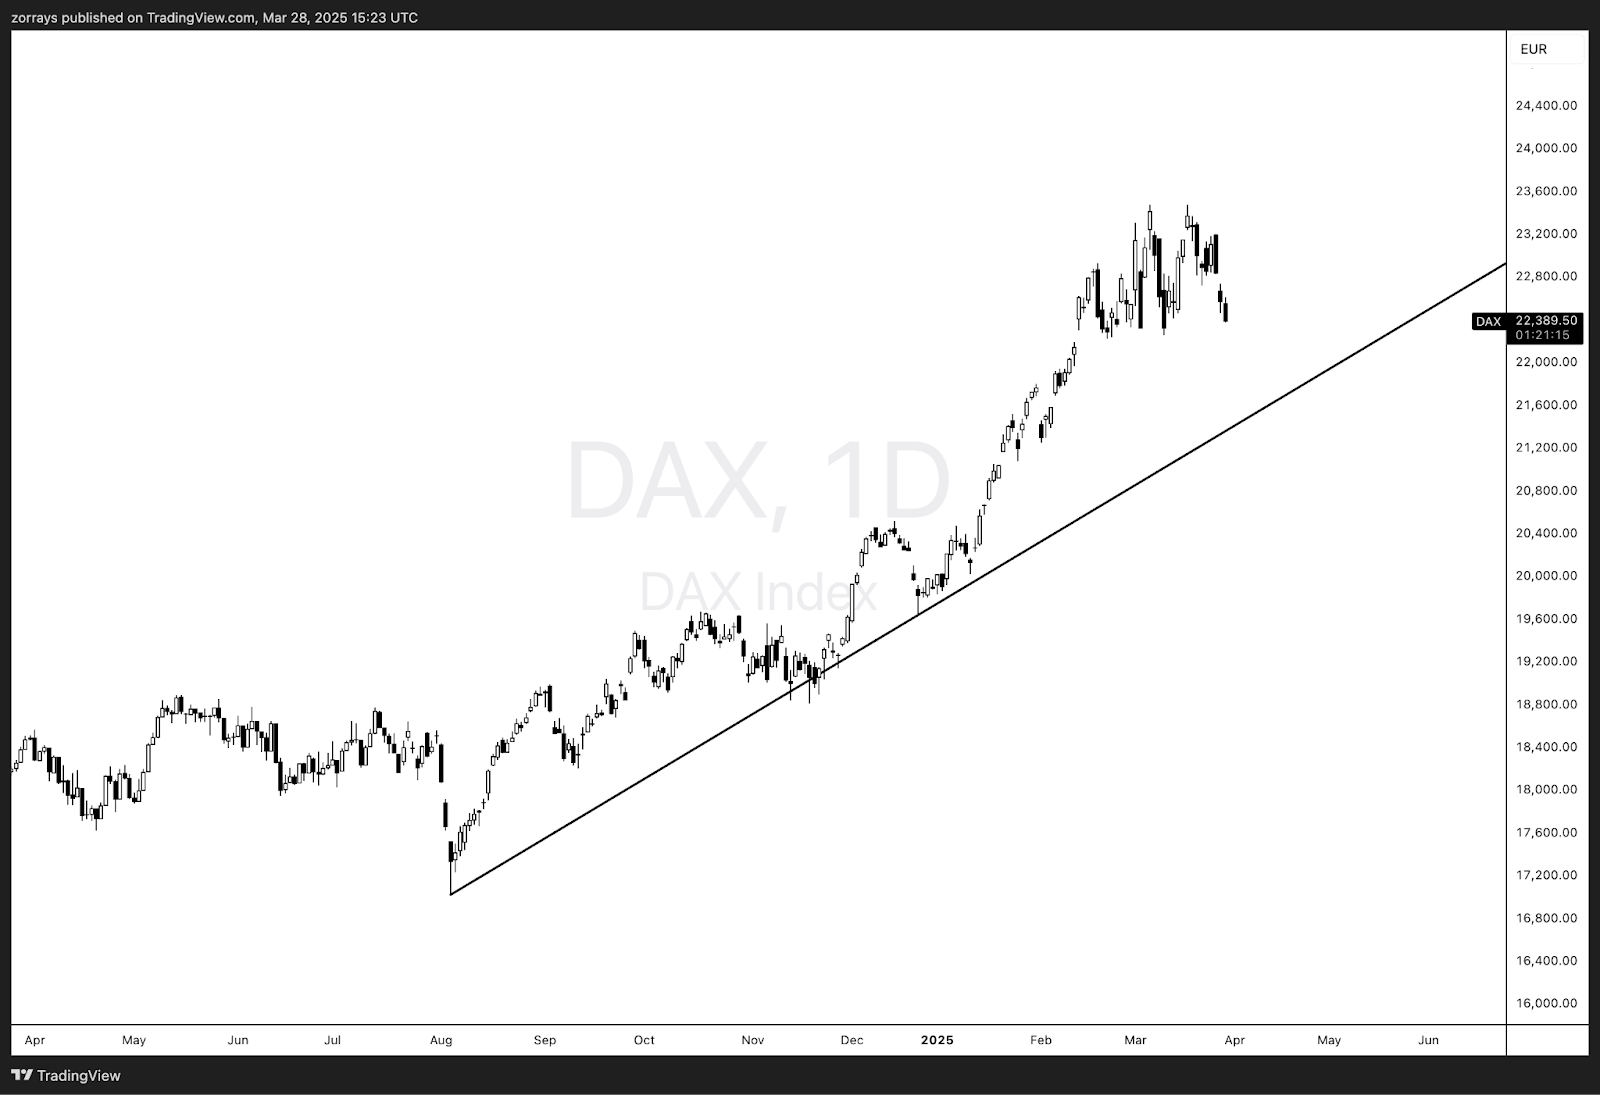
From a technical perspective, the DAX had been trading within a well-defined long-term ascending channel, but recent price action suggests that a pullback may already be underway. After reaching record highs, the index has started to retreat, and price now appears to be heading toward the rising trendline that has supported the broader uptrend since mid-2023. This kind of consolidation, particularly after such a steep run-up, would be considered healthy and may see the index gravitate toward the 21,000–20,500 region before reassessing the next directional move.
On the macro side, potential headwinds could also slow the rally. Global trade tensions and tariff risks remain a threat to Germany’s export-driven economy, and any escalation could weigh on market sentiment. Furthermore, while fiscal stimulus has been a tailwind, the longer-term impact on inflation and interest rates could introduce volatility.
Overall, the DAX remains structurally bullish, but the risk of a near-term pullback is growing. Investors should watch for signs of exhaustion near current levels and be prepared for a possible correction before the next leg higher. If the DAX can sustain above key support levels after a pullback, it would signal that the long-term uptrend remains intact.
Disclaimer: For educational purposes only. Trading comes with substantial risk, leading to possible loss of your capital. Traders are advised to do their own due diligence before investing.
Alchemy Markets is a multi-asset brokerage providing retail traders with the same elite trading conditions, tools, and transparency typically reserved for institutions.
Select the categories and companies you wish to follow directly to your person rss feed.
Create Custom RSS Feed
just now
Sign up and join over 5,000 professional members who receive personalized news alerts, curated professional connections, and more for free!
Retail futures trading leader NinjaTrader Group has appointed Mark Omens as Senior Vice President, Commercial Strategy, bringing a 25-year veteran of derivatives marketplace CME Group into a newly created role focused on exchange partnerships and enterprise growth.
Gold Price Action Forecast: Will XAU/USD Drop to $3930? Meta Description: Read our Gold price action forecast to see if XAU/USD will drop to $3930.
BitDelta Securities Financial Services LLC (“BitDelta Securities”) today announced that it has received full regulatory approval from the Capital Market Authority (“CMA”) of the United Arab Emirates under the Category 5 — Arrangement and Advice license framework (License No. 20200000439). The approval follows the firm's receipt of In-Principal Approval earlier this year and represents the successful conclusion of the CMA's full licensing process, including the satisfaction of capital requirements, governance appointments, and operational setup.
Crypto.com has received a $400 million strategic investment from Citadel Securities, valuing the firm at $20 billion. It marks the first institutional funding round in the company's history, aimed at accelerating its expansion into tokenised securities, derivatives and other asset classes.
WTI’s pullback into $79–82 is the first major test of the bullish Elliott Wave count, with buyers targeting a renewed break above $85.

BitDelta Securities has secured a full CMA Category 5 licence in the UAE and opened a regulated office in Business Bay, Dubai. The firm operates as an introducing broker, connecting investors with licensed international brokers across multiple asset classes, with CEO Dr. Demetrios Zamboglou commenting on the milestone.
Index volatility is asleep while single stocks fight it out underneath, credit refuses to confirm the equity rally, and a bare macro calendar hands next week to oil.
Digital assets and FX brokerage GC Exchange FZE (GCEX) has appointed Mohammed A. Mulla as a Board Member of its Dubai-based entity, part of the wider GCEX Group.
Learn what Blockchain-as-a-Service is, how it works, and why businesses are using BaaS to build blockchain applications without managing infrastructure.
CFDs vs stocks compared on leverage, ownership, costs, dividends, taxes, and risk. Learn the differences between stocks and CFDs and discover which suits your investing or trading goals.