just now

Liquidity Finder Ltd is incorporated in England and Wales, company number 10610740, registered address 167-169 Great Portland Street, Fifth Floor, London W1W 5PF, United Kingdom.
Published: just now

The S&P 500 tanked by 2.76% yesterday, but is now making a valiant effort at recovery. Upon closer inspection, we can see the asset is still within a tight range between $6,792 to $6,985.
There is now a very clear market gap between $6,812 to $6,864; but that may not be significant at all because S&P 500 blatantly has disrespected those gaps for the entirety of 2026.
What this tells us is that we are in a macro driven environment; earnings, geopolitics, and interest rate decisions are what drives this market concurrently. The choppy sideways move also aligns with the idea of sector rotation, where now - defense and energy stocks are beginning to shine rather than AI and Chips.
So what does this mean for trading today?
Going on the 4H-timeframe, we can see that S&P clearly resisted closing below the range:
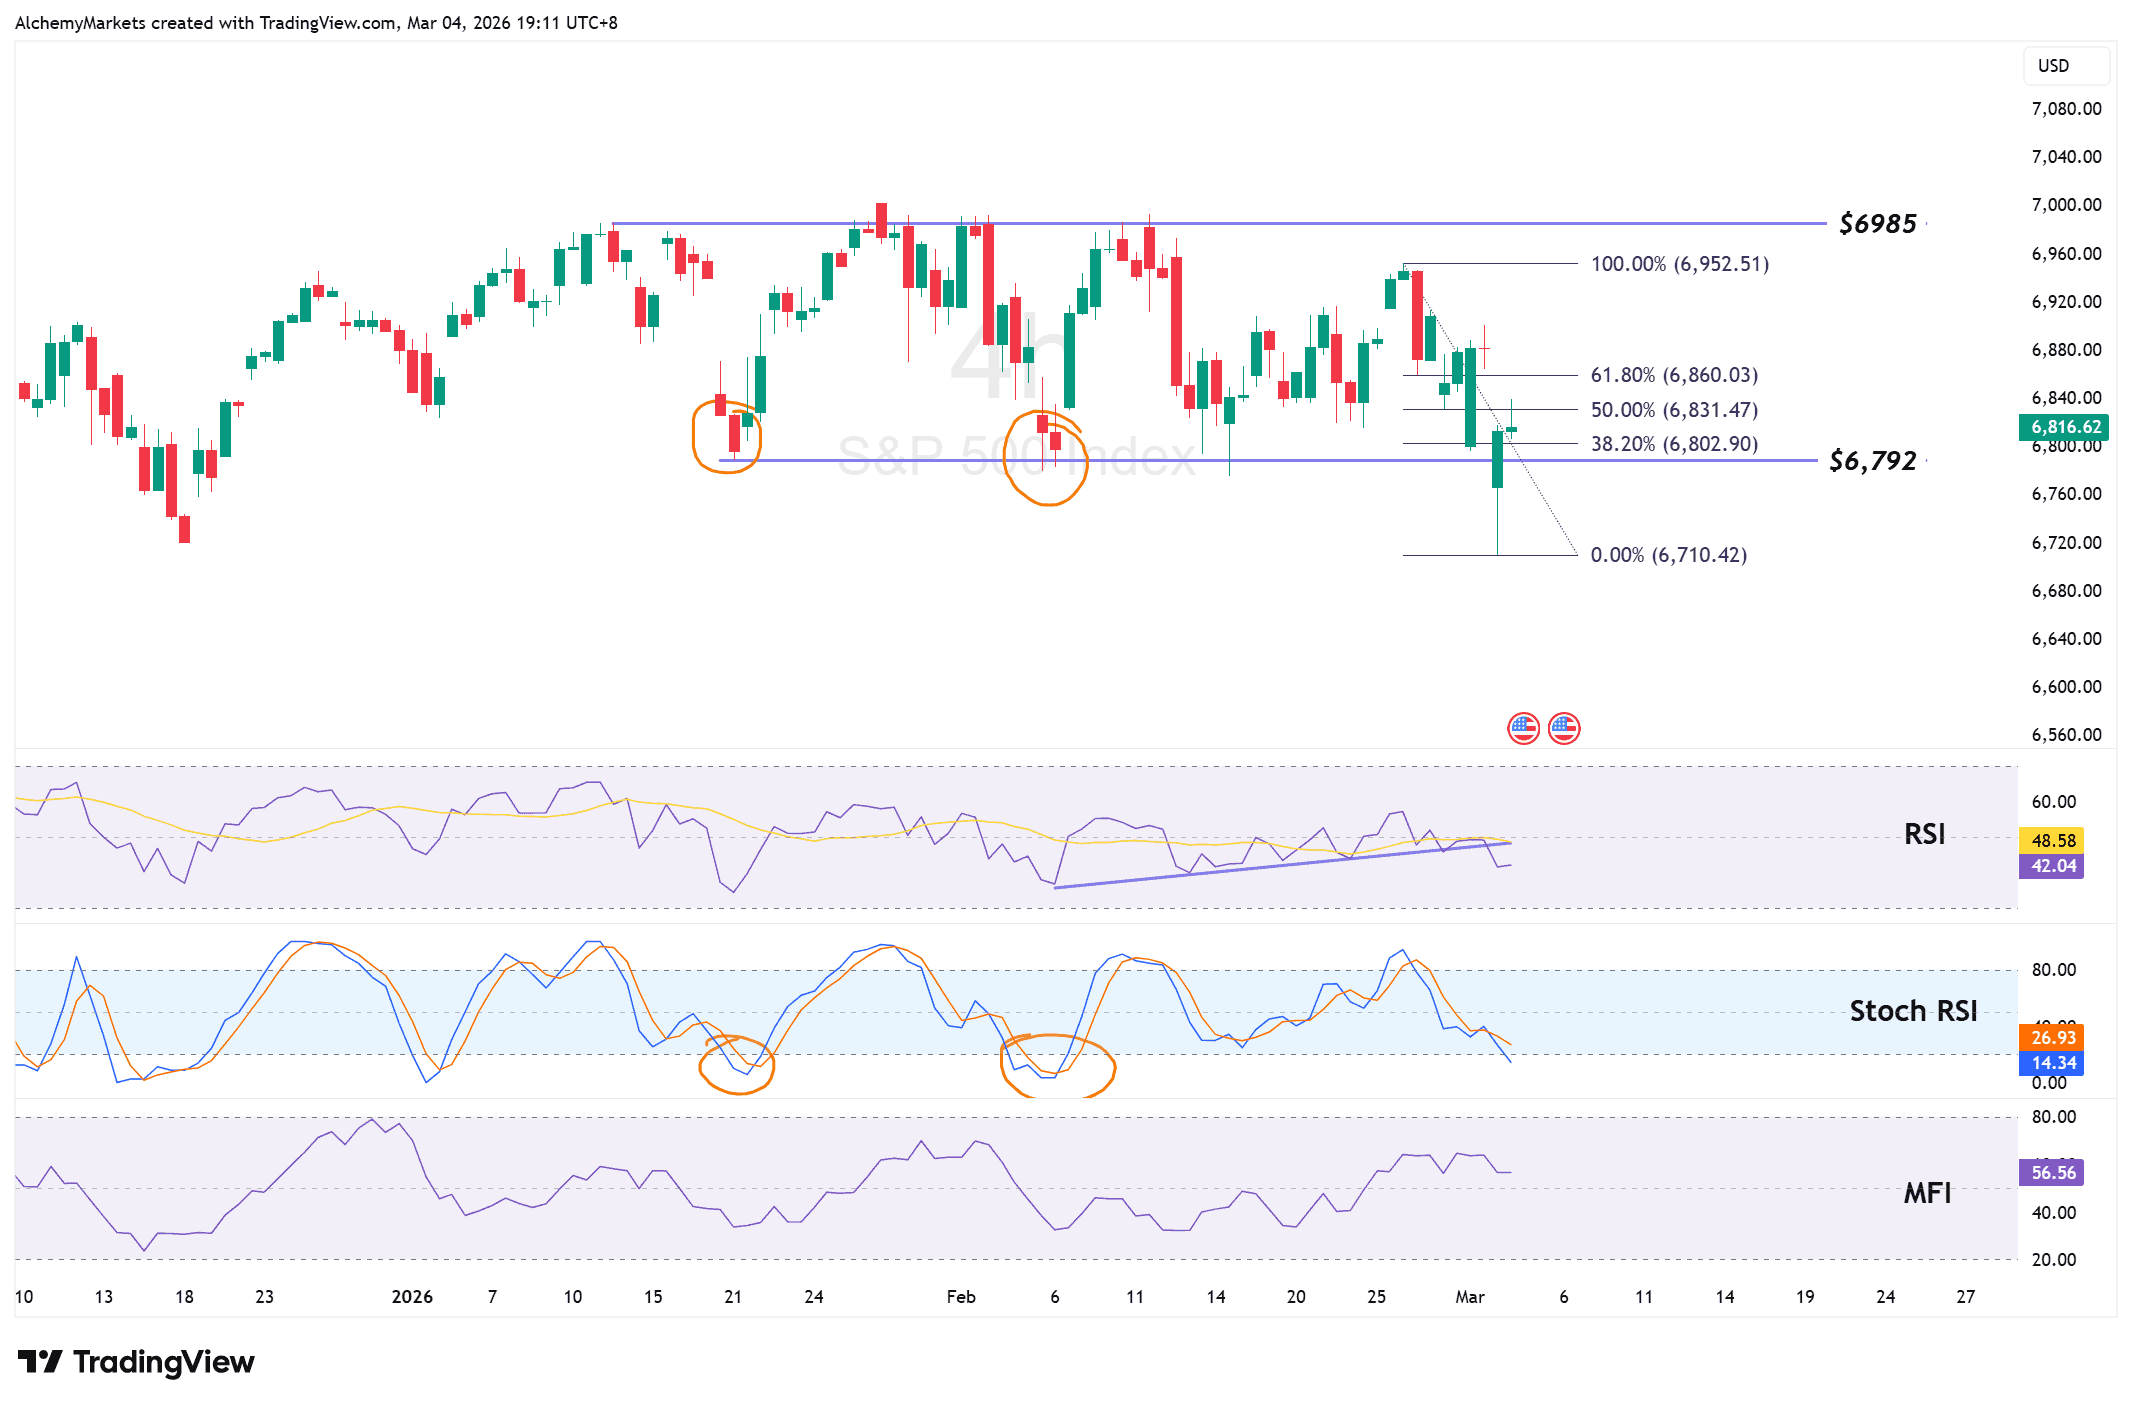
That's a good sign. But several technical factors to be considered are emerging:
These signals point to a potential lower drop to come, but perhaps not by much.
We're getting close to an inflection point. Should the S&P 500 hold the range, we can continue to expect rangebound behaviour.
Fib levels mark a potential reversal point (to continue the decline) at $6,860, where traders should keep an eye on.
Despite all the market noise, S&P 500 is still in an uptrend. Zooming out a little, we can see if we use the Bollinger Bands to capture 1 standard deviation from the 4H-EMA 200, that it serves as a beautiful trend filter.
Notice how in August 2024, despite the steep drop, the SPX still held within the band and continued its uptrend. Currently, the band's lows sits at $6,693, approximately $6,700.
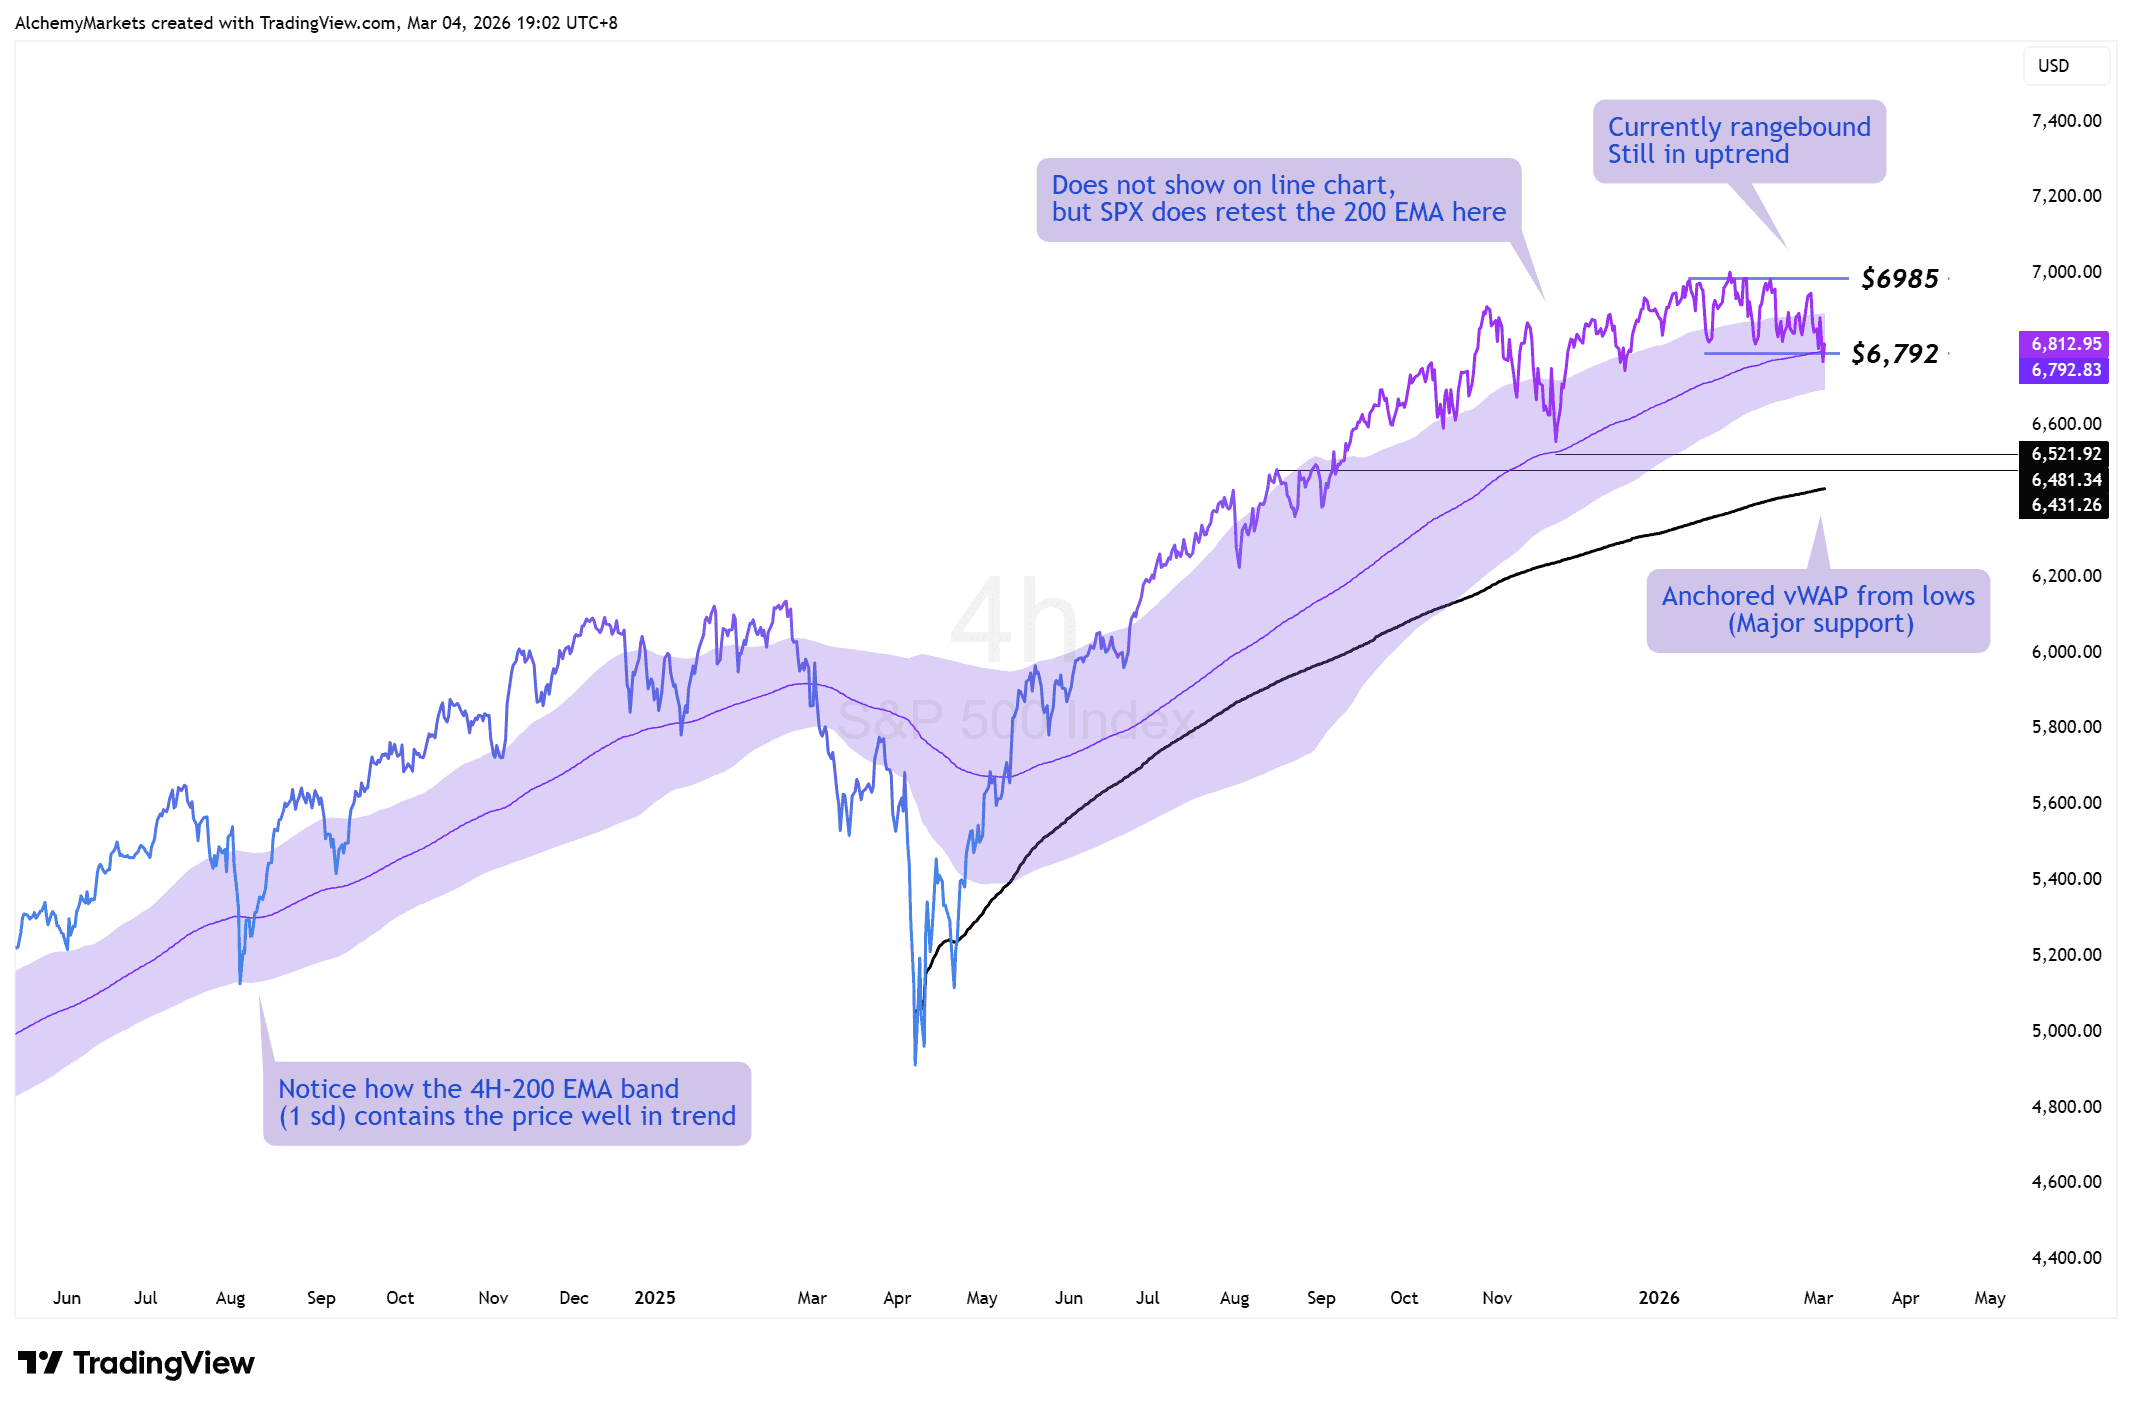
However, we are beginning to see cracks in the rally. The band is beginning to shrink, which is what it did back in early 2025 before cracking below the bands; creating a drop of over 20%.
Now, the price has just retested the 4H-EMA 200 for the second time in the rally (first time in Nov 2025), so we'll have to see if this support fails. If that happens, look towards $6,700 - and if that fails, the probabilities of a prolonged downtrend on S&P 500 increases.
The bottom line is:
We are still in an uptrend - but momentum indicators suggest lower prices aren't out of the picture. The play now is to watch these "breach" levels closely to assess S&P 500's health.
DISCLAIMER: For educational purposes only. Trading comes with substantial risk, leading to possible loss of your capital. Traders are advised to do their own due diligence before investing.
Alchemy Markets is a multi-asset brokerage providing retail traders with the same elite trading conditions, tools, and transparency typically reserved for institutions.
Select the categories and companies you wish to follow directly to your person rss feed.
Create Custom RSS FeedSign up and join over 5,000 professional members who receive personalized news alerts, curated professional connections, and more for free!
Marex has partnered with Coinbase to allow clients to use USDC, Circle's dollar-denominated stablecoin, as initial margin collateral for CFTC-regulated derivatives, following a CFTC no-action letter. The service completed its first transaction with Prime Trading, LLC, supported by Coinbase's custody and reporting infrastructure.
cBridge, by Spotware, has launched Markout Report, a risk intelligence module that lets brokers detect toxic flow, rank accounts by financial impact and act before losses accumulate, all within the bridge.
Sterling steadies after political uncertainty rattled gilt markets, while EUR/USD and EUR/GBP approach key technical levels ahead of today's European session.
GBP/AUD remains trapped in a well-defined bearish trend on both the weekly and daily timeframes.
Discover the key drivers, technical levels, and central bank expectations shaping the EUR/USD trend as the ECB prepares to hold rates and markets watch for a potential breakout.
Sydney-based multi-asset broker ACY Securities has introduced PAXGUSD, a new CFD instrument that allows clients to trade tokenised gold against the US Dollar 24 hours a day, seven days a week. The instrument is available across MetaTrader 4, MetaTrader 5, and the ACY Trading Platform.
Binance has lowered its VIP 3 Wallet Assets threshold from $3 million to $1 million and will now count OTC Spot Trading Volume at a 4x multiplier toward VIP qualification, removing the previous VIP 4 cap and allowing eligible users to progress through the full tier framework up to VIP 9.
Retail futures trading leader NinjaTrader Group has appointed Mark Omens as Senior Vice President, Commercial Strategy, bringing a 25-year veteran of derivatives marketplace CME Group into a newly created role focused on exchange partnerships and enterprise growth.
Gold Price Action Forecast: Will XAU/USD Drop to $3930? Meta Description: Read our Gold price action forecast to see if XAU/USD will drop to $3930.
BitDelta Securities Financial Services LLC (“BitDelta Securities”) today announced that it has received full regulatory approval from the Capital Market Authority (“CMA”) of the United Arab Emirates under the Category 5 — Arrangement and Advice license framework (License No. 20200000439). The approval follows the firm's receipt of In-Principal Approval earlier this year and represents the successful conclusion of the CMA's full licensing process, including the satisfaction of capital requirements, governance appointments, and operational setup.