just now

Liquidity Finder Ltd is incorporated in England and Wales, company number 10610740, registered address 167-169 Great Portland Street, Fifth Floor, London W1W 5PF, United Kingdom.
Published: just now

A Trading Journal stops being powerful the moment it becomes vague.
Most traders write entries like:
“Buy gold. Good idea but stopped out. Market manipulated.”
There’s no data.
No metrics.
No insight.
Just emotion packaged as a record.
A Trading Journal is only useful when the data inside it can be measured, compared, reviewed, and translated into better decisions. To journal like a professional trader, you must track specific metrics - the ones that reveal your strengths, expose your weaknesses, and show the truth behind your performance.
This part teaches the 10 core metrics that belong in every Trading Journal - whether you’re a beginner following the Learn Trading From Scratch roadmap or already exploring advanced SMC concepts like the Confirmation Model.
When you track these properly, your journal becomes a precision tool - not a diary.
Below are the non-negotiables - the data points that separate a casual journal from a performance engine.
Your strategy may work - but not at all hours.
Tracking when you trade reveals patterns such as:
Timing explains results more often than traders admit.
See how session bias impacts price in guides like Trading Sessions & Momentum Timing.
Different markets behave differently - and your journal should reflect that.
For example:
Gold requires precision around key levels (learned inMaster Candlestick Entries at Key Levels).
NASDAQ behaves explosively at open.
EUR/USD trends more smoothly.
Tracking your instrument helps identify your “personal edges” - some traders perform far better in indices than FX, or vice versa.
Simple but essential.
You may discover you:
Your Trading Journal should expose directional bias so you can correct it.
A setup is not a “feeling.”
You must label the exact setup you took:
This also helps you measure which strategies are actually profitable.
You can revisit guides like Breakout + Retest Strategy or Trading Gold with SMC to categorize your setups clearly.
Risk is where 90% of traders lose control.
Tracking risk reveals:
Use proper sizing frameworks from Risk Management Strategies to stay consistent.
A Trading Journal without R:R is incomplete.
Because:
Your R-multiple (how many “R” you win or lose) is more important than accuracy.
Resources like How to Use Fibonacci to Set Targets teach how to refine profit targets to improve R:R.
Money creates emotional stories.
R-multiple creates truth.
Instead of: “+ $45” write: “+ 2R”
Money varies with account size - R-multiples reflect performance.
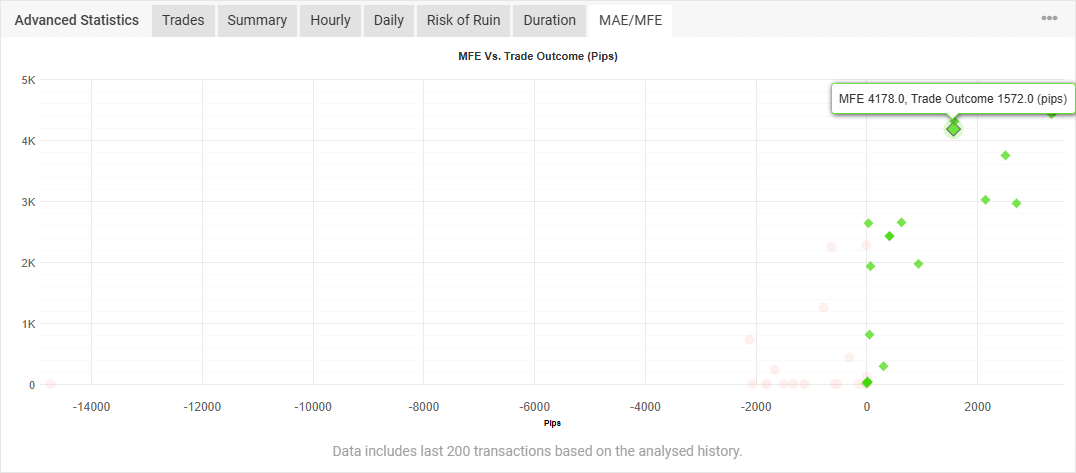
How far in profit your trade went before closing.
This answers:
MFE helps refine exits, especially for trend setups.
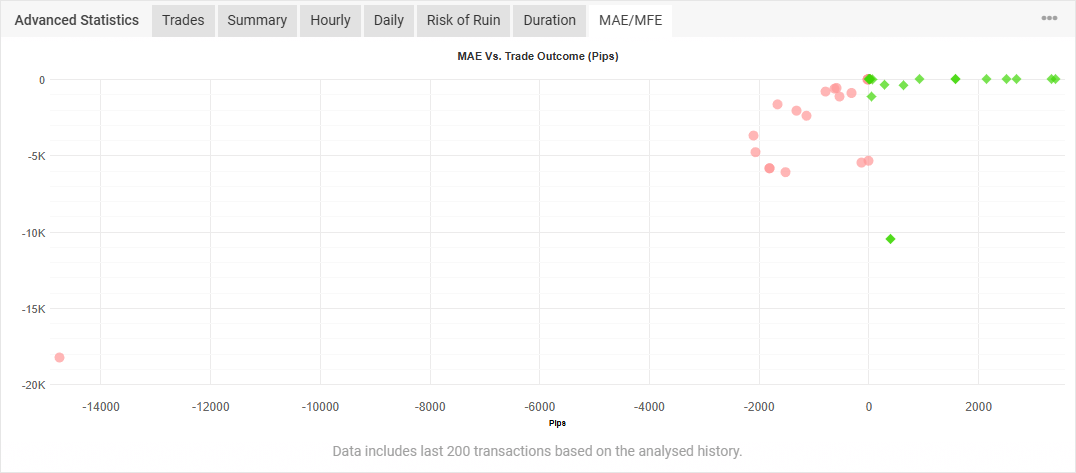
How far the trade went against you before it moved your way (or hit SL).
This metric reveals:
Using MAE data can drastically improve stop-loss placement.
For help with precision entries, see Execution Psychology.
Your journal must capture behavior, not just numbers.
Examples:
Use this alongside Trading Psychology: Controlling Yourself to interpret emotional patterns.
This is the metric that reveals cycles of self-sabotage - long before they blow your account.
As you grow, add these:
If “No,” the trade is invalid regardless of outcome.
Especially when backtesting using Forex Tester.
Examples:
These give structure to otherwise random trades.

Imagine a doctor who refuses to take:
They simply say:
“You look sick, I guess it’s fever.”
No patient would accept that level of guesswork.
Yet many traders do exactly this in the markets.
A Trading Journal is your diagnostic tool.
Every metric is a vital sign.
If you track them, you diagnose the real issue.
If you don’t, you trade blindly and emotionally.
When you track these 10 metrics consistently:
This is how traders transform.

Your edge isn’t the strategy you use.
Your edge is your ability to measure your behavior and refine your execution through your Trading Journal.
When you begin tracking these metrics daily, your trading stops being random. Patterns emerge. Mistakes become visible. Discipline becomes measurable. Consistency becomes possible.
This is how amateur traders turn into professionals.
Not by predicting the market.
But by tracking themselves.
Your Trading Journal is the tool that makes that transformation possible.
No. A simple Notion or Excel sheet works. Software like TraderSync is optional.
Perfect. Fewer trades = cleaner, higher-quality data.
Yes - especially for studying entry patterns and mistakes.
Good. Awareness is the beginning of consistency.
It’s time to go from theory to execution!
Create an Account. Start Your Live Trading Now!
Looking for step-by-step approaches you can plug straight into the charts? Start here:
Sharpen your edge with proven tools and frameworks:
News moves markets fast. Learn how to keep pace with SMC-based playbooks:
From NASDAQ opens to DAX trends, here’s how to approach indices like a pro:
Gold remains one of the most traded assets - here’s how to approach it with confidence:
Candlesticks are the building blocks of price action. Master the most powerful ones:
Ready to go intraday? Here’s how to build consistency step by step:
Markets swing between calm and chaos. Learn to read risk-on vs risk-off like a pro:
Step inside the playbook of institutional traders with SMC concepts explained:
Forex pairs aren’t created equal - some are stable, some are volatile, others tied to commodities or sessions.
If you’ve ever been stopped out right before the market reverses - this is why:
Mindset is the deciding factor between growth and blowups. Explore these essentials:
The real edge in trading isn’t strategy - it’s how you protect your capital:
If you’re not sure where to start, follow this roadmap:
This way, you’ll grow from foundation → application → mastery, instead of jumping around randomly.
Follow me for more daily market insights!
Jasper Osita - LinkedIn - FXStreet - YouTube
This content may have been written by a third party. ACY makes no representation or warranty and assumes no liability as to the accuracy or completeness of the information provided, nor any loss arising from any investment based on a recommendation, forecast or other information supplies by any third-party. This content is information only, and does not constitute financial, investment or other advice on which you can rely.
ACY Securities is one of Australia's fastest growing multi-asset online trading providers, offering ultra-low-cost trading, rock-solid execution, technologically superior account management and premium market analysis.
Select the categories and companies you wish to follow directly to your person rss feed.
Create Custom RSS FeedSign up and join over 5,000 professional members who receive personalized news alerts, curated professional connections, and more for free!
Retail futures trading leader NinjaTrader Group has appointed Mark Omens as Senior Vice President, Commercial Strategy, bringing a 25-year veteran of derivatives marketplace CME Group into a newly created role focused on exchange partnerships and enterprise growth.
Gold Price Action Forecast: Will XAU/USD Drop to $3930? Meta Description: Read our Gold price action forecast to see if XAU/USD will drop to $3930.
BitDelta Securities Financial Services LLC (“BitDelta Securities”) today announced that it has received full regulatory approval from the Capital Market Authority (“CMA”) of the United Arab Emirates under the Category 5 — Arrangement and Advice license framework (License No. 20200000439). The approval follows the firm's receipt of In-Principal Approval earlier this year and represents the successful conclusion of the CMA's full licensing process, including the satisfaction of capital requirements, governance appointments, and operational setup.
Crypto.com has received a $400 million strategic investment from Citadel Securities, valuing the firm at $20 billion. It marks the first institutional funding round in the company's history, aimed at accelerating its expansion into tokenised securities, derivatives and other asset classes.
WTI’s pullback into $79–82 is the first major test of the bullish Elliott Wave count, with buyers targeting a renewed break above $85.

BitDelta Securities has secured a full CMA Category 5 licence in the UAE and opened a regulated office in Business Bay, Dubai. The firm operates as an introducing broker, connecting investors with licensed international brokers across multiple asset classes, with CEO Dr. Demetrios Zamboglou commenting on the milestone.
Index volatility is asleep while single stocks fight it out underneath, credit refuses to confirm the equity rally, and a bare macro calendar hands next week to oil.
Digital assets and FX brokerage GC Exchange FZE (GCEX) has appointed Mohammed A. Mulla as a Board Member of its Dubai-based entity, part of the wider GCEX Group.
Learn what Blockchain-as-a-Service is, how it works, and why businesses are using BaaS to build blockchain applications without managing infrastructure.
CFDs vs stocks compared on leverage, ownership, costs, dividends, taxes, and risk. Learn the differences between stocks and CFDs and discover which suits your investing or trading goals.


