just now

Liquidity Finder Ltd is incorporated in England and Wales, company number 10610740, registered address 167-169 Great Portland Street, Fifth Floor, London W1W 5PF, United Kingdom.
Published: just now

Why Jobs Report is Market’s Most Explosive Data
The U.S. Unemployment Rate data is released every first Friday of every month and this report measures the percentage of the labor force that are unemployed. The most famous measure is the U-3 rate tracking the active job seekers.
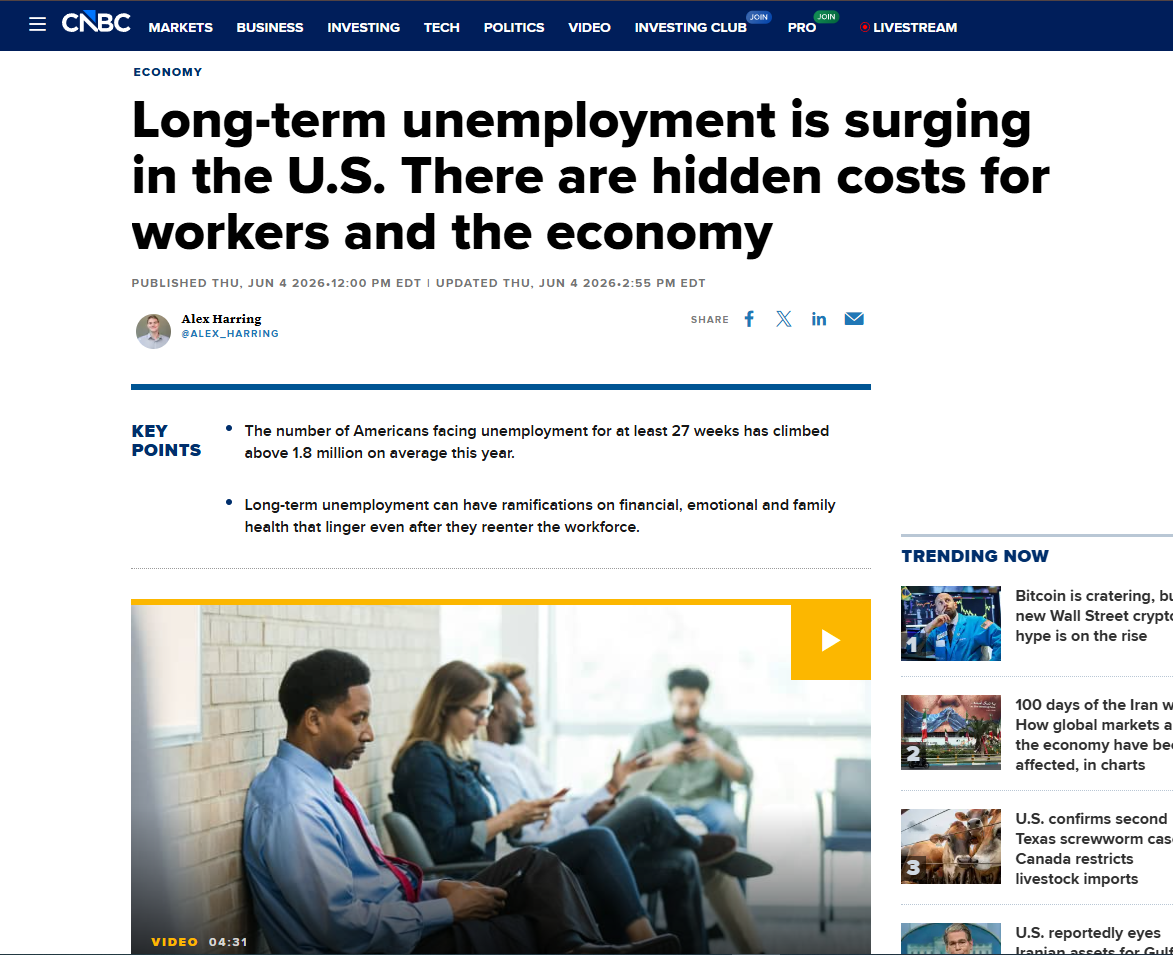
Source: CNBC
This economic indicator stands as the ultimate scorecard. With its important percentage shows us how much of the active labor force is currently sitting being jobless. It rises and falls alongside shifting economic conditions. And as this metric is a lagging indicator, the data changes only after the broader economy has already shifted.
The most recent and historical data timeseries of these reports are always available directly from the Bureau of Labor Statistics.
U.S. Unemployment Rate Computation and Measure
The U-3 rate is the most commonly quoted number. The Bureau of Labor Statistics releases this specific figure as a major part of its monthly employment situation report.
This specific rate defines unemployed people, must not be working nor not currently holding a job. Aside from the jobless individual, must be entirely willing and completely available to start for a brand new position soonest or being available to work.
To be counted in this group, a jobless person must have actively sought work within the past four weeks and if they refrain from job searching entirely, the government no longer counts them in this specific metric. The rules are strict.

Who are included in the official Unemployment Rate?
Based from the Bureau of Labor Statistics, you are fully employed if you work as full-time, part-time nor just hold a temporary position. Even unpaid workers are counted or included here.
And if you perform at least 15 hours of unpaid work for a family business, the government considers you employed. But note that the unemployment rate calculation handles jobless people may vary. Some who are seriously willing to work yet cannot find a job sooner become discouraged and stop looking altogether. They leave the labor force. This is because these discouraged job seekers stopped searching and they do not count as officially unemployed. Instead, the agency labels them as outside the labor force.

Why are some numbers seasonally adjusted?
The final unemployment rate often receives a special seasonally adjusted tweak. This mathematical change accounts for highly predictable shifts in the job market, like the massive wave of extra retail hiring during the winter holiday season. It keeps the data smooth.
By adjusting for these expected seasonal swings, experts reading the BLS employment statistics can see the true underlying trends in the economy. The BLS also provides an unadjusted rate for anyone who just wants the raw data. Both numbers provide immense value.
Who is entirely excluded from these surveys?
Not every single person in the country makes it into the final data pool. The survey skips anyone under 16. Those who are serving actively in the Armed Forces are also completely excluded from these BLS employment statistics. Also, the individuals residing within the correctional facilities like mental healthcare centers, and similar long-term institutions do not participate in the research. The survey only counts civilians.
Why this matters to the Traders?
The unemployment rate acts as the heartbeat of the economy. Traders are concerned about it due to Central Banks (like the Federal Reserve) forces to make moves or decisions that shift the value of money and stocks.
When you see the unemployment number, you aren't just looking at jobs, you are seeing the future direction of interest rates including the corporate profits. If jobs data looks strong then the economy is likely hot and if they look weak, then the economy is likely cooling down.
Interpreting the Unemployment Data
Reading the economic news can be quite confusing. You might see a huge headline about jobs and think you instantly know the whole story. Mostly it is often a trap when you don’t watch out.
To truly interpret unemployment data, you must dig much deeper into the actual details. You have to look past that single, flashy number to evaluate three distinct categories as these groups telling what is actually going on in the real world by revealing the natural ups and downs, the permanent market shifts and the hidden math distortions. You must evaluate all three areas together.
How Do Cyclical Forces Help You Interpret Unemployment Data?
The first category to review involves cyclical forces that drive hiring. These factors represent the natural ups and downs of a standard business cycle. They happen all the time.
To be able to grasp this cycle, you must look at the specific economic metrics. Example like the Gross Domestic Product growth, Interest Rates, and Inflation as these directly influence how many people get hired or getting jobs. When the economy slows down, hiring naturally drops.
You must also include evaluating the increase or rise of the automation alongside global trade. Additionally, skill mismatches and shifting demographics leave a permanent mark on employment. These factors reshape.
Why Do Statistical Nuances Distort the Headline Number?
And lastly, you have to account for methodological discrepancies with these statistical nuances can create hidden distortions in the final report and because of these tricks, the economy might appear much stronger or weaker than what truly it is.
To get the real story, you must check a few specific data points. Look closely at changes in labor force participation. Also, pay attention to varying survey definitions and the off-the-books informal sector.
Summarizing Market Factors
You must track the natural business cycle, permanent changes, and survey differences together. Reviewing these three unique categories reveals the actual strength of the economy.
Trading the Unemployment Rate
Trading the unemployment rate relies on a strict, disciplined strategy. This major report moves markets incredibly fast. You simply guess which way the wind will blow. Have a plan. Instead of speculating, you need a system. We will look at how to prepare, choose an execution style, and manage your downside. You must assess the context before making a single move. First, look closely at how the actual numbers deviate from expert forecasts. This difference drives the initial panic or relief in the market. Always check for revisions to the prior month's data. Sometimes, an old number changes and shifts the entire story. You should also see if the market feels overstretched in one specific direction, the context.
High Risk Management Trading
What are the best execution styles for high-impact data releases?
Once the news drops, you have three main paths to take. You can choose the wait and see method. This lets the wild initial volatility settle before you follow the real trend. Patience often pays off.
Another option is trading a breakout when news pushes prices past key levels.
Also, you could try to mean revert the market. This involves speculate against the initial spike once its momentum finally exhausts. Pick one solid approach.
You need strict risk management to survive these intense price swings. Huge, sudden price jumps and execution slippage will quickly destroy a sloppy account.
To fight this, immediately reduce your position size. Protect your cash.
Next, always use hard stop-losses. A hard stop will pull you out if the market turns violently against you. Never trade without them.
Why look beyond the main unemployment numbers?
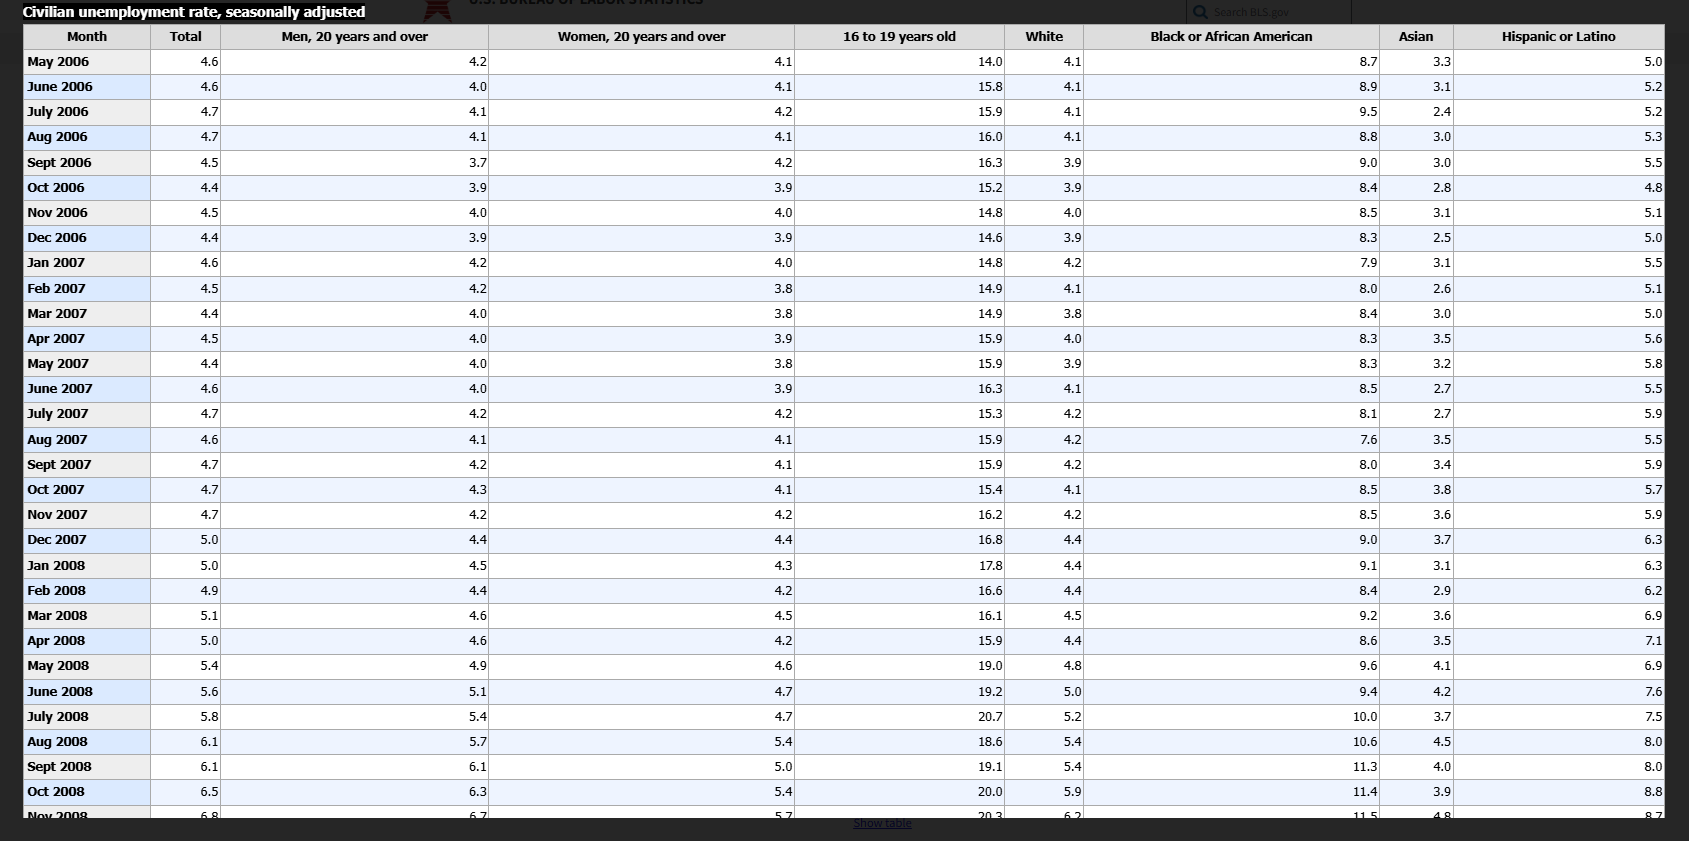
Source: Bureau of Labor Statistics
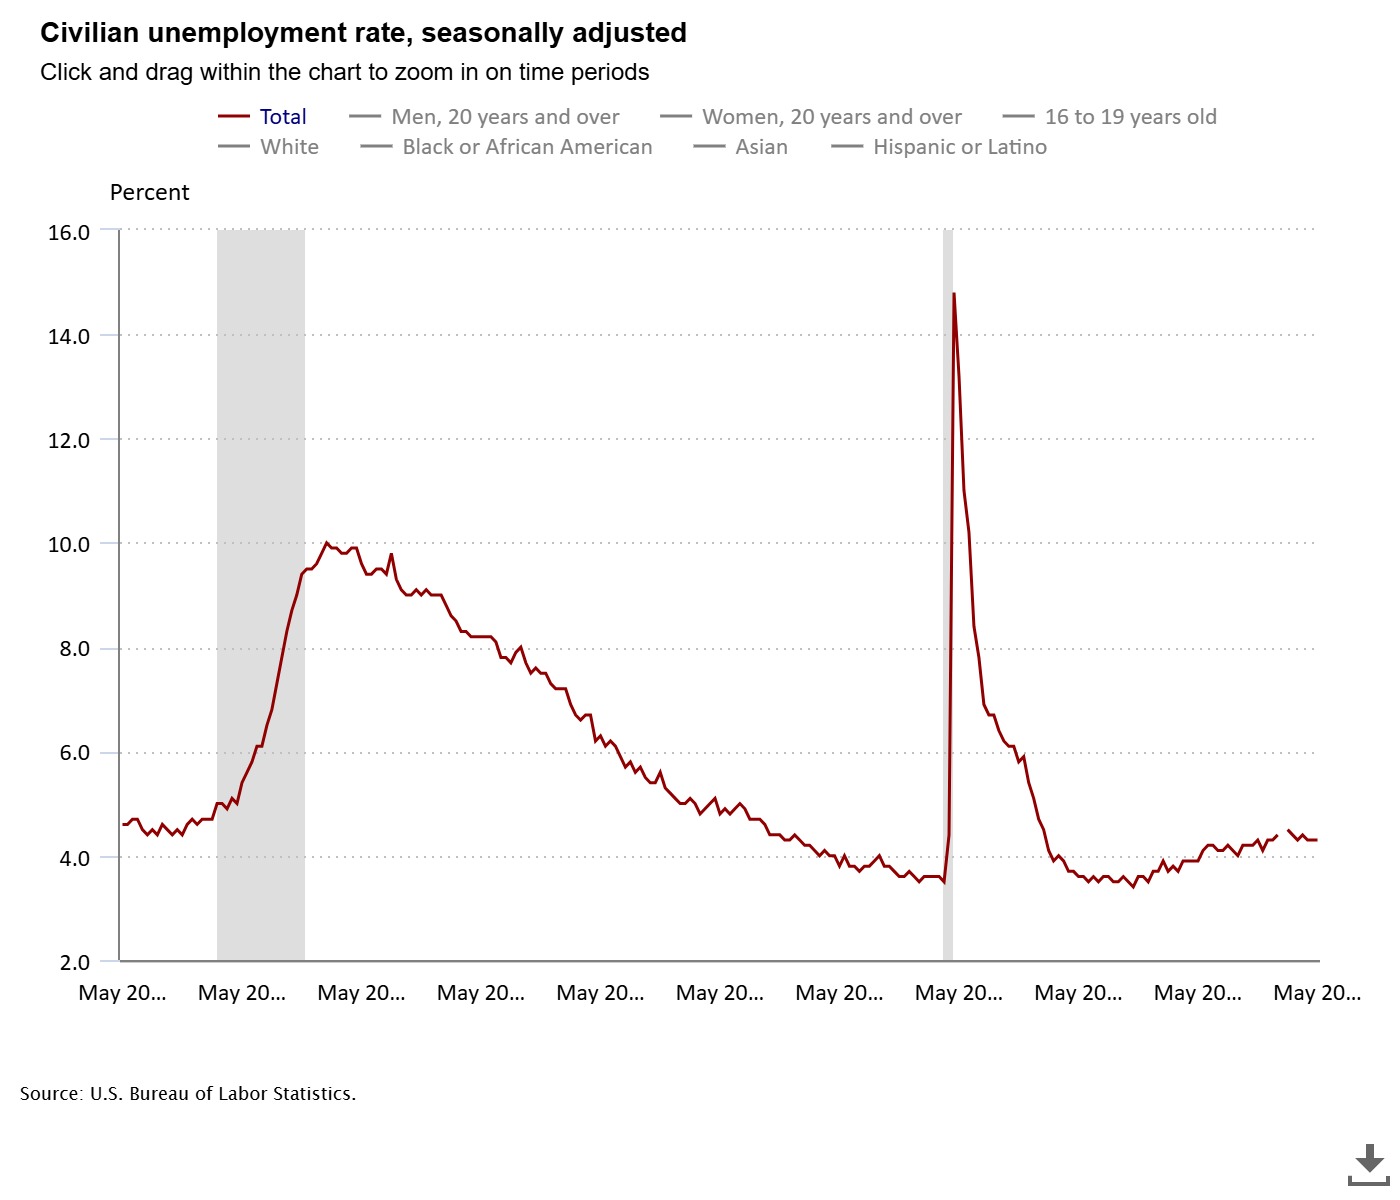
Source: Bureau of Labor Statistics
Do not just read the headline report. You must always cross-reference the main number with the labor force participation rate. This extra step reveals much deeper facts.
Why does this matter so much?
It helps you determine if the price move shows genuine economic health. Sometimes, a statistical distortion causes a false market rally. Check every detail.
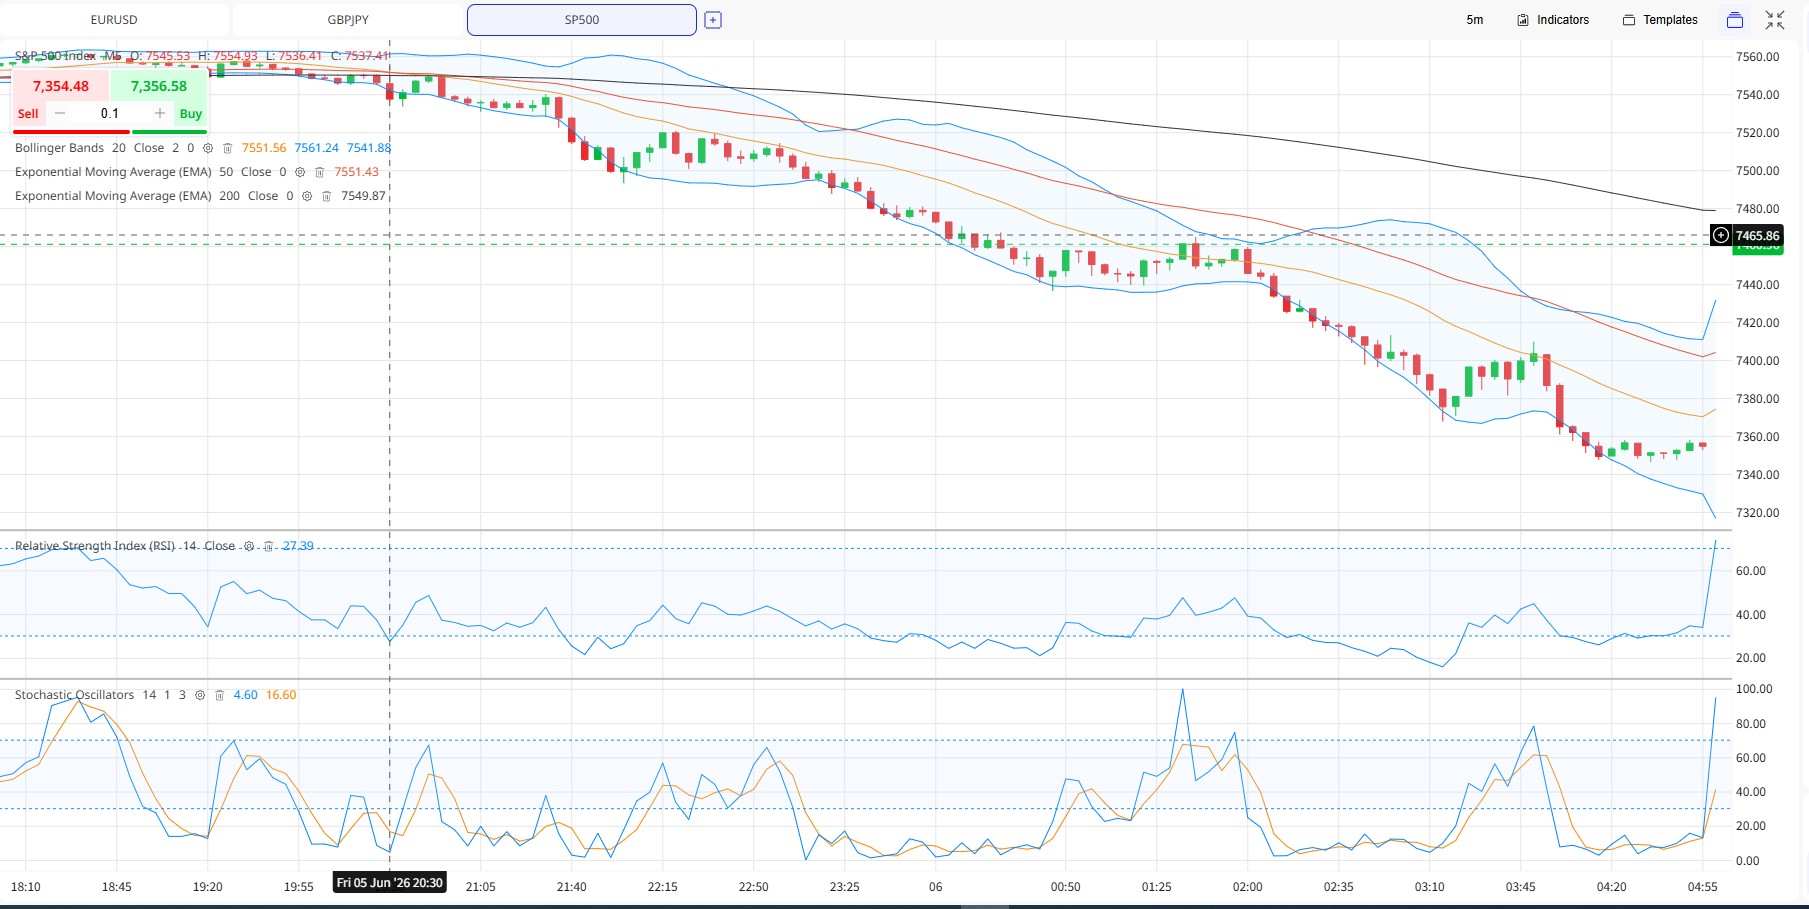
Below is an example the reaction of US Stock Index S&P500 from the release of
Unemployment Rate data.
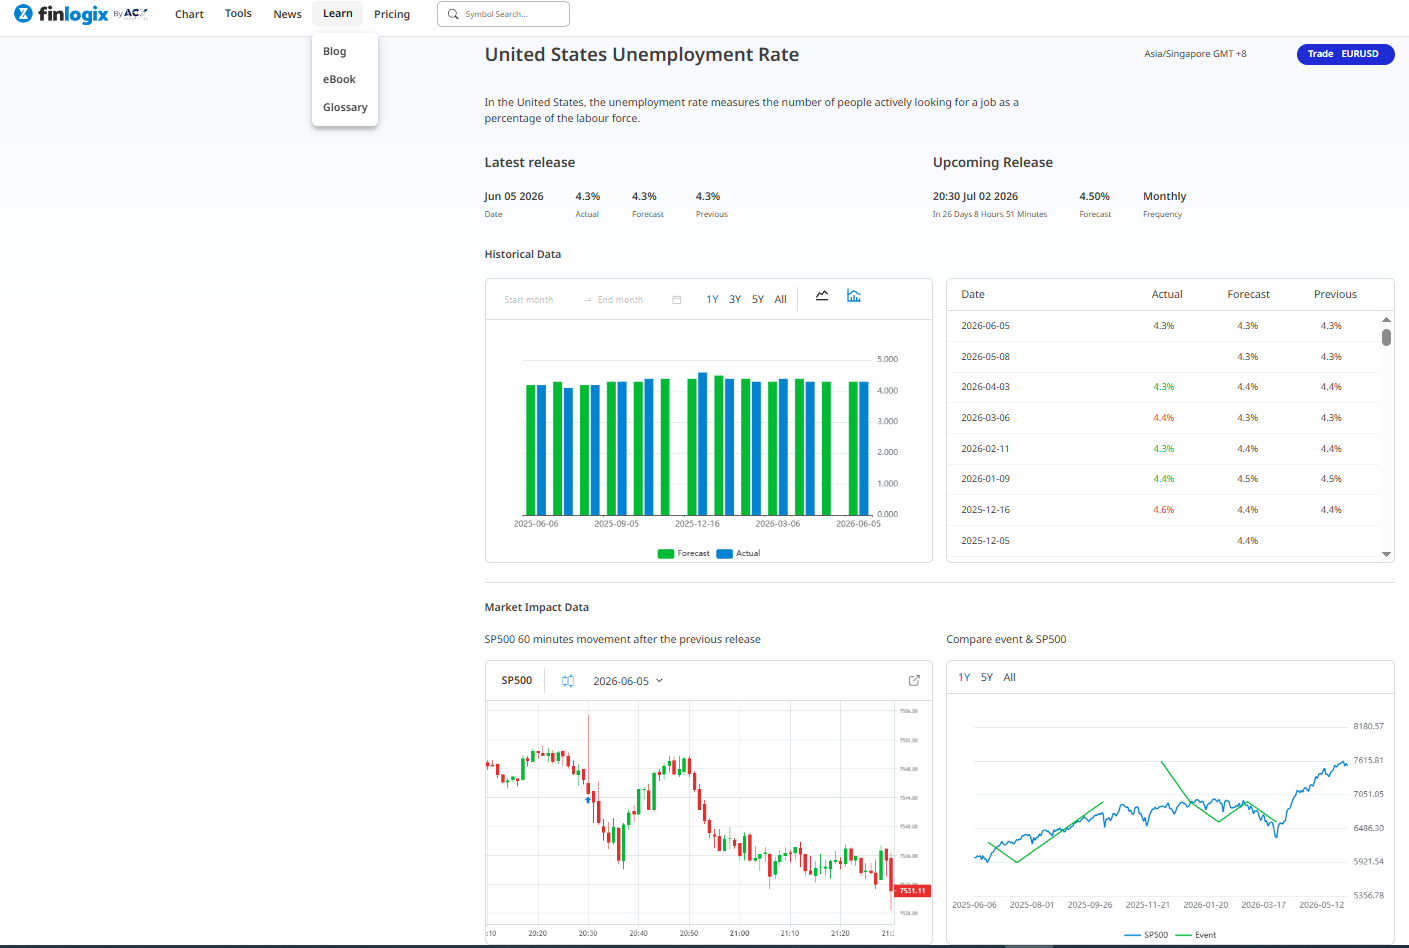
Source: Finlogix
Because markets are forward-looking, they don't just react to job data they react to what that data signals about future interest rates.
Market Reaction to Job Data
When the Negative News is a Positive Tone
Markets look ahead at future interest rates rather than reacting to past statistics. Rising unemployment can actually push stock prices higher by lowering inflation fears. Economic context is everything, as reactions change entirely during a recession. Wage growth and labor force participation reveal the true direction of the economy.
Why stocks go up when the economy loses jobs?
To understand the true market reaction to job data, you must look what is the future outcome. They do not just react to what happened yesterday. Instead, they react to what those exact numbers signal about upcoming financial conditions. When investors read the latest employment reports, they are actually trying to guess future interest rates. It is a massive game.
By predicting the actions of the Central Bank, traders decide whether to buy or sell. Lower borrowing costs make everything look incredibly attractive to eager buyers. This entire puzzle can feel backward at first glance. However, the logic makes perfect sense.
How Does the Market Reaction to Job Data Create a Paradox?
Sometimes, reports of rising unemployment will actually boost the stock market to entirely new highs. A cooling labor market lowers inflation fears. Investors love this setup.
When inflation fears drop, traders expect the Central Bank to cut interest rates quickly. Lower rates make borrowing cheaper for everyone. Because cheap money makes stocks look much better than boring bonds, investors rally when they expect supportive policy. The market soars.
Why Does the Current Economic Context Matter?
Reaction always depends heavily on the current economic cycle. Context means everything.
During a growth period, investors welcome a slight cool down to prevent painful rate hikes. A recession changes the mood. During those darker times, rising unemployment proves that corporate earnings are actively collapsing across the board. People panic and sell.
What Should You Look for Below the Headline?
The flashy headline never tells the whole story. To predict the next move accurately, you must dig deeper into the actual labor statistics. Hidden details matter.
How Do Specific Metrics Alter the Job Data Market Reaction?
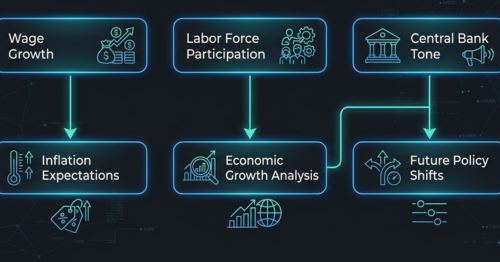
Wage Growth This directly drives inflation expectations.
Labor Force Participation This shows if the economy is truly growing.
Central Bank Tone This provides a hint at future policy shifts.
Traders are making a huge bet on future policy. They desperately want to know if the data will push the Central Bank toward tighter or easier rules. Understanding this hidden layer helps you see the reality. Then, you may trade.
Disclaimer: This content may have been written by a third party. ACY makes no representation or warranty and assumes no liability as to the accuracy or completeness of the information provided, nor any loss arising from any investment based on a recommendation, forecast or other information supplies by any third-party. This content is information only, and does not constitute financial, investment or other advice on which you can rely.
ACY Securities is one of Australia's fastest growing multi-asset online trading providers, offering ultra-low-cost trading, rock-solid execution, technologically superior account management and premium market analysis.
Select the categories and companies you wish to follow directly to your person rss feed.
Create Custom RSS FeedSign up and join over 5,000 professional members who receive personalized news alerts, curated professional connections, and more for free!
MetroTrade has launched options on futures trading in partnership with Devexperts, giving traders access to CME-listed options on futures via the MetroTrader platform. The integration adds options chain, earnings analyser, and multi-leg options tools within a single account interface.
MEXC has appointed Robert MacDonald as Chief Compliance Officer, joining from Bybit where he served as Chief Legal & Compliance Officer. He previously held senior roles at Standard Chartered and Binance, and will lead MEXC's global compliance strategy as the exchange expands beyond crypto trading.
Talos has integrated with Kalshi, connecting institutional algo trading, block trading and retail distribution to Kalshi's prediction and perpetual markets. The move brings Talos's algo suite, RFQ platform and multi-leg execution tools to institutional clients trading event contracts and crypto perpetuals.
Last week we identified five bearish catalysts converging into a single week and argued that the bears had a window but not the narrative. The data came in largely as expected. CPI fell to 3.8%. PPI confirmed the same backward-looking story. Retail sales badly missed, growing 0.2% against a 1.0% forecast. Chair Warsh was guarded in his congressional testimony. Markets had a difficult session before stabilizing after hours on the CPI print.
STARTRADER has launched 42 new 24/5 US stock CFDs and confirmed 43 new 24/7 US stock CFDs from 27 July 2026, giving clients access to 85 widely traded names including NVIDIA, Apple, Tesla, and Boeing, with round-the-clock trading addressing traditional exchange schedule constraints.
Luramic, a regulated provider of institutional liquidity and trade execution services, has announced the launch of its liquidity platform for brokers, hedge funds, and proprietary trading firms.
The Vault has partnered with blockchain security firm Halborn to launch a joint advisory programme helping banks, treasuries and financial institutions design and validate digital asset custody infrastructure, combining architecture design with independent security review through a four to six week engagement.
Marex has partnered with Coinbase to allow clients to use USDC, Circle's dollar-denominated stablecoin, as initial margin collateral for CFTC-regulated derivatives, following a CFTC no-action letter. The service completed its first transaction with Prime Trading, LLC, supported by Coinbase's custody and reporting infrastructure.
cBridge, by Spotware, has launched Markout Report, a risk intelligence module that lets brokers detect toxic flow, rank accounts by financial impact and act before losses accumulate, all within the bridge.
Sterling steadies after political uncertainty rattled gilt markets, while EUR/USD and EUR/GBP approach key technical levels ahead of today's European session.