just now

Liquidity Finder Ltd is incorporated in England and Wales, company number 10610740, registered address 167-169 Great Portland Street, Fifth Floor, London W1W 5PF, United Kingdom.
Published: just now
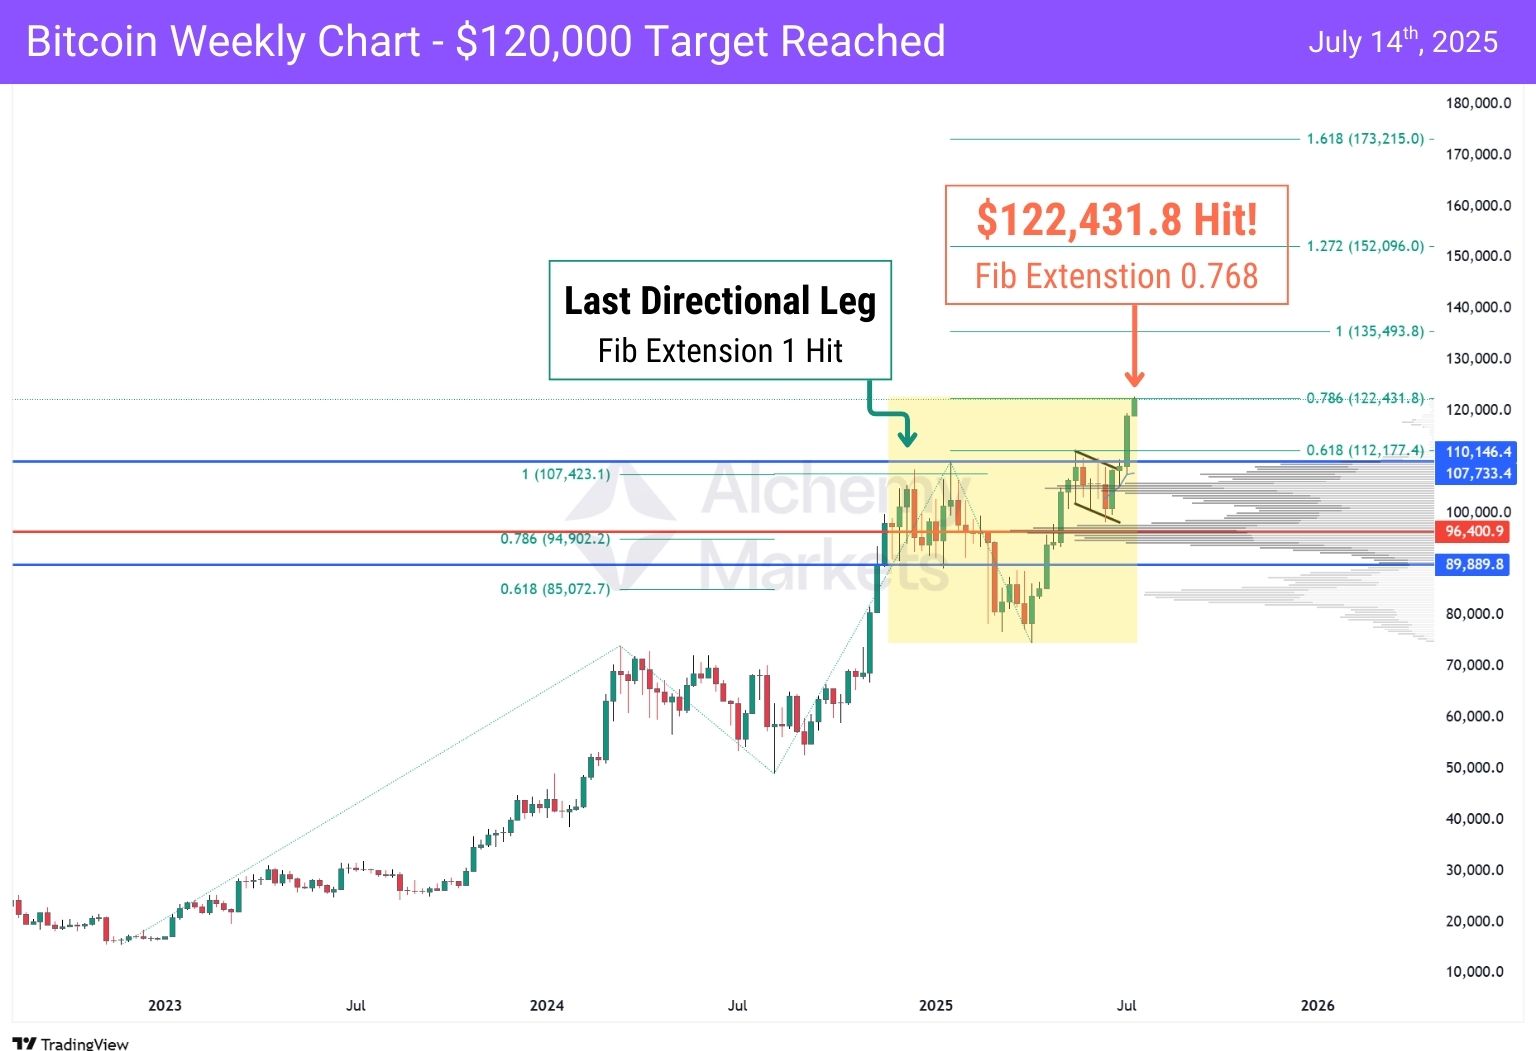
Bitcoin just hit a major milestone — clearing $120,000 for the first time this cycle, and precisely tapping into the 0.768 Fibonacci extension at $122,431.8 on the Weekly Chart. 🚀
Here’s what the crowd is saying.
Futures Exchange Data: According to Coinglass, aggregated BTC futures’ 24-hour trading volume surged +150%, while Open Interest (OI) rose +6.90%. Despite this spike, the funding rate remains moderate at 0.0119%, suggesting the rally isn’t overly leveraged yet. 0.05%+ is elevated, and 0.08% is overheated. Nearly $468M in liquidations shows bears are still getting steamrolled.
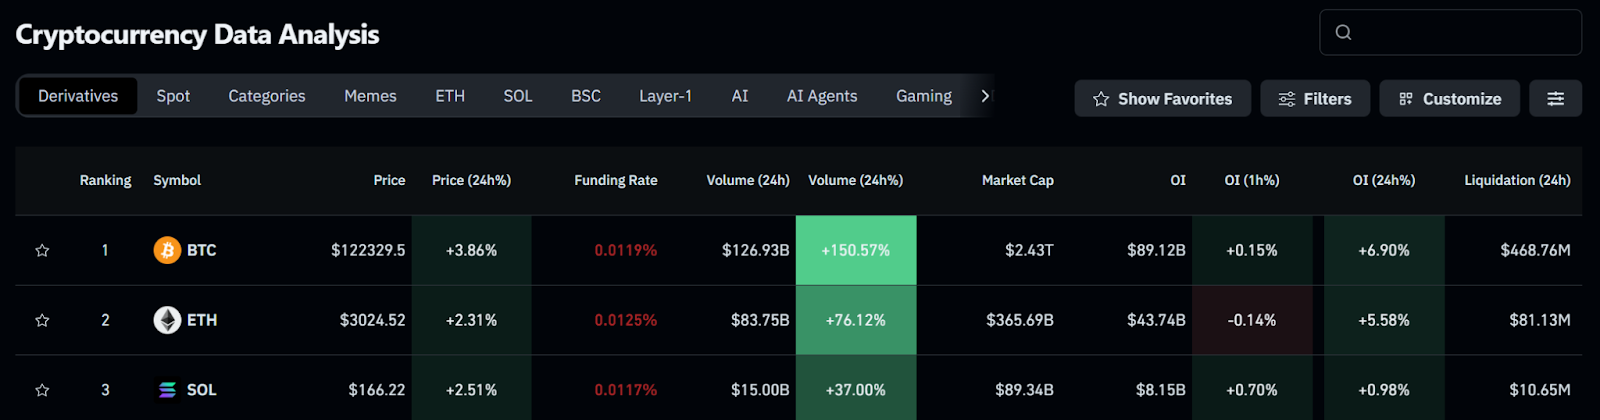
Source: Coinglass as of July 14, 2025
Macro-momentum connection: Multiple posts on X are citing the 108-day M2 money supply lag—a liquidity signal that often precedes Bitcoin rallies by ~3.5 months. With global liquidity rising, the $120K breakout may have deeper roots than mere hype.
Institutional shift: Traders on X note that large wallets have stopped shorting aggressively. Chatter suggests institutions are closing bearish bets and repositioning for upside — likely eyeing the next Fib zones around $135K–$140K. Bitcoin Spot ETF inflow data from Coinglass supports this shift (updates a new bar every 24h), showing renewed demand from institutional buyers.
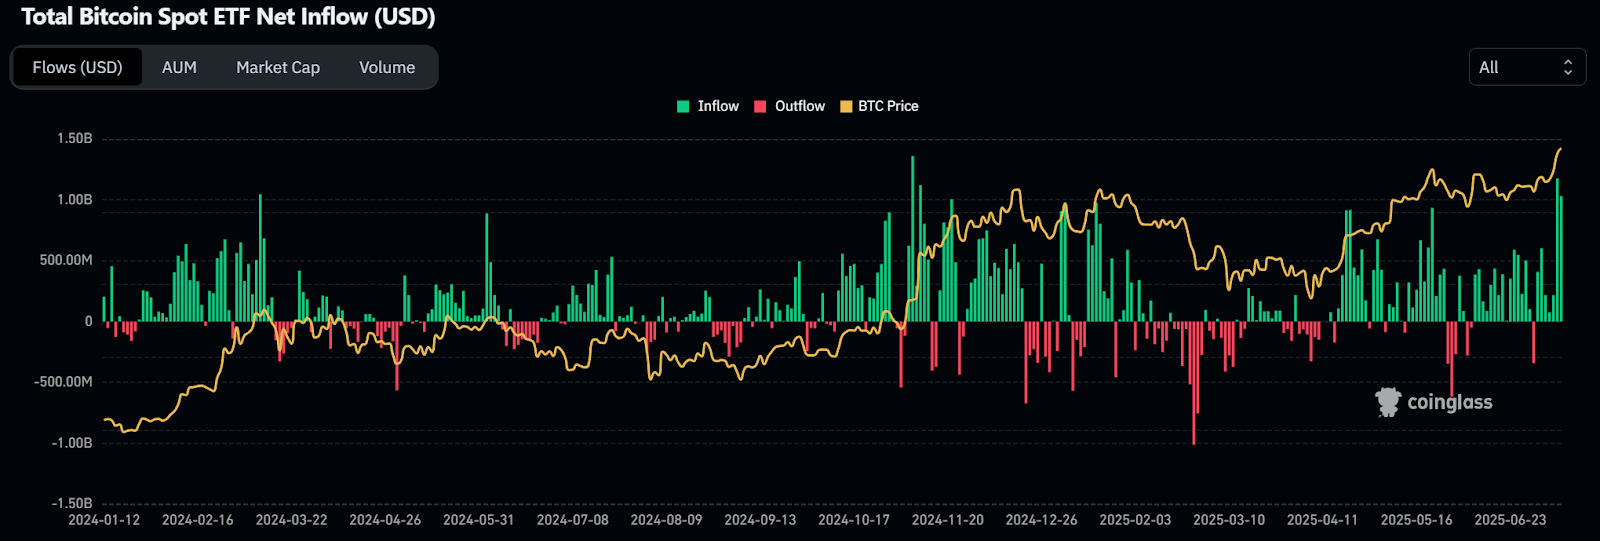
Source: Coinglass as of July 14, 2025
Bitcoin just tagged the $122,431.8 Fib extension (0.768), breaking out of a well-defined bull flag pattern shown on the Daily Chart. This marks a major technical milestone—but also raises the question: is this the start of a larger leg up, or are we due for a pause?
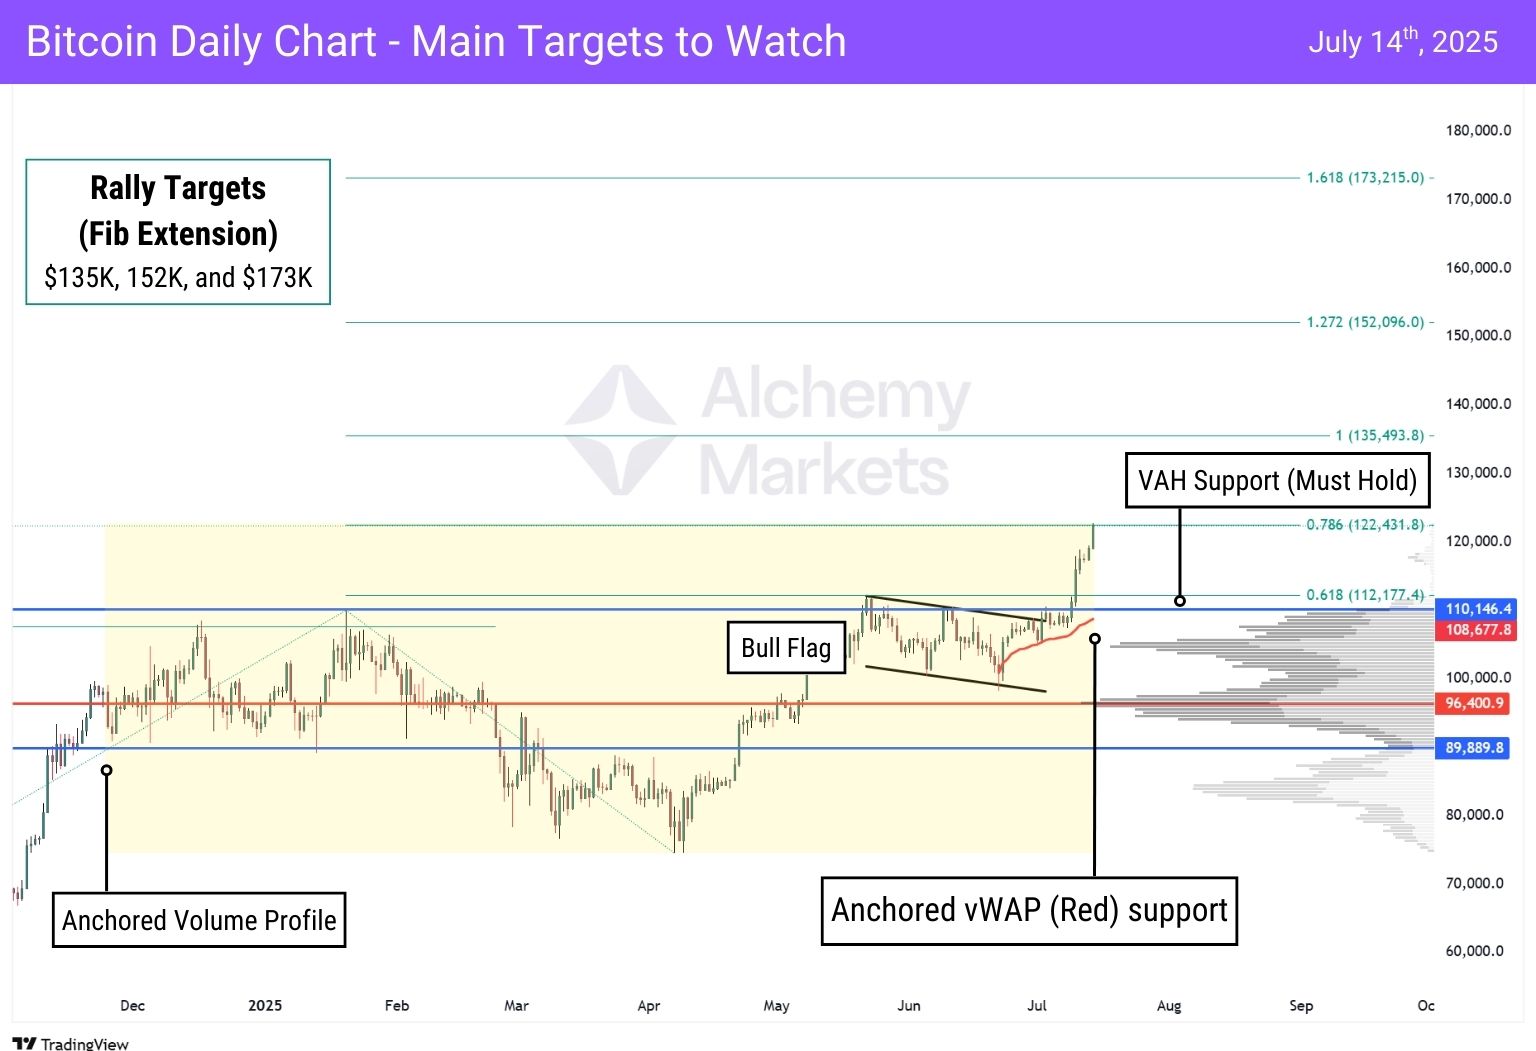
$113K–$110K: Anchored VWAP + Value Area High zone, possible long entry if price pulls back.
$107K zone: Broader range structural support with massive High Volume Node, below this weakens the bullish case.
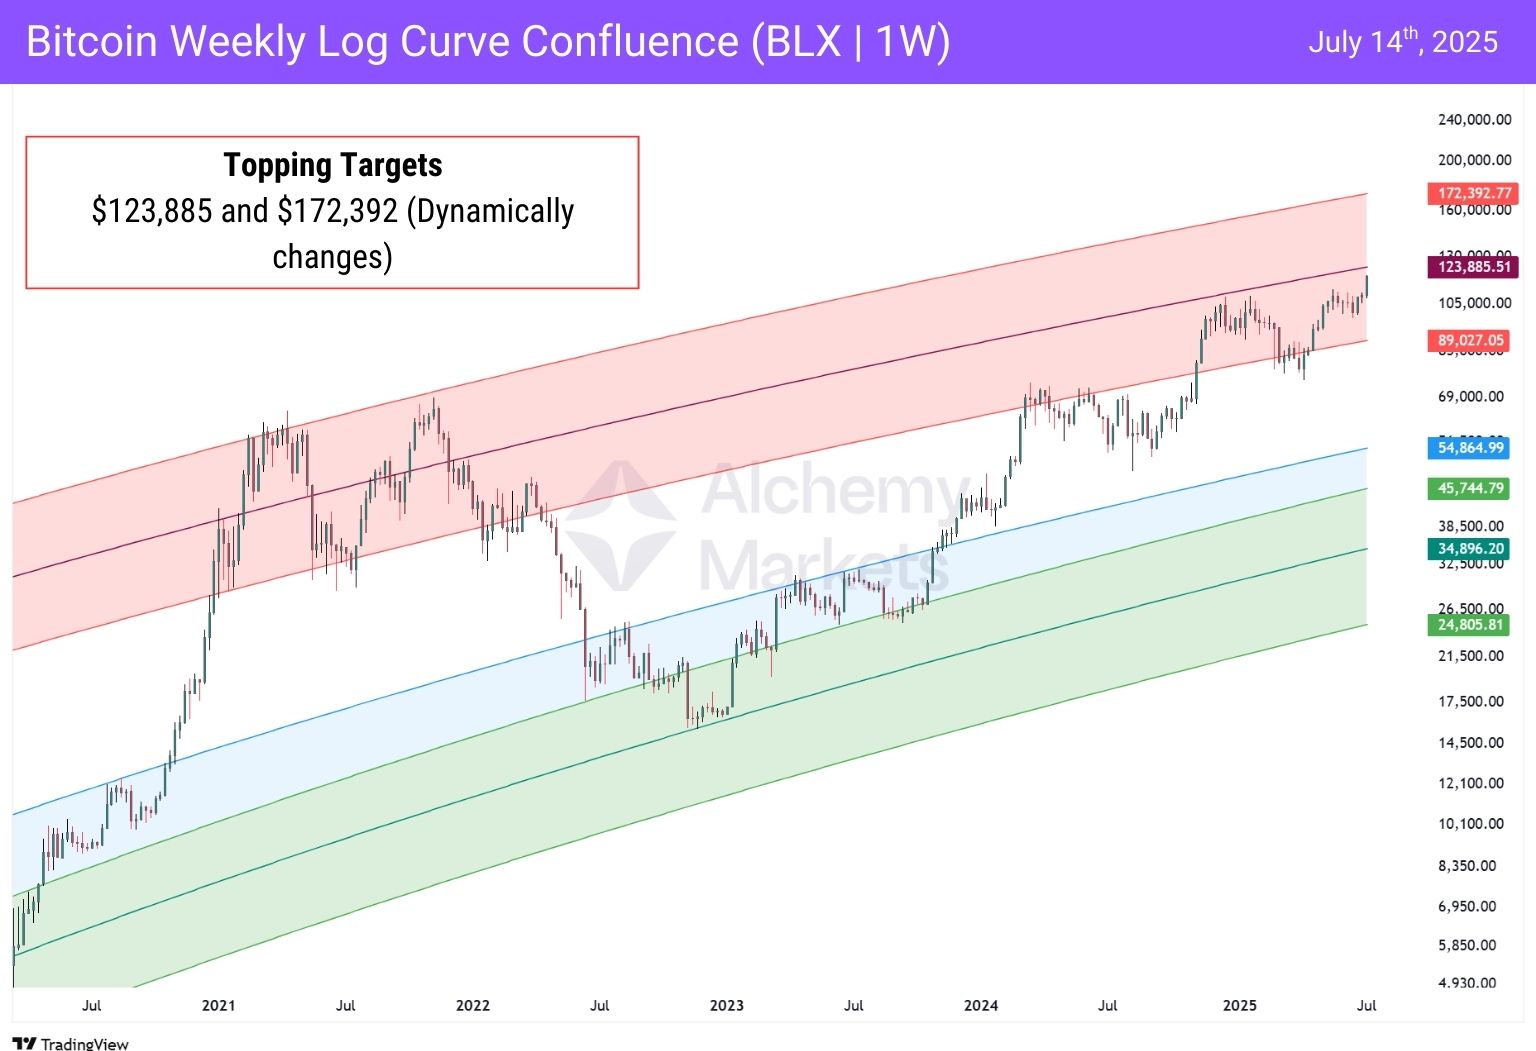
Bitcoin's recent rally smashed into $120K, a level many traders had their eyes on. While this move was expected by those tracking the bull flag breakout and Fib extensions, it also lands Bitcoin within a historically sensitive area for local tops.
We’re referring, of course, to the Weekly Logarithmic Regression Curve, a tool we've highlighted in previous analyses.
Applied to the BLX (Bitcoin Liquid Index) on the weekly, logarithmic scale, this curve has served as a powerful top indicator in the past four major Bitcoin cycles since 2010.
Here’s what the charts tell us:
So no, this isn’t the clear macro top, but it could be a spot where profit-taking accelerates or momentum slows before the next leg higher.
In the worst case scenario, we retrace and the price breaks below $96,000 (point of control). This would then be a real cause for concern, but appears to be unlikely for now.
You may also be interested in:
Are Central Banks Overreacting? What the Copper/Gold Ratio Tells Us
DISCLAIMER: For educational purposes only. Trading comes with substantial risk, leading to possible loss of your capital. Traders are advised to do their own due diligence before investing.
Alchemy Markets is a multi-asset brokerage providing retail traders with the same elite trading conditions, tools, and transparency typically reserved for institutions.
Select the categories and companies you wish to follow directly to your person rss feed.
Create Custom RSS FeedSign up and join over 5,000 professional members who receive personalized news alerts, curated professional connections, and more for free!
Retail futures trading leader NinjaTrader Group has appointed Mark Omens as Senior Vice President, Commercial Strategy, bringing a 25-year veteran of derivatives marketplace CME Group into a newly created role focused on exchange partnerships and enterprise growth.
Gold Price Action Forecast: Will XAU/USD Drop to $3930? Meta Description: Read our Gold price action forecast to see if XAU/USD will drop to $3930.
BitDelta Securities Financial Services LLC (“BitDelta Securities”) today announced that it has received full regulatory approval from the Capital Market Authority (“CMA”) of the United Arab Emirates under the Category 5 — Arrangement and Advice license framework (License No. 20200000439). The approval follows the firm's receipt of In-Principal Approval earlier this year and represents the successful conclusion of the CMA's full licensing process, including the satisfaction of capital requirements, governance appointments, and operational setup.
Crypto.com has received a $400 million strategic investment from Citadel Securities, valuing the firm at $20 billion. It marks the first institutional funding round in the company's history, aimed at accelerating its expansion into tokenised securities, derivatives and other asset classes.
WTI’s pullback into $79–82 is the first major test of the bullish Elliott Wave count, with buyers targeting a renewed break above $85.

BitDelta Securities has secured a full CMA Category 5 licence in the UAE and opened a regulated office in Business Bay, Dubai. The firm operates as an introducing broker, connecting investors with licensed international brokers across multiple asset classes, with CEO Dr. Demetrios Zamboglou commenting on the milestone.
Index volatility is asleep while single stocks fight it out underneath, credit refuses to confirm the equity rally, and a bare macro calendar hands next week to oil.
Digital assets and FX brokerage GC Exchange FZE (GCEX) has appointed Mohammed A. Mulla as a Board Member of its Dubai-based entity, part of the wider GCEX Group.
Learn what Blockchain-as-a-Service is, how it works, and why businesses are using BaaS to build blockchain applications without managing infrastructure.
CFDs vs stocks compared on leverage, ownership, costs, dividends, taxes, and risk. Learn the differences between stocks and CFDs and discover which suits your investing or trading goals.


