
just now


Liquidity Finder Ltd is incorporated in England and Wales, company number 10610740, registered address 167-169 Great Portland Street, Fifth Floor, London W1W 5PF, United Kingdom.
Published: just now

After a surprisingly resilient start to the year, markets seem to be settling into a new rhythm — one where optimism about growth and fading inflation are finally coexisting. Goldman Sachs’ latest outlook captures the mood: stronger-than-expected U.S. growth (2.8% full-year GDP forecast for 2026) and softer inflation (core PCE seen at 2.1% by year-end).
That combination — solid growth without an inflation rebound — is pretty much the dream scenario for investors. And for now, it’s being reflected in asset prices. Equities remain near record highs, credit spreads are calm, and volatility is muted.
But beneath the surface, the story isn’t completely smooth. The U.S. labor market looks softer, AI-driven efficiency talk is raising job security questions, and rate-cut expectations are slowly adjusting. The Fed has made it clear they’ll move carefully, and next week’s data — while not game-changing — will serve as another check on that cautious optimism.
Here’s what traders and investors will be watching most closely:
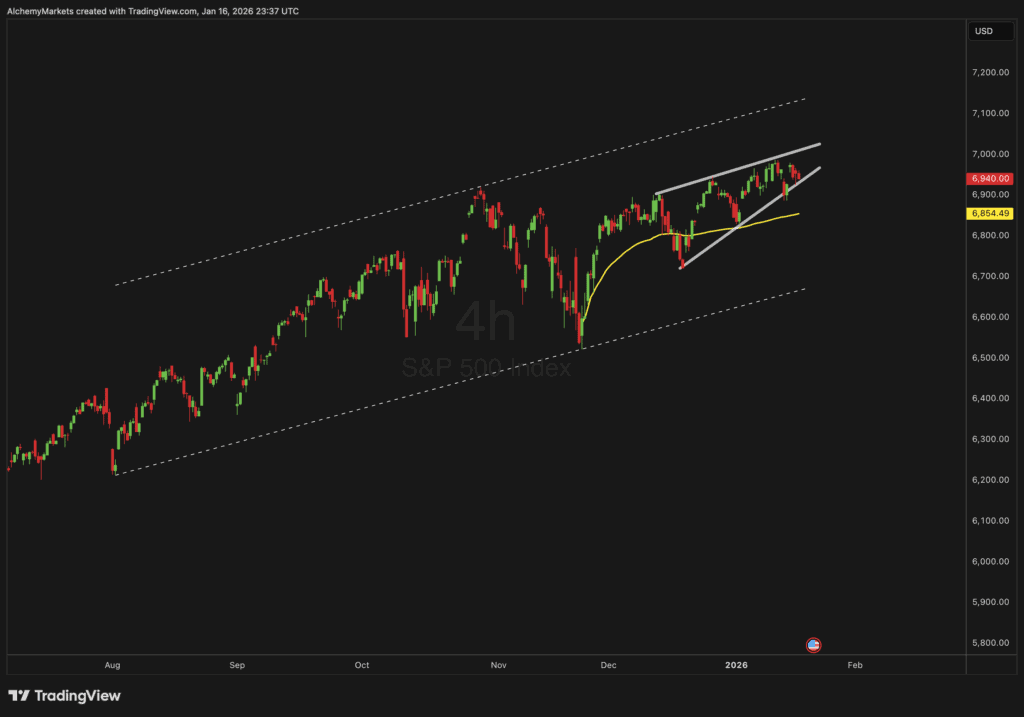
Taking a look at the 4-hour SPX chart, the index remains within a well-defined ascending channel that’s been in place since mid-2024. Recently, price action has carved out a rising wedge pattern — typically a sign of potential exhaustion near the top of a trend.
Here’s the technical setup in plain terms:
Scenario 1: Bullish Breakout
If the wedge fails (meaning it breaks higher), momentum could drive price toward the upper boundary of the long-term channel, near 7,150–7,200. That would align with the bullish macro narrative — strong growth, easing inflation, and supportive fiscal policy.
Scenario 2: Bearish Breakdown
If the wedge breaks to the downside, a short-term correction could unfold, with initial support near 6,850 and a potential retest of 6,700 if selling accelerates. That would likely coincide with softer data or renewed Fed caution.
For now, the trend remains constructively bullish, but the wedge pattern signals a moment of decision — expect volatility to tick up as the market tests these boundaries.
The market narrative is still one of optimism — growth surprising to the upside and inflation moving lower — but it’s bumping against technical resistance and economic crosscurrents.
Next week’s data should confirm that the disinflation trend is holding and that the Fed can stay patient. The SPX setup suggests traders should stay alert: whether this wedge breaks up or down will set the tone for the next leg of the move.
Alchemy Markets is a multi-asset brokerage providing retail traders with the same elite trading conditions, tools, and transparency typically reserved for institutions.

Select the categories and companies you wish to follow directly to your person rss feed.
Create Custom RSS FeedSign up and join over 5,000 professional members who receive personalized news alerts, curated professional connections, and more for free!
Theorem has integrated Symbiotic’s Liquid Lane RFQ network, letting holders of tokenised real-world assets trade against on-chain pool liquidity and market-maker quotes. The integration is live on Ethereum, with Midas’s yield-bearing mHYPER fund as the first supported asset. Holders can trade for the USDC stablecoin.
US equities were volatile with technology selloff erasing much of the earlier rebound.
FM Summit London 2026 returns to Old Billingsgate on 24 November for its 15th edition, with LMAX Group, Plus500 and oneZero among confirmed exhibitors. The one-day event adds Business Connect meetings and roundtables, and opens with a networking evening at The Folly on 23 November.
Finance Magnates Summit London returns to Old Billingsgate on 24 November 2026 for its 15th edition. The one-day event brings together brokers, liquidity providers, institutional firms, trading technology vendors, payments businesses and digital asset firms.
iSAM Securities Apex has integrated with Match-Prime, giving brokers access to liquidity across more than 2,000 instruments, with tailored pricing and up to 10 levels of market depth.
propfunding.com's free-entry instant funding changes the order of prop funding. Start trading first. Its free-entry instant funding model offers two qualification attempts without an upfront activation fee.
US stocks closed higher on Wednesday, with the Nasdaq gaining 1%, the S&P 500 rising 0.6%, and the Dow advancing 0.7%, as renewed enthusiasm for AI-related stocks lifted market sentiment.
SpaceX went public in June as a rocket company. On October 20 it reported as something else entirely: an AI infrastructure business, financed by a satellite broadband network, with a launch division attached. Rockets generated 12% of third quarter revenue and lost money. The AI segment generated 52% of revenue and consumed 84% of capital expenditure. Starlink generated 85% of operating profit.
Standard Chartered has signed definitive agreements to acquire 100% of Zodia Custody UK Limited, folding its regulated digital asset custody business into Securities Services. Zodia Solutions will be set up under SC Ventures with bank investors including Northern Trust, NAB Ventures, Emirates NBD and Investcorp.
Bybit Fintech FZE has secured a Virtual Asset Service Provider licence from Dubai’s Virtual Assets Regulatory Authority for Exchange Services, covering spot trading. Bybit’s Peter Loo said the firm hopes to add derivatives, subject to regulatory approvals. Its international Dubai headquarters opened in 2022.