Explore Companies BySectors & Categories
Explore Companies ByUse Cases
Explore Companies ByProducts & Services
Explore Companies ByRankings & Reviews
Featured NewsCompaniesMarketsCryptoTechRegulatoryCommentaryUKUSWorldMore

    Latest Wires

      Daily Newsletter

      LF Daily News

      Daily industry focused newsletter giving you an overview for the financial & finTech industry.

      See All Newsletters
      By clicking "Sign Up" you are agreeing to our Terms of Service and Privacy Policy

      A Guide to Master a Strategy that Works in any Market: The Structure of a Market Trend

      Published: just now

      A Guide to Master a Strategy that Works in any Market: The Structure of a Market Trend

      Post illustration


      Every chart tells a story - Market trends are more than just price movements; they reveal the ongoing battle between buyers and sellers. By understanding market structure through a price action framework, traders can see the bigger picture, identify who is in control, and gain valuable insight into where the market is positioned within its current trend.


      Goal of this lesson


      At the end of this lesson, you will be able to:

      1. Understand the structure of market trends
      2. Identify whether buyers or sellers are in control
      3. Read the story behind price movements
      4. Recognize where the market is within its current trend
      5. Make decisions based on market structure instead of emotions


      Understanding the structure of a market trend


      Post illustration


      Market trend's structures reveals the story behind price action movement. By understanding how prices form trends and structure, traders can identify whether buyers or sellers are in control and make decisions based on the market's direction instead of guessing.


      There are different ways to identify a trend. Relying only on the 50 EMA indicator can help, but reading using price action gives a clearer and more reliable understanding of what the market is really doing.


      If you want sharpen your edge and understand the real context behind market trends, check out these blogs:

      1. A Guide to Master Price Action Strategy that Works in Any Market: How to Master the Trend in Trading Any Market
      2. Master Exponential Moving Average: How to Trade using EMA Indicator with Price Action Analysis?
      3. How to Step-by-Step Swing Trade Gold (XAU/USD) with Pure Technical Price Action Analysis?


      What are the building blocks of a market structure?


      To understand the story of the market, focus on these three building blocks:

      1. Rally A rally is an impulsive move where price strongly moves in one direction, showing dominance from either buyers or sellers.
      2. Pullback A pullback is a temporary retracement against the main trend.
      3. Rejection A rejection occurs when price attempts to move beyond a level but fails and quickly reverses.


      Just like the guides to mastering trends and the break & retest pattern, understanding rallies, pullbacks, and rejections helps you see where the market is and what the current structure is telling you.


      What defines a bullish market structure?


      Post illustration

      Bullish Market Structure


      A bullish market structure happens when price forms higher highs (HH) & higher lows (HL), showing that buyers are in control and pushing the market upward.


      Characteristics:

      1. Higher highs and higher lows
      2. Strong buying pressure
      3. Upward trend or bullish momentum


      Want to understand how to identify higher highs and higher lows? Check out these blogs to learn how to read market structure more clearly:

      1. A Guide to Master Price Action Strategy that Works in Any Market: How to Master the Trend in Trading Any Market
      2. How to Step-by-Step Swing Trade Gold (XAU/USD) with Pure Technical Price Action Analysis?


      Bullish market structure + levels (support or resistance)


      Post illustration

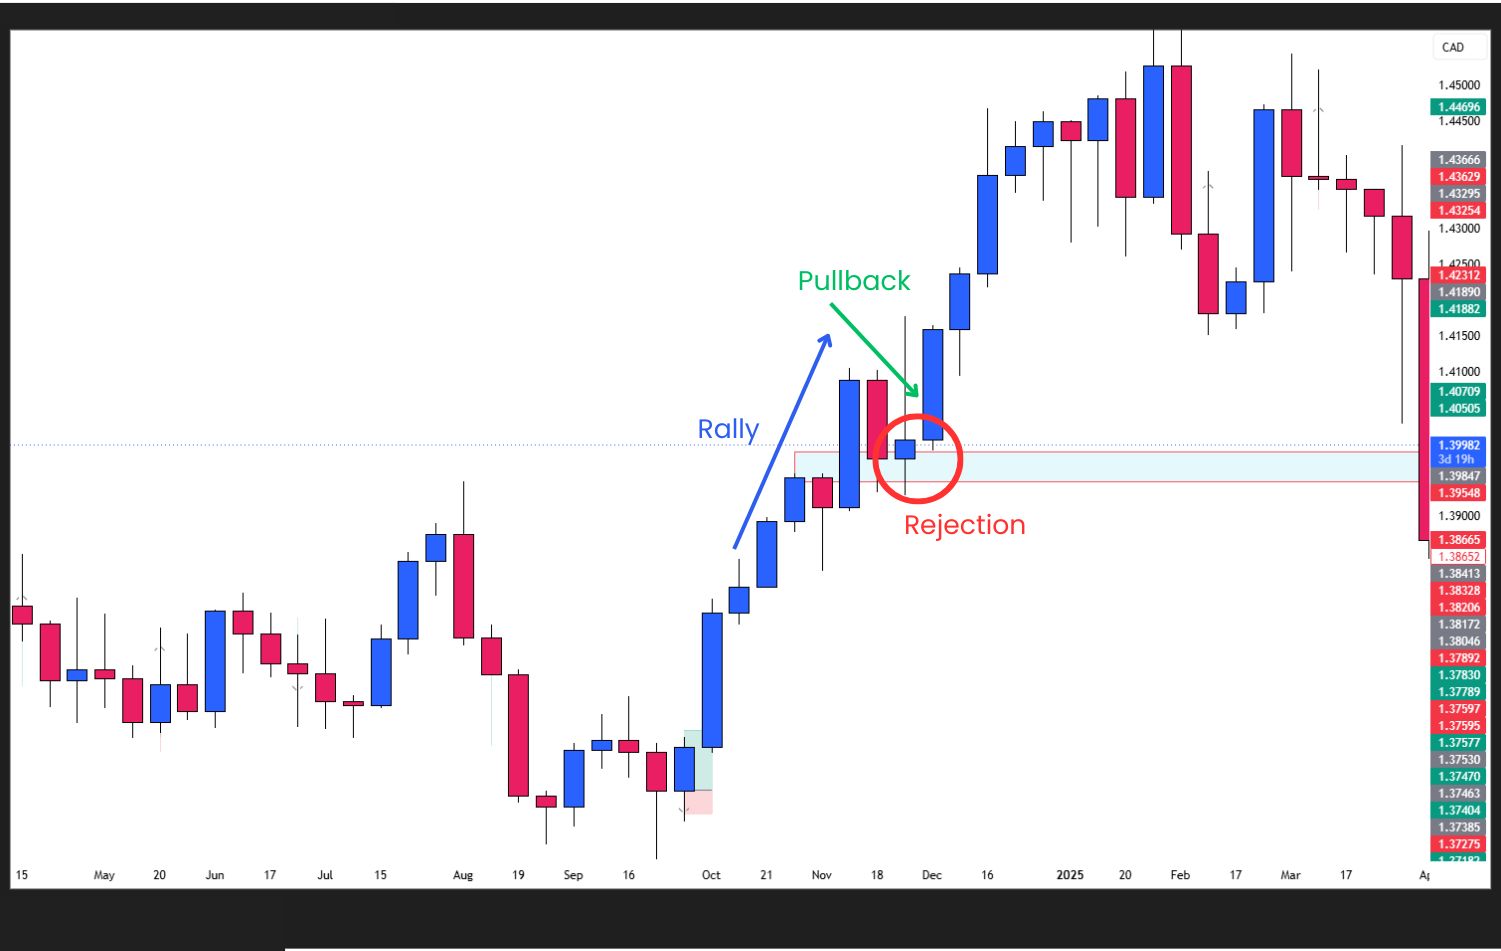
      Bullish Market Structure + Support Level


      Scene Idea: Buyers continue to step in and drive prices higher especially it is best paired up with support & resistance and candlestick confirmation, creating a bullish trend.


      Note: Past performance is not a reliable indicator of future results.


      What defines a bearish market structure?


      Post illustration

      Bearish Market Structure


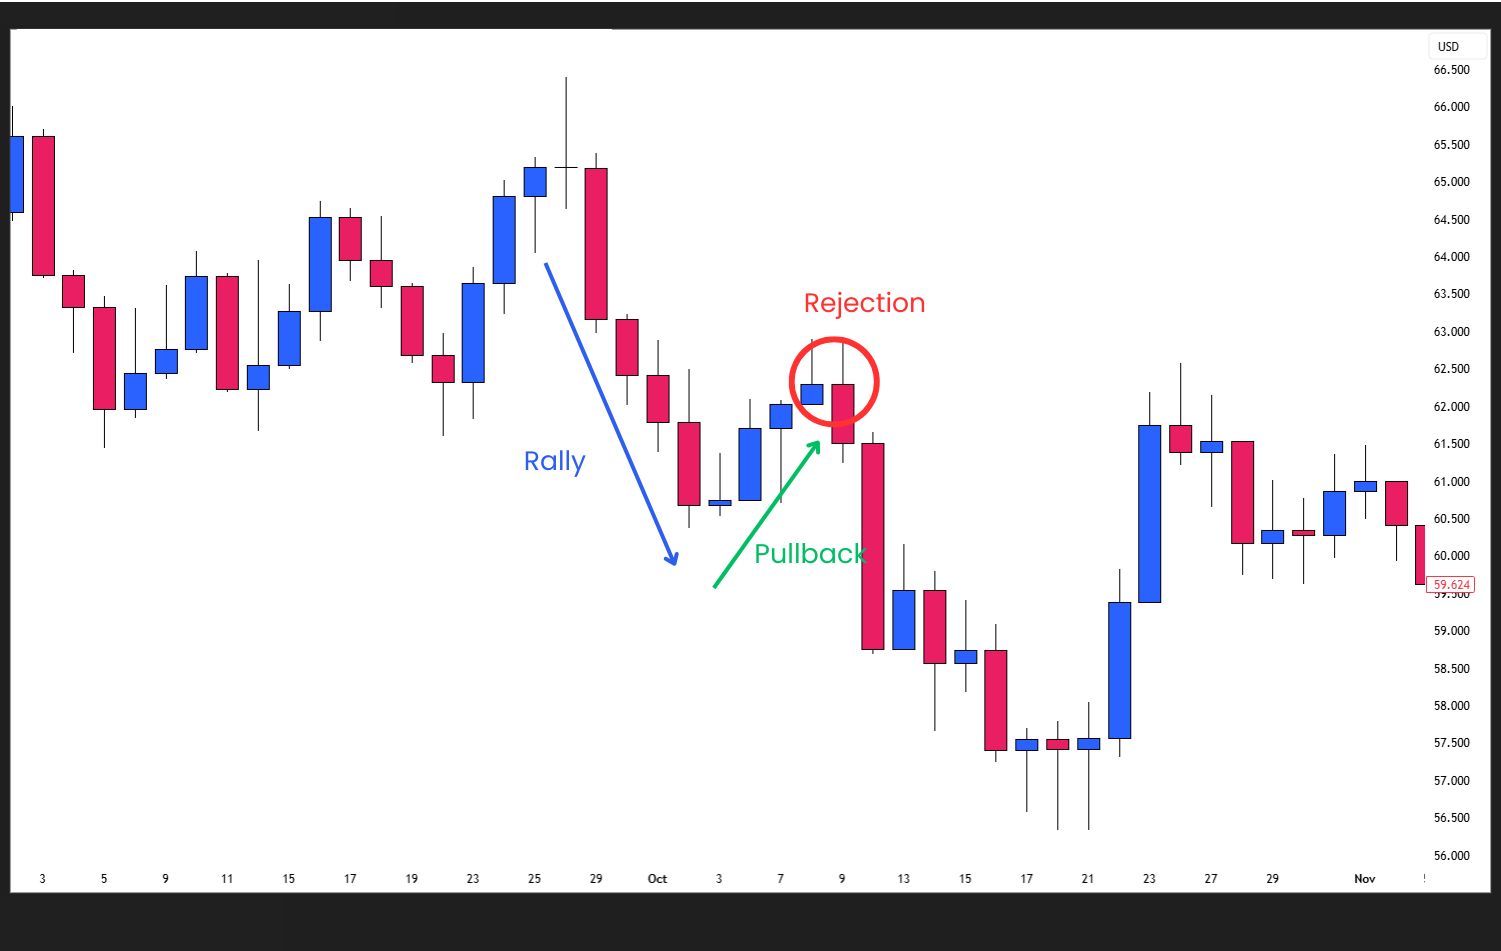
      A bearish market structure happens when price forms lower highs (LH) & lower lows (LL), showing that sellers are in control and pushing the market downward.


      Characteristics:

      1. Lower highs and lower lows
      2. Strong selling pressure
      3. Downward trend or bearish momentum


      Bearish market structure + levels (support or resistance)


      Post illustration

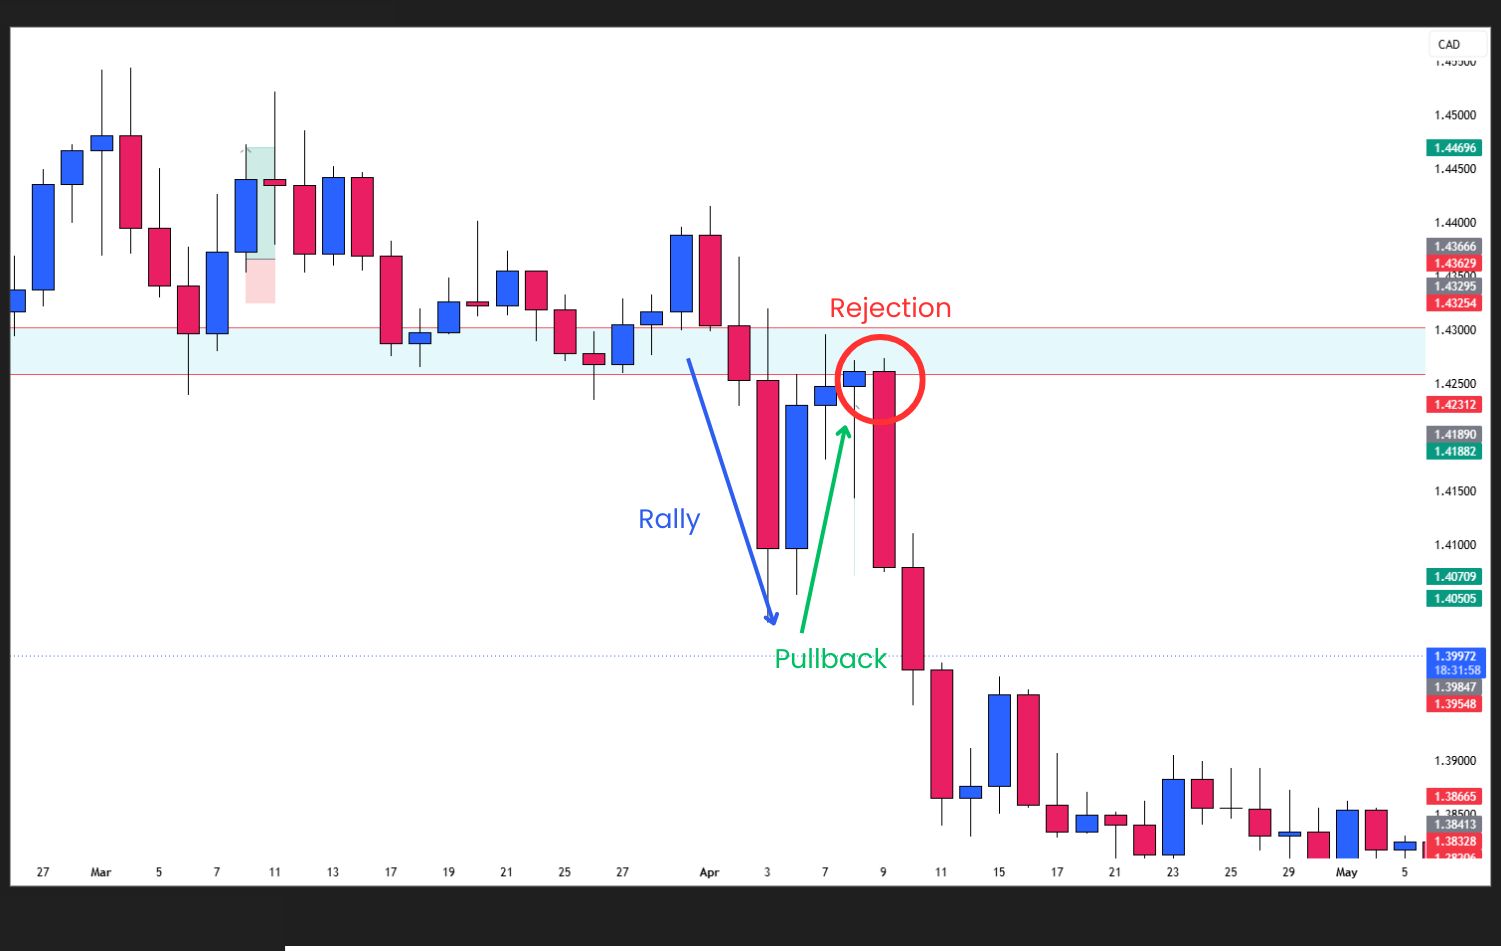
      Bearish Market Structure + Resistance level


      Scene Idea: Sellers continue to dominate, driving prices lower and creating a bearish trend.


      Note: Past performance is not a reliable indicator of future results.


      Market structure works best with candlestick confirmation and the 50 EMA. Check out these blogs to learn how they work together:

      1. The Top Japanese Candlestick Patterns to Trade: Mastering Japanese Candlestick Confirmation + Pairing with Price Action Analysis
      2. Master Exponential Moving Average: How to Trade using EMA Indicator with Price Action Analysis?


      Real-life analogy


      Post illustration


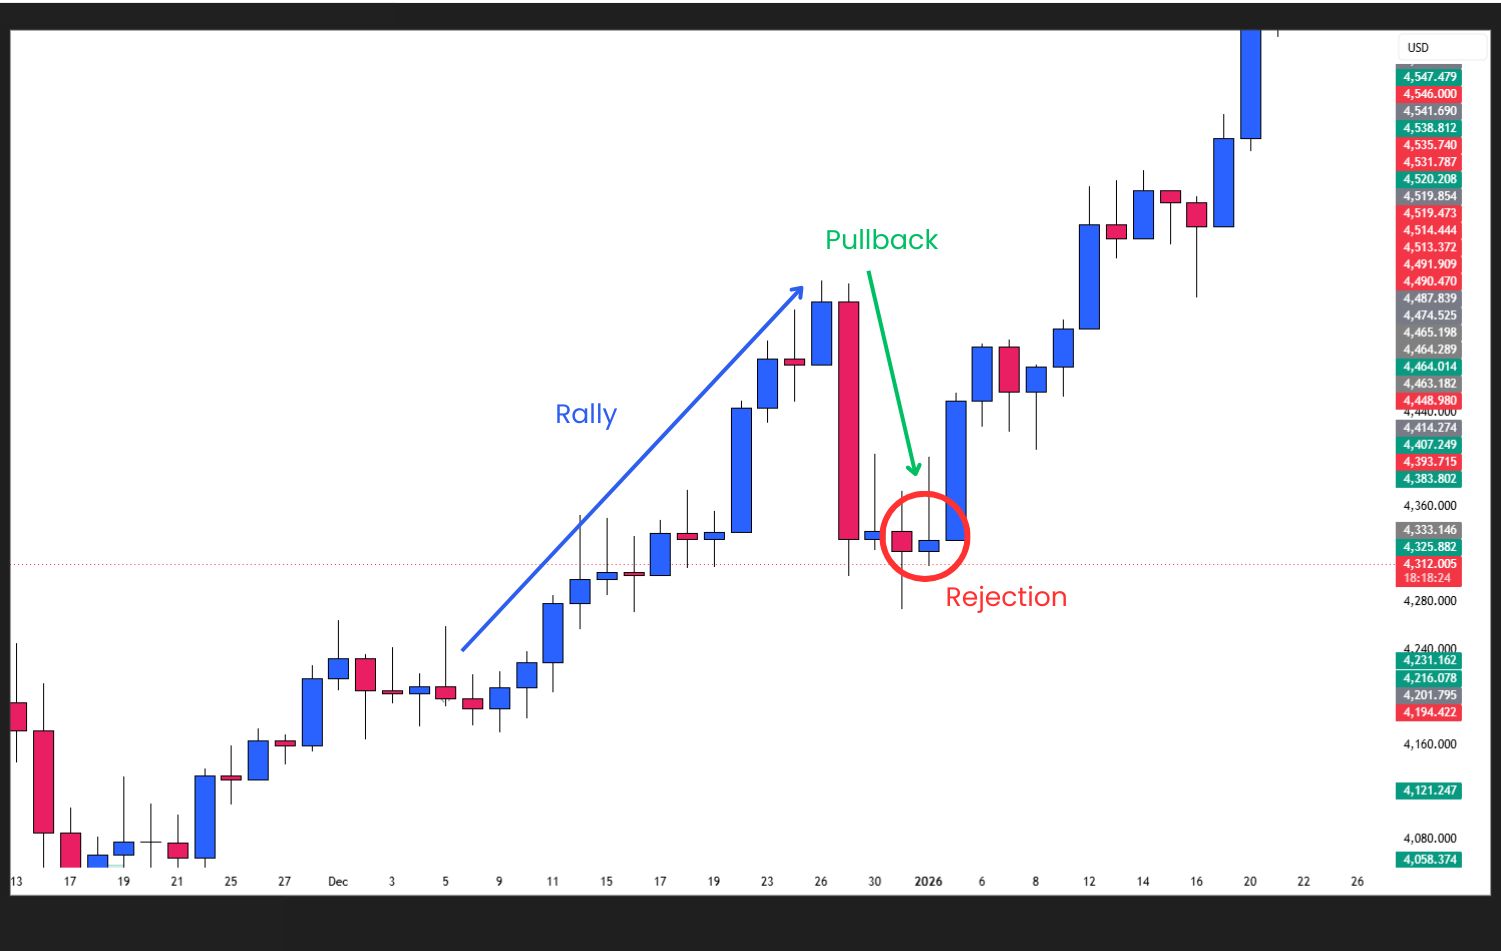
      A market trend is like a rubber band,


      It stretches (rally) as price moves strongly in one direction, building momentum.


      It relaxes (pullback) as price briefly moves against the trend.


      It holds (rejection) when price tests a level.


      Then it continues (rally) as price resumes the main direction, like a snap back into motion.


      Final thoughts


      Post illustration


      The key to mastering price action is learning to read that story!


      By understanding market structure and recognizing rallies, pullbacks, and rejections, you can identify who is in control and where the market is likely positioned within its trend.


      The goal isn't to force the market’s future: it's to read what the price is showing first hand.


      Now that you already understand the structure of a market trend then,


      Your next step is:

      1. To know trader’s beginner steps before your trade
      2. Mastering your psychology
      3. Mastering the simple price action strategy
      4. Mastering Repetitive Patterns in Trading
      5. Trading live using this simple price action strategy


      For more in-depth market breakdowns, real-time analysis, and structured learning content, you can join our Discord community inside ACY Server:

      Discord Server - ACY Securities Server


      Start your live trading journey today!

      • Trade Forex, indices, gold, crypto and other global markets

      • Access powerful platforms including ACY, MT4, MT5, and Copy Trading tools

      Move from learning simple price action to executing it in the real market with confidence!


      Create an Account. Start Your Live Trading Now!


      Check out my contents:


      Beginners path:

      1. Beginner Trading Steps: 4 Rules to Follow Before You Trade
      2. The 1% Risk Rule: The Most Common Mistakes That Quietly Destroys 90% of Traders

      Mastering popular forex pairs using simple price action strategy

      Ready to learn simple price action strategy? Here’s how to do it step by step:

      1. USD/JPY Analysis Today: Simple Trades, Clear Moves, for Beginners Using Price Action
      2. Simple Day Trade Price Action On EUR/USD: Why the Drop to 1.14190?
      3. Simple Price Action Analysis on EUR/CAD: EURCAD the Pair for the Week?
      4. Simple Price Action Strategy on USD/ CHF: 0.80000 the Key Ceiling for USD/CHF Sell?
      5. Price Action Analysis for GBPCAD Trade: A Potential Trade for This Week or Next Week?
      6. EUR/GBP Trading Guide: How to Spot High-Probability Setup a Week Ahead Using Simple Price Action Strategy?
      7. Simple Price Action Trade on CAD/JPY: 115.000 the Key Floor for CAD/JPY Buy?
      8. USD/JPY Price Action Outlook: Is 158.500 the Key Floor for a Potential New High?
      9. CAD/JPY Price Action Breakdown: We Anticipated the Move Twice to 116.500, Is Price Action Really the King?
      10. GBP/NZD Trade Ideas Using Simple Price Action Strategy: Will Price Drops to 2.28000?
      11. USD/JPY Technical Forecast: 158.500 Floor Retest for Preparing for New Highs?
      12. GBP/CHF Price Action Ideas: Is 1.05500 the Ceiling for a New Low?
      13. GBP/CAD Simple Forex Price Action Ideas: Is the 1.84500 Support Level Holding?
      14. AUD/USD Simple Price Action Forecast: Why Buy at 0.71700 Support Area?
      15. GBP/NZD Price Action Idea: Is GPB/NZD 2.3000 Key Floor for Bullish Continuation?
      16. GBP/USD Price Action: Trade Setups on a Ranging Market?
      17. USD/CAD Simple Price Action: Is 1.36500 the Key Bullish Floor?
      18. USD/CAD Price Action Ideas: Setting Up for the Next Bullish Push?
      19. EUR/JPY Price Action: Is It Retesting a Reversal Pattern?
      20. NZD/USD Forecast: Potential Consolidation Breakout on NZD/USD?
      21. AUD/JPY Price Action Forecast: Is AUD/JPY Setting Up for a Massive Sell?
      22. NZD/USD Price Action Forecast: Is a Reverse Double Top Pattern Forming?
      23. NZD/USD Price Action Forecast: Is a Reverse Double Top Pattern Forming?

      Master how to identify market trend

      1. A Guide to Master Price Action Strategy that Works in Any Market: How to Master the Trend in Trading Any Market

      Master how to use break & retest pattern

      Ready to learn and capitalize the repetitive patterns in the markets? Here’s how to do it step by step:

      1. Break and Retest: A Simple Repetitive Price Action Pattern?
      2. Break and Retest: How to Capitalize Repetitive Patterns in Trading?
      3. EUR/JPY Price Action: Is It Retesting a Reversal Pattern?

      Master how to use candlestick confirmation & patterns

      1. The Top Japanese Candlestick Patterns to Trade: Mastering Japanese Candlestick Confirmation + Pairing with Price Action Analysis

      Master utilizing 50 EMA indicator

      1. Master Exponential Moving Average: How to Trade using EMA Indicator with Price Action Analysis?

      Learn how to trade Gold

      Gold is still one of the most traded assets, here’s how to trade it with confidence:

      1. XAUUSD Price Action: A Beginner Buy Setup for Next Week
      2. How to Trade Gold Using Simple Price Action Outlook: 4500 the Key Zone for XAUUSD Buys?
      3. The Simplest Way to Trade XAU/USD Using Price Action Analysis: Buy and Sell Anticipation on Gold?
      4. XAU/USD Price Action: Will Gold Rally to $4,900 Today?
      5. Gold (XAU/USD) Price Action Forecast: Will XAU/USD Drop to $4650?
      6. Gold (XAU/USD) Trade Ideas: A Simple Price Action Analysis on Gold This Week?
      7. Gold (XAU/USD) Price Action Idea: A High-Probability Trade Setup on Gold?
      8. Gold XAU/USD Price Action Idea: Is a Bullish Momentum Coming?
      9. Gold (XAU/USD) Price Action Ideas: Will News Trigger a Breakout or Consolidation on Gold?
      10. How to Step-by-Step Swing Trade Gold (XAU/USD) with Pure Technical Price Action Analysis?
      11. Gold XAU/USD Price Action Forecast: Anticipating a Consolidation Breakout on Gold Again?

      Swing Trading 101

      1. How to Step-by-Step Swing Trade Gold (XAU/USD) with Pure Technical Price Action Analysis?

      Learn how to trade crypto with price action strategy

      1. Bitcoin BTC/USD Price Action: Could Bitcoin Still Keep Dropping?

      Mastering traders mindset

      Your mindset is what separates steady growth from costly mistakes. Focus on these essentials:

      1. Trading Mindset: Why Trading Exposes Who you Really Are?
      2. Consistency in Trading is Key: Why Discipline Beats Intelligence?
      3. Overtrading: Why More Trades Do Not Mean More Profits?
      4. Trading Wick Outs: How to Handle Fake Outs and Market Losses?
      5. Trading Psychology: The Truth About Trading Success

      Beginner trading roadmap

      Not sure where to begin? Here’s a simple roadmap to guide you:

      1. Common beginner Traders Mistakes → avoid overtrading, revenge trading, and chasing the market.
      2. Master Traders Psychology → build discipline, patience, and emotional control
      3. Mastering Risk Management → learn how to have a sustainable trading.
      4. Master Simple Technical strategies & Indicators → especially price action, key levels, and market structure.
      5. Applying to Real Market → forex, crypto and indices.


      By building step by step; from basicsreal tradingmastering the craft, you’ll gain clarity, confidence, and steady progress without ever feeling overwhelmed.


      Follow me for more daily market insights!

      Ruffy Grant B. Capacio - LinkedIn


      Disclaimer:

      Trading forex and derivative instruments involves substantial risk and may not be suitable for all individuals. Only use funds that you are prepared to lose. It is important to understand how these markets work and the risks involved before trading, and to seek independent financial advice if needed. All market analysis and insights shared are intended for educational and informational purposes only and should not be considered financial or investment advice. June 16, 2026

      ACY Securities is one of Australia's fastest growing multi-asset online trading providers, offering ultra-low-cost trading, rock-solid execution, technologically superior account management and premium market analysis.

      This content may have been written by a third party. LiquidityFinder makes no representation or warranty and assumes no liability as to the accuracy or completeness of the information provided, nor any loss arising from any investment based on a recommendation, forecast or other information supplies by any third-party. This content is information only, and does not constitute financial, investment or other advice on which you can rely.
      Comments
      Most Recent
      Written By
      Daily Newsletter

      LF Daily News

      Daily industry focused newsletter giving you an overview for the financial & finTech industry.

      See All Newsletters
      By clicking "Sign Up" you are agreeing to our Terms of Service and Privacy Policy
      RSS Feeds

      Create a custom RSS Feed

      Select the categories and companies you wish to follow directly to your person rss feed.

      Create Custom RSS Feed

      Related Categories:

      Related Tags:

      #ProviderNews#TradingPlatform#FinTech#MarketNews

      Related Articles:

      Find The Right Partners for
      Your Trading Business

      Sign up and join over 5,000 professional members who receive personalized news alerts, curated professional connections, and more for free!

      Sign Up with LinkedIn
      Create Your FREE Account
      Get access to latest news, updates, real-time data, brokerage and trading firm insights and customized information feeds.

      Fluctuations in borrowing costs have a direct impact on both corporate profitability and broader economic activity.

      just now

      This week's German index outlook assessing cooling phase pertinent to industrial resilience.

      just now

      Currency technology provider Integral has expanded its longstanding partnership with global financial services firm StoneX Group to establish connectivity at the Equinix SG1 data facility in Singapore, strengthening StoneX's ability to serve clients across the Asia Pacific region.

      just now

      Want to know who controls the chart? Learn to read market trend structure using a simple price action strategy and never guess the next move again.

      just now

      The RBA held at 4.35% with a hawkish tilt, but the Aussie barely flinched — because the pen that writes AUD/USD's next move is being held in Washington, not Sydney

      just now

      US multi-asset clearing and brokerage firm Wedbush has cleared more than one billion prediction market contracts on a cumulative basis as of 31 May 2026

      just now

      A liquidity bridge is the technology that sits between your trading platform and your liquidity providers, handling all order routing and price streaming in real time. Without a correctly configured bridge, an A-book or hybrid broker cannot route client orders to the market, cannot manage hedging effectively, and cannot control execution quality. Despite being the most operationally critical piece of brokerage infrastructure after the trading platform itself, the liquidity bridge is also one of the least understood - particularly among brokers who inherited a setup without knowing exactly how it was built. This guide explains what a bridge does, how it works technically, and why its configuration directly determines the quality of execution your clients experience.

      just now

      Beeks Financial Cloud Group has secured three contracts worth almost $10 million for its Market Edge Intelligence® platform, signed with a Global Tier 1 Investment Bank, a global financial services institution and a US equities exchange, extending the platform's reach across capital markets.

      just now

      ATFX Cambodia has marked the first anniversary of its operations with the opening of a new branch office in Phnom Penh, attended by SERC's Director General. Chairman Seav Koaw Ing reflects on the milestone as the firm plans a new regulated financial service for the local market.

      just now

      Nuvei has agreed to acquire Payoneer for $7.40 per share in cash, valuing the deal at approximately $2.75 billion. The combination brings together Nuvei's payment acceptance capabilities with Payoneer's cross-border payouts, multi-currency accounts and global regulatory licences. The deal is expected to close in mid-2027.

      just now
      Feed