just now

Liquidity Finder Ltd is incorporated in England and Wales, company number 10610740, registered address 167-169 Great Portland Street, Fifth Floor, London W1W 5PF, United Kingdom.
Published: just now
The MACD, short for Moving Average Convergence Divergence, is one of the most popular trading indicators in the world. Yet, despite its fame, many traders misinterpret it, using it as a magic signal instead of a tool to confirm what the market is already telling them. In this first part of our MACD series, we’ll break down what it is, how it works, and why pairing it with price action understanding can give you a real edge. Even beginners can start seeing MACD as a lens to understand momentum, trend shifts, and potential reversal points - without overcomplicating their charts.
If you’re just starting out, it’s worth revisiting foundational lessons like Learn Trading From Scratch: Clean, Simple, Zero-Noise or Minimalist Trading Indicators: The Only Tools Beginners Need to see where MACD fits into the bigger picture.
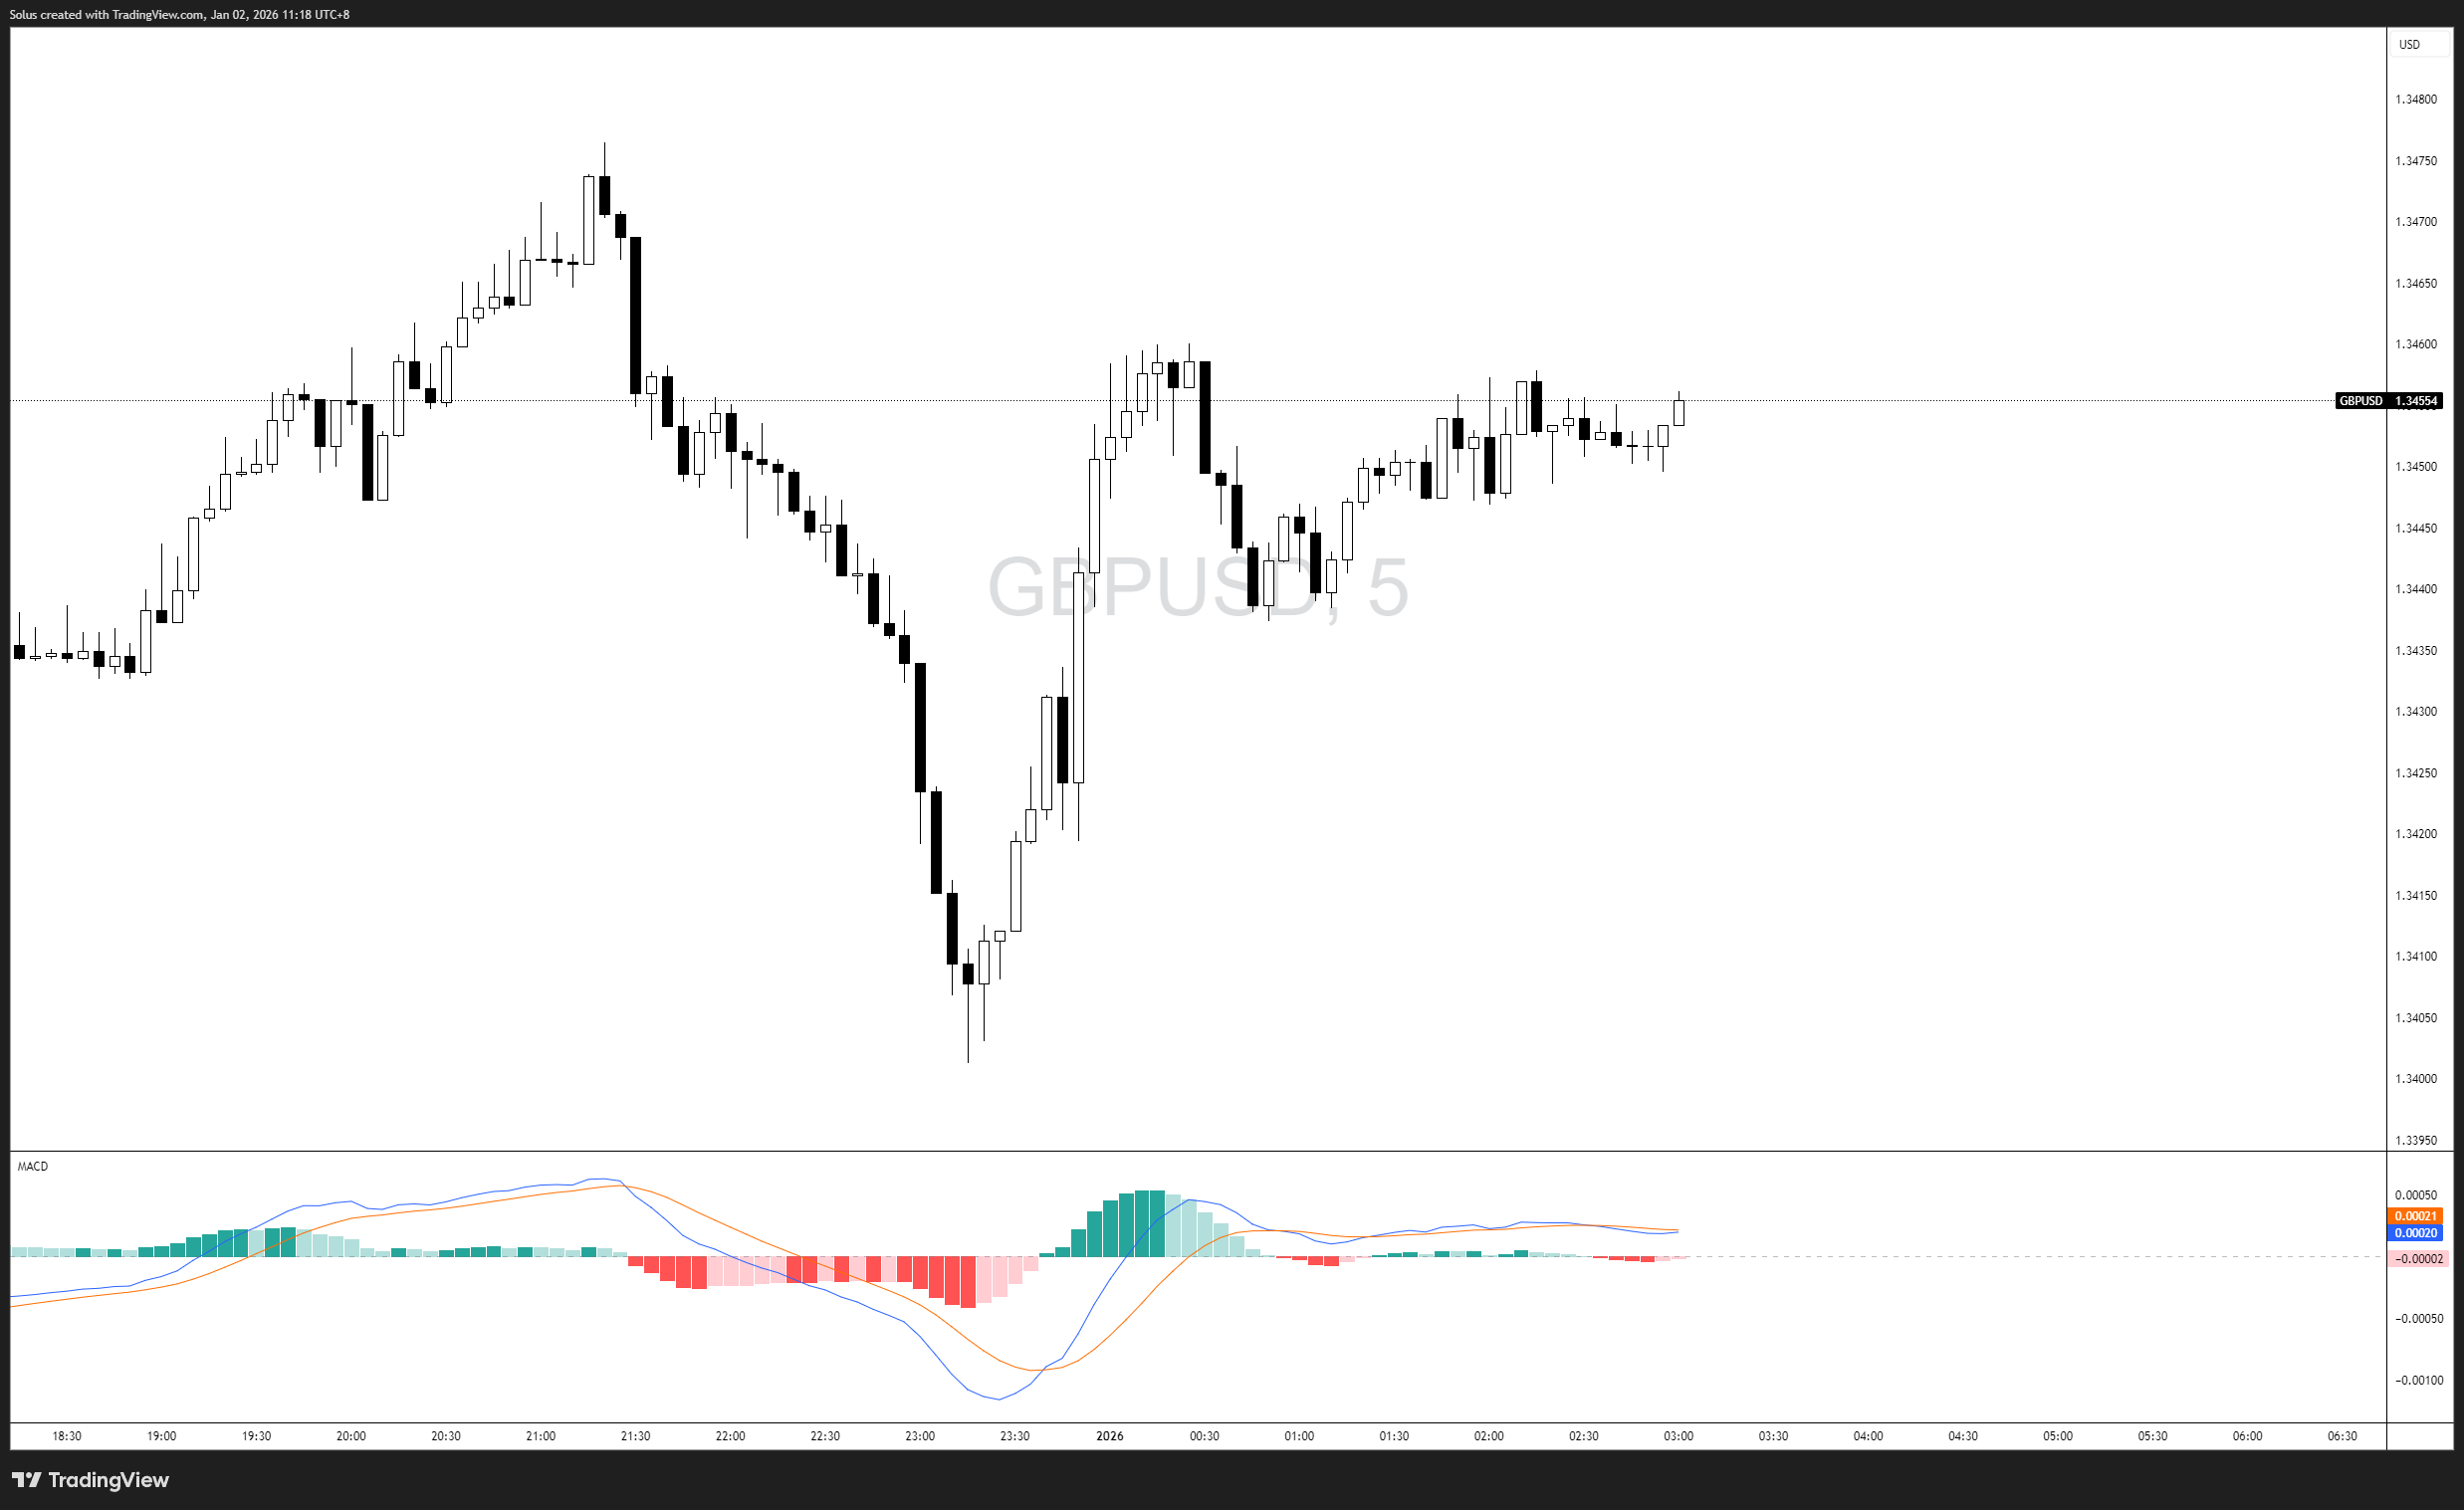
At its core, MACD is a momentum oscillator that compares two moving averages of price - typically the 12-period and 26-period exponential moving averages (EMAs). The difference between these EMAs is plotted as the MACD line, while a 9-period EMA of that difference forms the signal line.
Traders often look for:
But here’s the thing - MACD doesn’t predict the future. It simply reflects changes in momentum. Using it blindly without understanding price structure is a recipe for getting stopped out or chasing fake signals. Beginners should pair MACD with tools like Master Candlestick Entries: Reading Price Action at Key Levels or a simple Daily Trading Routine: Build Consistency and Discipline Fast to avoid common pitfalls.
Think of MACD like a speedometer in your car. It doesn’t tell you the road ahead will curve or if there’s a stop sign - it simply shows how fast you’re going. You can choose to accelerate, brake, or coast depending on what the road ahead looks like. Similarly, MACD shows momentum but leaves the decision-making to your eyes and strategy. A skilled trader never relies solely on MACD; they watch the market “road” closely, identifying key levels, liquidity zones, and structure shifts.
Many beginners make the mistake of treating MACD like a buy/sell button. Common errors include:
Entering trades just on crossovers without considering overall trend.
Ignoring divergence signals that warn momentum is fading.
Overcomplicating charts with multiple oscillators, creating analysis paralysis.
This is why pairing MACD with How to Think Like a Price Action Trader and Trading Risk Management: The Real Edge Behind Consistency is essential. MACD works best as a confirmation tool, not a primary entry trigger.
This week, practice observing MACD without trading. Open a demo account or chart, and for each crossover or divergence you notice, ask yourself:
Is the trend confirmed by price action?
Does the signal align with higher timeframes?
Am I being tempted to trade impulsively?
Document your observations in a trading journal, using lessons from Trading Journal & Reflection - The Trader’s Mirror. This exercise alone will improve your discipline, patience, and understanding of MACD more than jumping straight into trades.
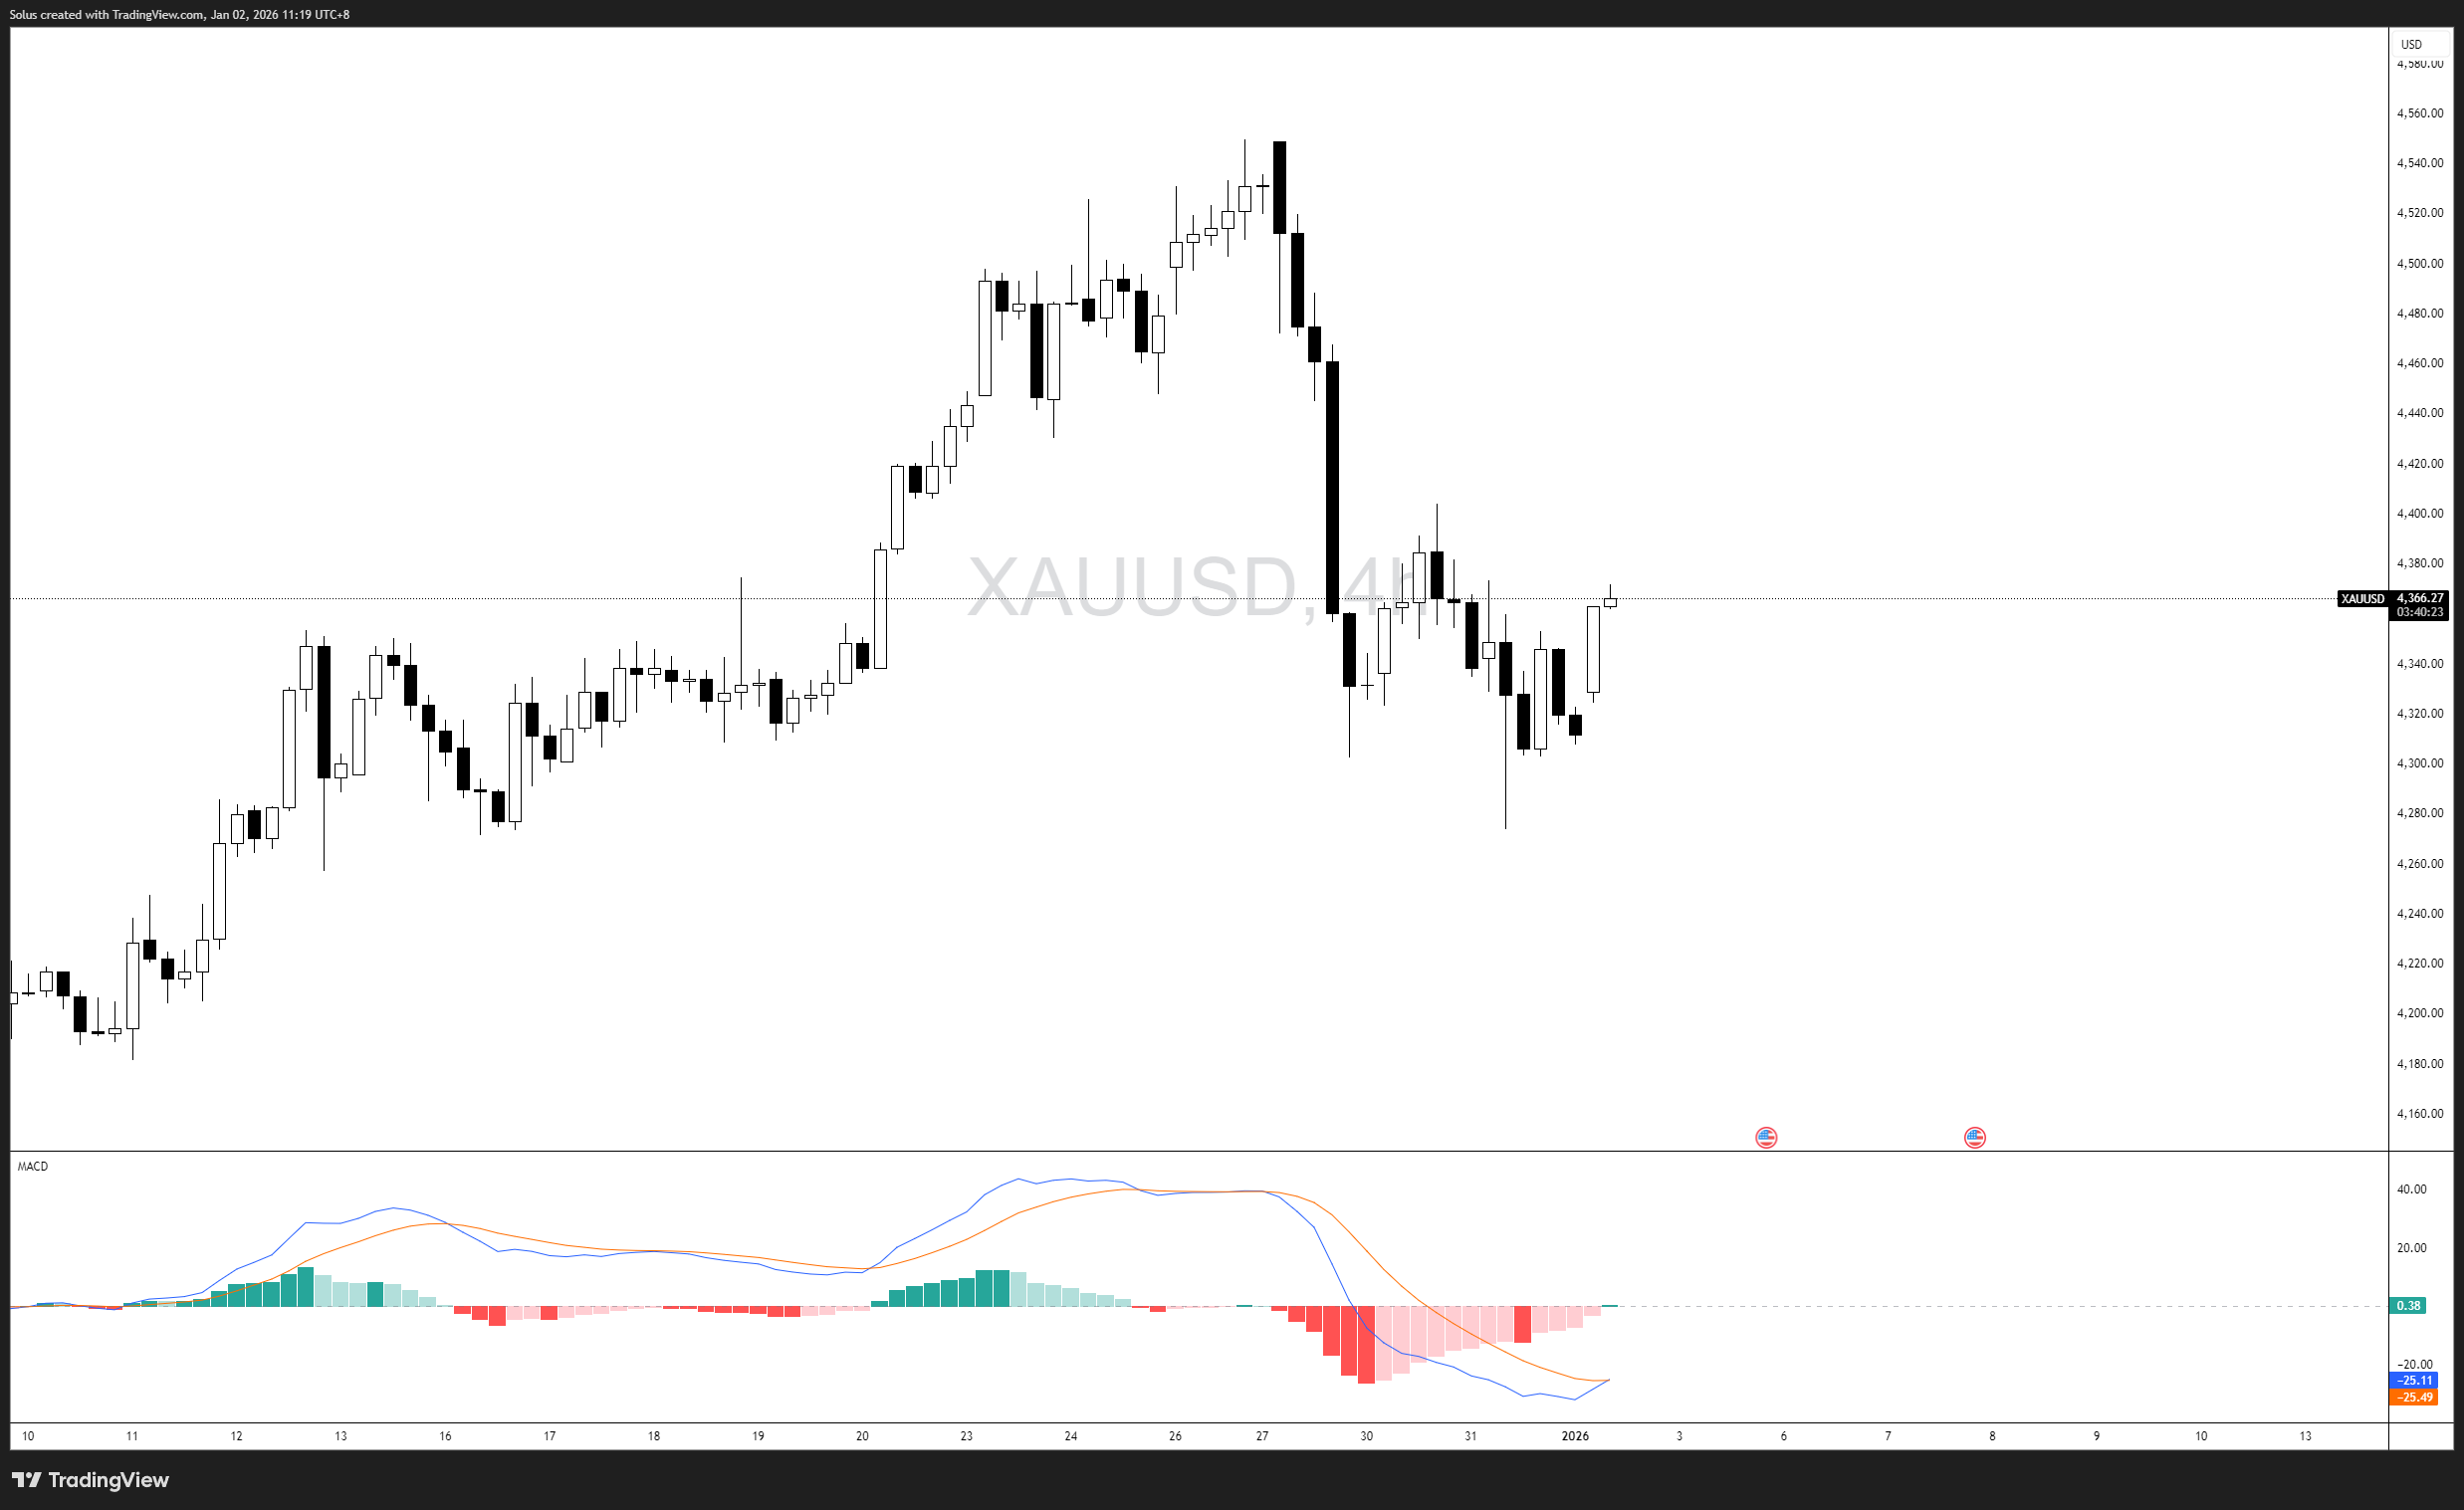
MACD works across timeframes, but beginners often find it easiest on 4H and daily charts. Shorter timeframes like 1M or 5M produce more noise and false signals. For intraday confirmation, combine MACD with Multi-Timeframe Analysis.
No. MACD should always be used as a confirmation tool, not the main signal. Pair it with price structure, key levels, and risk management to avoid premature entries.
Divergence highlights weakening momentum even when price continues in a trend. Recognizing divergence early helps avoid getting trapped in reversals or stop-hunt scenarios, similar to lessons from Stop Hunting 101.
MACD excels at identifying trend strength and potential reversals through divergence. It’s not predictive alone, but when combined with price action and risk controls, it can signal high-probability trades.
The MACD is a powerful, yet misunderstood tool. It tells you about momentum, trend, and potential reversal signals, but it does not replace the disciplined trader’s eyes, mind, or risk management. Part 1 of this series is all about observation, patience, and context.
Next in the series, we’ll explore MACD divergence in detail, showing you how to spot real turning points and avoid the traps that catch most beginners off guard.
ACY Securities is one of Australia's fastest growing multi-asset online trading providers, offering ultra-low-cost trading, rock-solid execution, technologically superior account management and premium market analysis.
Select the categories and companies you wish to follow directly to your person rss feed.
Create Custom RSS FeedSign up and join over 5,000 professional members who receive personalized news alerts, curated professional connections, and more for free!
Retail futures trading leader NinjaTrader Group has appointed Mark Omens as Senior Vice President, Commercial Strategy, bringing a 25-year veteran of derivatives marketplace CME Group into a newly created role focused on exchange partnerships and enterprise growth.
Gold Price Action Forecast: Will XAU/USD Drop to $3930? Meta Description: Read our Gold price action forecast to see if XAU/USD will drop to $3930.
BitDelta Securities Financial Services LLC (“BitDelta Securities”) today announced that it has received full regulatory approval from the Capital Market Authority (“CMA”) of the United Arab Emirates under the Category 5 — Arrangement and Advice license framework (License No. 20200000439). The approval follows the firm's receipt of In-Principal Approval earlier this year and represents the successful conclusion of the CMA's full licensing process, including the satisfaction of capital requirements, governance appointments, and operational setup.
Crypto.com has received a $400 million strategic investment from Citadel Securities, valuing the firm at $20 billion. It marks the first institutional funding round in the company's history, aimed at accelerating its expansion into tokenised securities, derivatives and other asset classes.
WTI’s pullback into $79–82 is the first major test of the bullish Elliott Wave count, with buyers targeting a renewed break above $85.

BitDelta Securities has secured a full CMA Category 5 licence in the UAE and opened a regulated office in Business Bay, Dubai. The firm operates as an introducing broker, connecting investors with licensed international brokers across multiple asset classes, with CEO Dr. Demetrios Zamboglou commenting on the milestone.
Index volatility is asleep while single stocks fight it out underneath, credit refuses to confirm the equity rally, and a bare macro calendar hands next week to oil.
Digital assets and FX brokerage GC Exchange FZE (GCEX) has appointed Mohammed A. Mulla as a Board Member of its Dubai-based entity, part of the wider GCEX Group.
Learn what Blockchain-as-a-Service is, how it works, and why businesses are using BaaS to build blockchain applications without managing infrastructure.
CFDs vs stocks compared on leverage, ownership, costs, dividends, taxes, and risk. Learn the differences between stocks and CFDs and discover which suits your investing or trading goals.