just now

Liquidity Finder Ltd is incorporated in England and Wales, company number 10610740, registered address 167-169 Great Portland Street, Fifth Floor, London W1W 5PF, United Kingdom.
Published: just now

The Nasdaq 100 is currently the driving force of bullish price moves across the S&P 500, Dow Jones, and Bitcoin — with Nvidia being at the helm of the driver’s seat. And today, Nvidia will be releasing their earnings report, expected to show a 66% year-on-year revenue jump; a print that could either fuel a fresh leg higher or mark the peak of an overextended rally.
So all eyes are on Nvidia today, and until the report is released, the price could stall.
Nvidia’s daily chart has been clean. Since bottoming at $86.62 in April, the price has been respecting a rising parallel channel, making higher highs and higher lows.
From an Elliot Wave structure perspective, this recent leg up could be Wave 3 of a 5-wave impulse, and if that's true, we're now sitting at a potential pause inside a tight $129.16–$137.40 range.
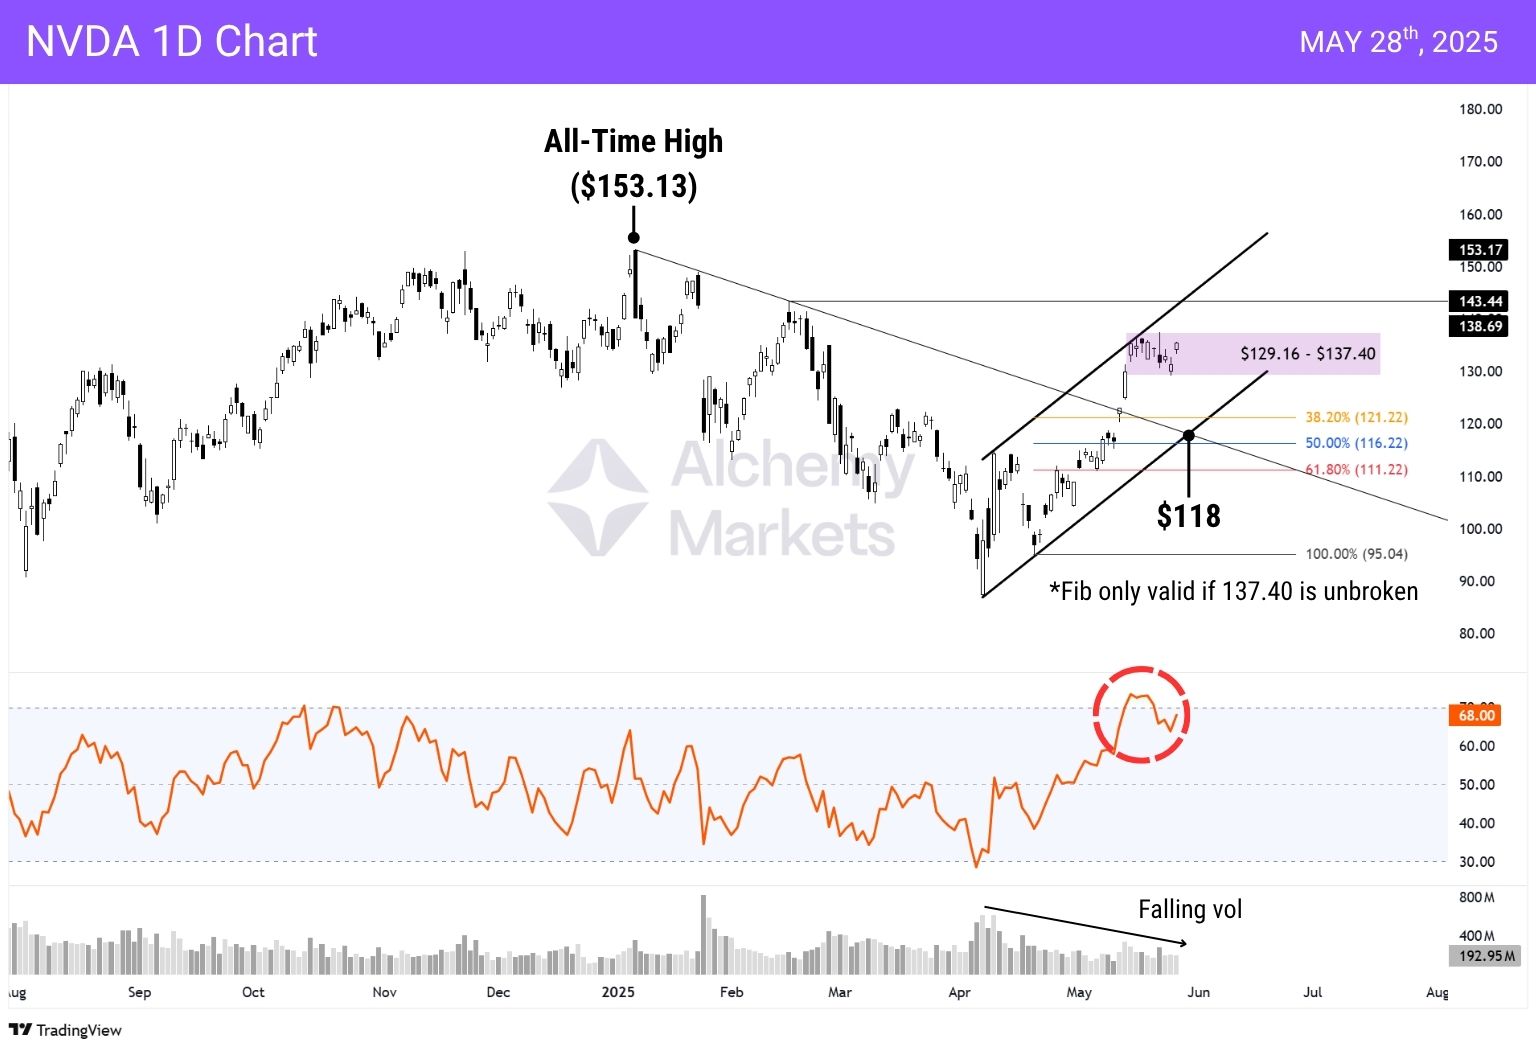
A break above this range would signal that Wave 3 isn’t over, and we could tap into $143.44, the previous high and upper trendline of the rising parallel channel. It would also invalidate the current Fib retracement and call for a redraw.
A break below this range would signal the likely formation of a wave 4 retracement, back down towards:
Anything deeper than that, and we’re no longer talking Wave 4 — we’re likely seeing a broader structure breakdown.
Let’s not get ahead of ourselves. Despite the bullish trend, a few caution lights are flashing.
🔸 RSI divergence has crept in — price is rising, but RSI isn’t confirming the same strength (see red circle on chart).
🔸 Volume has been falling, even during the recent Wave 3 impulse — a red flag for trend sustainability.
🔸 $137.40 is acting as a cap — and without volume or earnings momentum, a clean breakout may not come easily.
If earnings disappoint or even slightly underwhelm, we could see a retracement. The most critical level to watch is $118.
Why? Because it sits at the cross-section of three key elements:
If price pulls back into $118 and holds, that’s your structural support and potential long setup. If it breaks, 61.8% ($111.22) becomes the key level, but would serve as a warning signal.
The earnings print today will act as the catalyst for a rise or fall on Nvidia.
A beat with strong guidance likely sends NVDA through $137.40, indicating bullish continuation. This would call for a redraw of the Fibonacci retracements, starting at $95.20 and ending at whatever high Nvidia punches in.
Alternatively, if the year-on-year revenue falls short of expectations (66% gain), or the guidance is underwhelming, expect a retest of the lower channel and a move toward $118.
Bottom line: NVDA is the ignition switch. Whether markets accelerate or stall out depends on how strong this earnings engine fires.
You may also be interested in:
Gold’s Gleaming Glide or Grinding Gloom? [Gold Elliott Wave]
DISCLAIMER: For educational purposes only. Trading comes with substantial risk, leading to possible loss of your capital. Traders are advised to do their own due diligence before investing.
Alchemy Markets is a multi-asset brokerage providing retail traders with the same elite trading conditions, tools, and transparency typically reserved for institutions.
Select the categories and companies you wish to follow directly to your person rss feed.
Create Custom RSS FeedSign up and join over 5,000 professional members who receive personalized news alerts, curated professional connections, and more for free!
Retail futures trading leader NinjaTrader Group has appointed Mark Omens as Senior Vice President, Commercial Strategy, bringing a 25-year veteran of derivatives marketplace CME Group into a newly created role focused on exchange partnerships and enterprise growth.
Gold Price Action Forecast: Will XAU/USD Drop to $3930? Meta Description: Read our Gold price action forecast to see if XAU/USD will drop to $3930.
BitDelta Securities Financial Services LLC (“BitDelta Securities”) today announced that it has received full regulatory approval from the Capital Market Authority (“CMA”) of the United Arab Emirates under the Category 5 — Arrangement and Advice license framework (License No. 20200000439). The approval follows the firm's receipt of In-Principal Approval earlier this year and represents the successful conclusion of the CMA's full licensing process, including the satisfaction of capital requirements, governance appointments, and operational setup.
Crypto.com has received a $400 million strategic investment from Citadel Securities, valuing the firm at $20 billion. It marks the first institutional funding round in the company's history, aimed at accelerating its expansion into tokenised securities, derivatives and other asset classes.
WTI’s pullback into $79–82 is the first major test of the bullish Elliott Wave count, with buyers targeting a renewed break above $85.

BitDelta Securities has secured a full CMA Category 5 licence in the UAE and opened a regulated office in Business Bay, Dubai. The firm operates as an introducing broker, connecting investors with licensed international brokers across multiple asset classes, with CEO Dr. Demetrios Zamboglou commenting on the milestone.
Index volatility is asleep while single stocks fight it out underneath, credit refuses to confirm the equity rally, and a bare macro calendar hands next week to oil.
Digital assets and FX brokerage GC Exchange FZE (GCEX) has appointed Mohammed A. Mulla as a Board Member of its Dubai-based entity, part of the wider GCEX Group.
Learn what Blockchain-as-a-Service is, how it works, and why businesses are using BaaS to build blockchain applications without managing infrastructure.
CFDs vs stocks compared on leverage, ownership, costs, dividends, taxes, and risk. Learn the differences between stocks and CFDs and discover which suits your investing or trading goals.


