just now


Liquidity Finder Ltd is incorporated in England and Wales, company number 10610740, registered address 167-169 Great Portland Street, Fifth Floor, London W1W 5PF, United Kingdom.
Published: just now

Both the Nasdaq and S&P 500 have pushed into major technical resistance, trading right up into their daily 200 EMAs.
For the S&P, that level sits near 5,640. After a strong rebound off the 5,450–5,520 zone, price has paused, and this is where the rally needs to prove it has legs.
For the Nasdaq, price is also pressing into its daily 200 EMA after reclaiming key support from late April. The tech-heavy index has led the bounce, but like the S&P, it's now running into a supply shelf where sellers have stepped in before.
The S5TH indicator, which tracks the percentage of S&P stocks trading above their 200-day moving average, is still sitting under 50. That tells us less than half the index is participating in the move.
Yes, it’s recovering, and the momentum is better, but structurally it’s still weak.
If bulls can punch through this 200 EMA and hold, the next upside target comes in around 5,770 to 5,790. That’s the next real area of overhead supply.
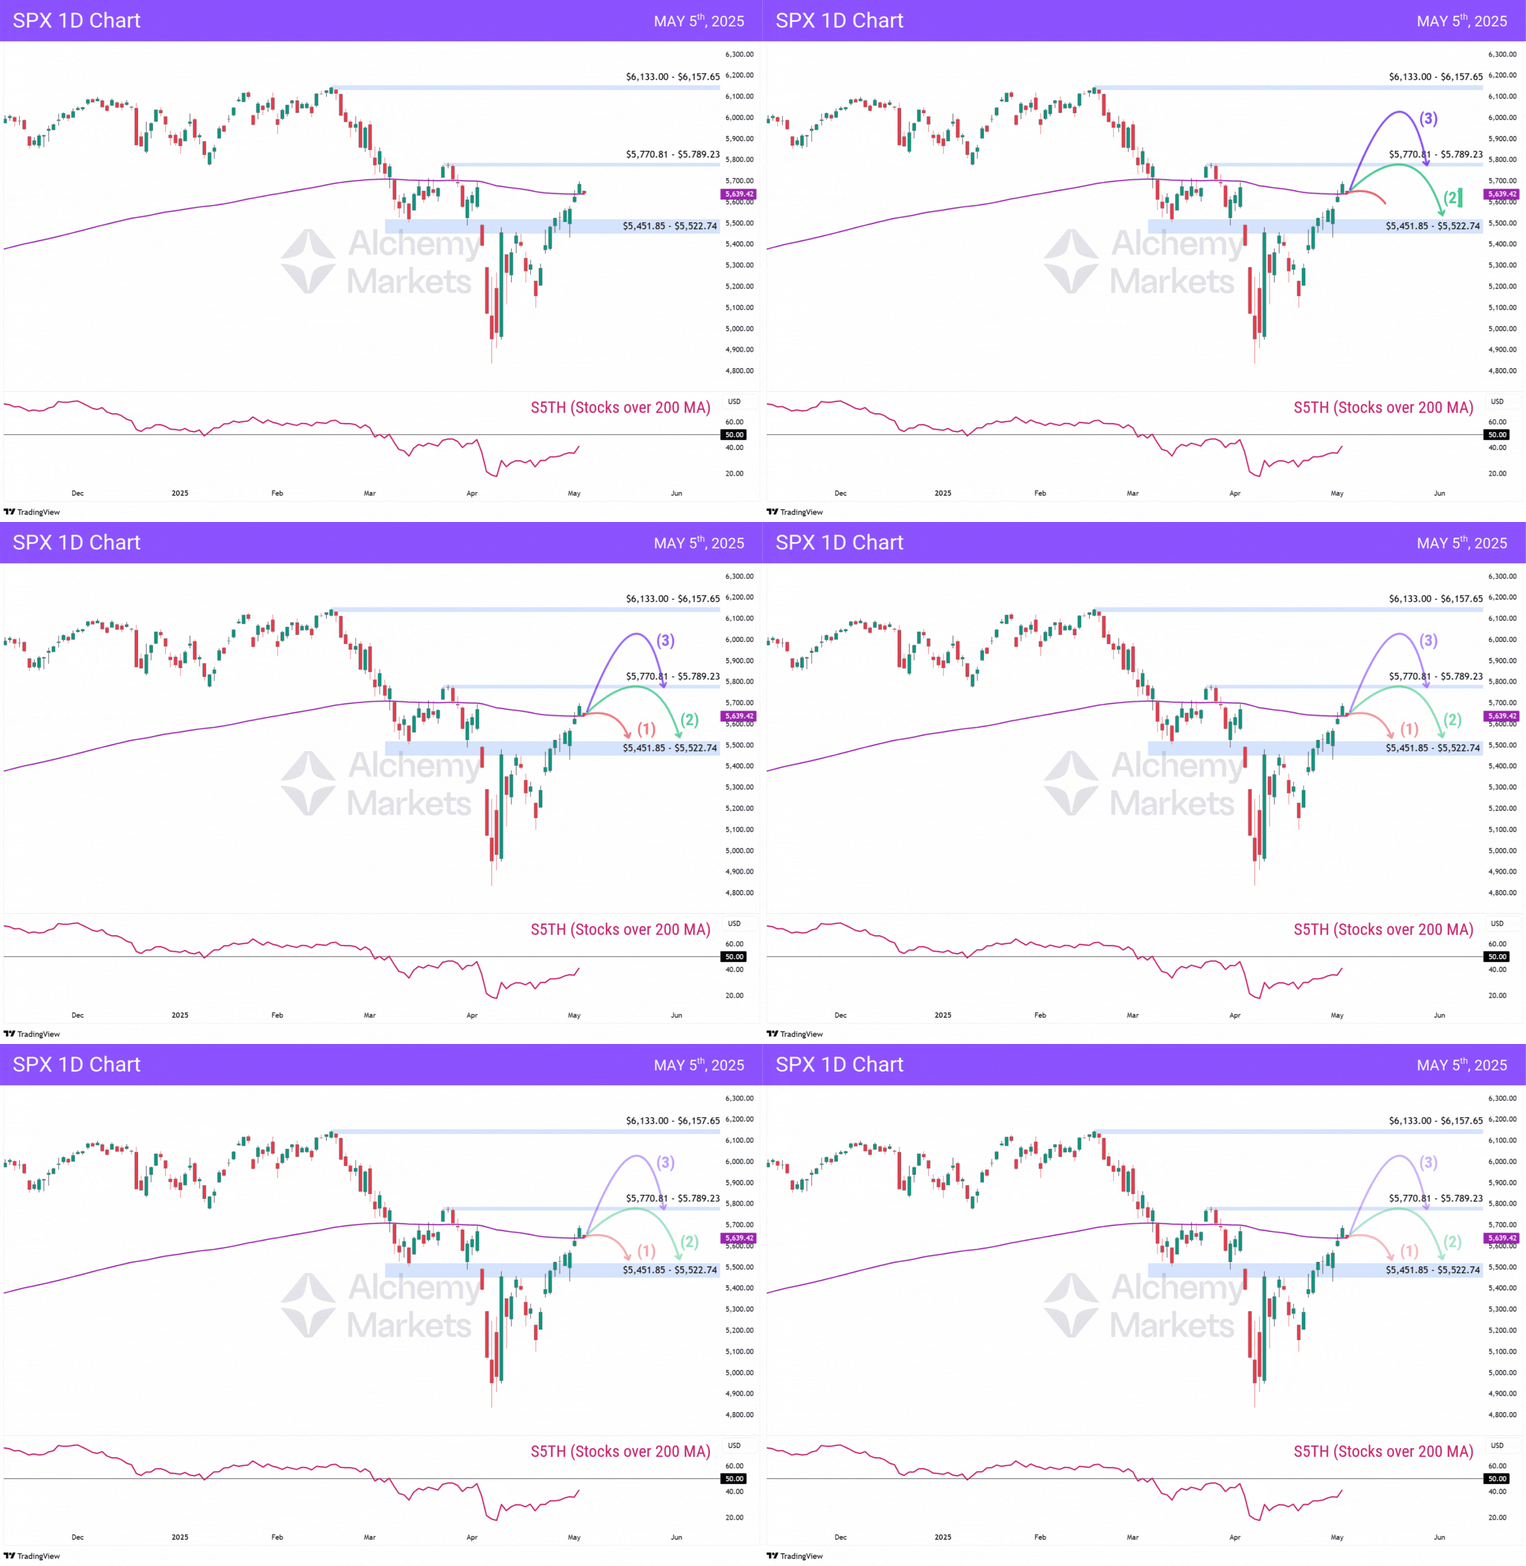
Three Scenarios to Watch:
Bearish Case:
If we drop below (1), it’s either a bear trap or we’re setting up for a retest of the ~5,000 lows.
The Nasdaq 100 has been leading the bounce, but now it's tagging the 200 EMA and pausing just beneath key resistance at 20,347–20,775. This is the same technical battleground where momentum broke down in March. Price has surged off the April lows near 17,600, but this is the first real test of trend durability.
Unlike the S&P, the Nasdaq has less of a breadth problem — but it still faces the same structural question. Is this a reset or a real trend resumption?
If bulls absorb this supply zone, the next upside target lands around 22,165–22,281. But a stall here opens the door for a healthy pullback or a more aggressive unwind.
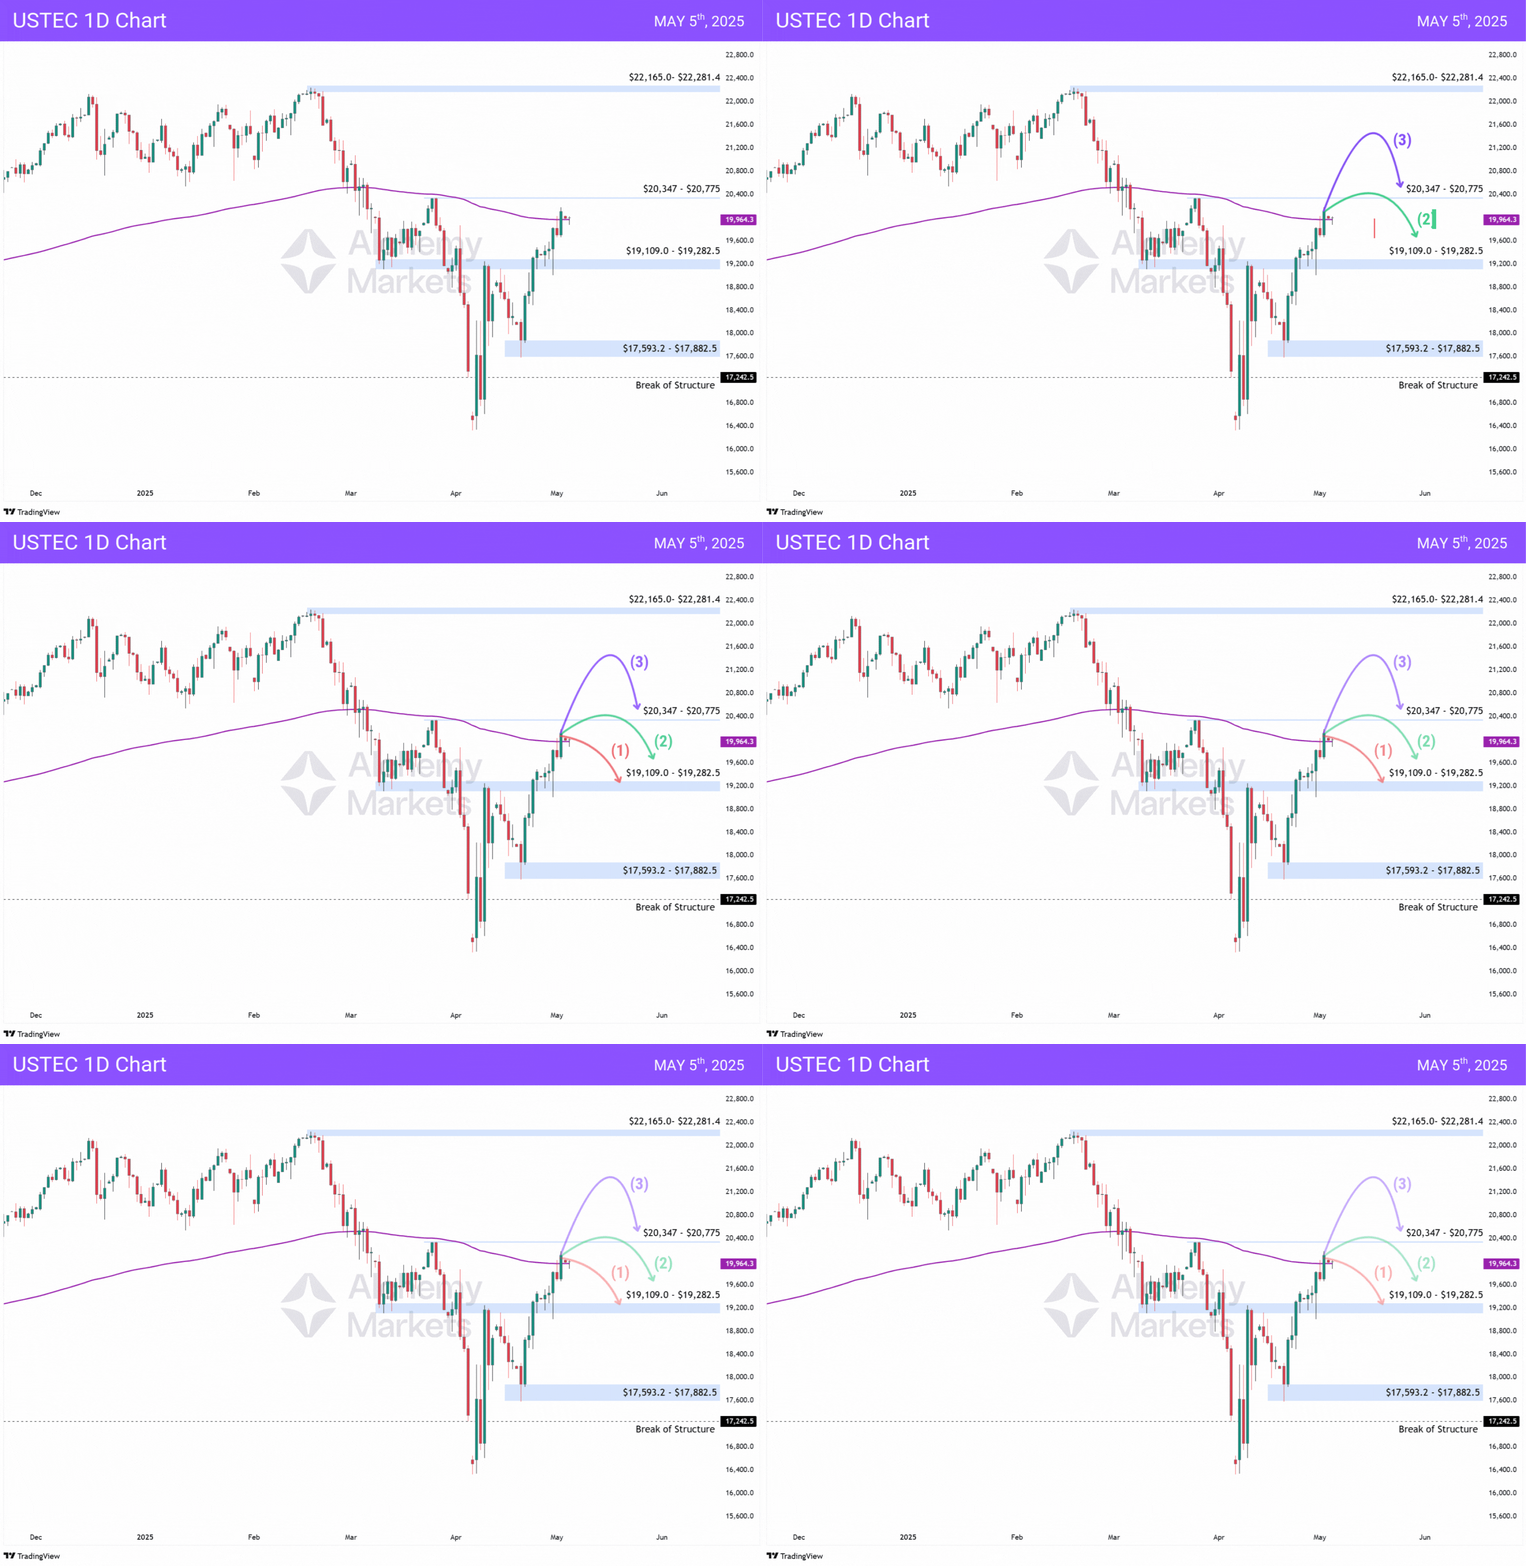
Three Scenarios to Watch:
Bearish Case:
If we drop below 19,100, the risk grows for a deeper flush toward the 17,600–17,800 base — or worse, a full retrace to the 17,200 break.
Strong bounce, but still narrow. Both the S&P and Nasdaq are now pressing into their 200 EMAs — a clear decision point.
The three key scenarios on deck: rejection at the moving average, a slow grind into overhead resistance, or a clean bullish breakout that flips resistance into support.
The next move will show whether this rally is ready to broaden — or just running on fumes.
You may also be interested in:
SPX Rally Eyes Resistance as Fed & ISM Data Loom, GBP/USD Tests Key Reversal Zone
Disclaimer: Trading leveraged products carries a high level of risk and may result in losses exceeding your initial investment; ensure you fully understand the risks involved.
Alchemy Markets is a multi-asset brokerage providing retail traders with the same elite trading conditions, tools, and transparency typically reserved for institutions.

Select the categories and companies you wish to follow directly to your person rss feed.
Create Custom RSS FeedSign up and join over 5,000 professional members who receive personalized news alerts, curated professional connections, and more for free!
During Forex Expo Dubai 2026, Adnan Khan, CEO of 4XPORTAL, met with Sam Low, the founder of Liquidity Finder.
ATARIA CRM is a centralized platform designed for fintech teams to manage account operations, verification, fund management, and support in one place. With desktop and mobile access, it helps businesses stay connected, organized, and efficient.
EUR/AUD hits the 1.60500 target after rejecting 1.61715–1.62300 resistance. Review the bearish price action setup and why trade confirmation mattered.
Get an inside look at how rising Treasury yields and sector shifts into healthcare are impacting S&P 500 market dynamics, technical levels, and key economic drivers.
Understand XAUUSD support and resistance with simple gold chart examples. Learn to identify key zones, assess price reactions, and avoid beginner mistakes.
CMC Markets, a FTSE 250 multi-asset financial services firm, has launched a read-only ChatGPT integration for UK CFD clients, giving access to balances, positions, orders, pricing and historical market data through conversational prompts, as part of its ongoing investment in AI and cloud technology.
DXtrade, the multi-asset trading platform from Devexperts, has integrated Notofin's trading performance intelligence solution, adding behaviour-first analysis, structured journaling and pattern recognition tools. Brokers licensing DXtrade can now offer Notofin's services to clients as part of the platform's open integration framework.
KYC is essential for building trust, preventing fraud, and meeting regulatory requirements. A centralized system like ATARIA CRM helps compliance teams manage KYC requests, track pending documents, monitor approvals and rejections, and keep the entire verification process organized. By quickly identifying pending issues, businesses can reduce delays and provide customers with a smoother path from “Pending” to “Approved.”
Build better trading habits with a trading journal. Learn how a trading memory bank helps you review mistakes, manage emotions, and develop confidence.
GBP/USD has fallen to 3-month lows near 1.3200 due to strong US economic data and weakening UK consumer demand, though technical indicators like an RSI of 25.18 suggest the pair is now in oversold territory near key support at 1.3150.