just now

Liquidity Finder Ltd is incorporated in England and Wales, company number 10610740, registered address 167-169 Great Portland Street, Fifth Floor, London W1W 5PF, United Kingdom.
Published: just now
At first glance, it does look like Bitcoin might be forming a low here. Price has been sitting around the same area for a while, which naturally pulls people into bottom-calling.
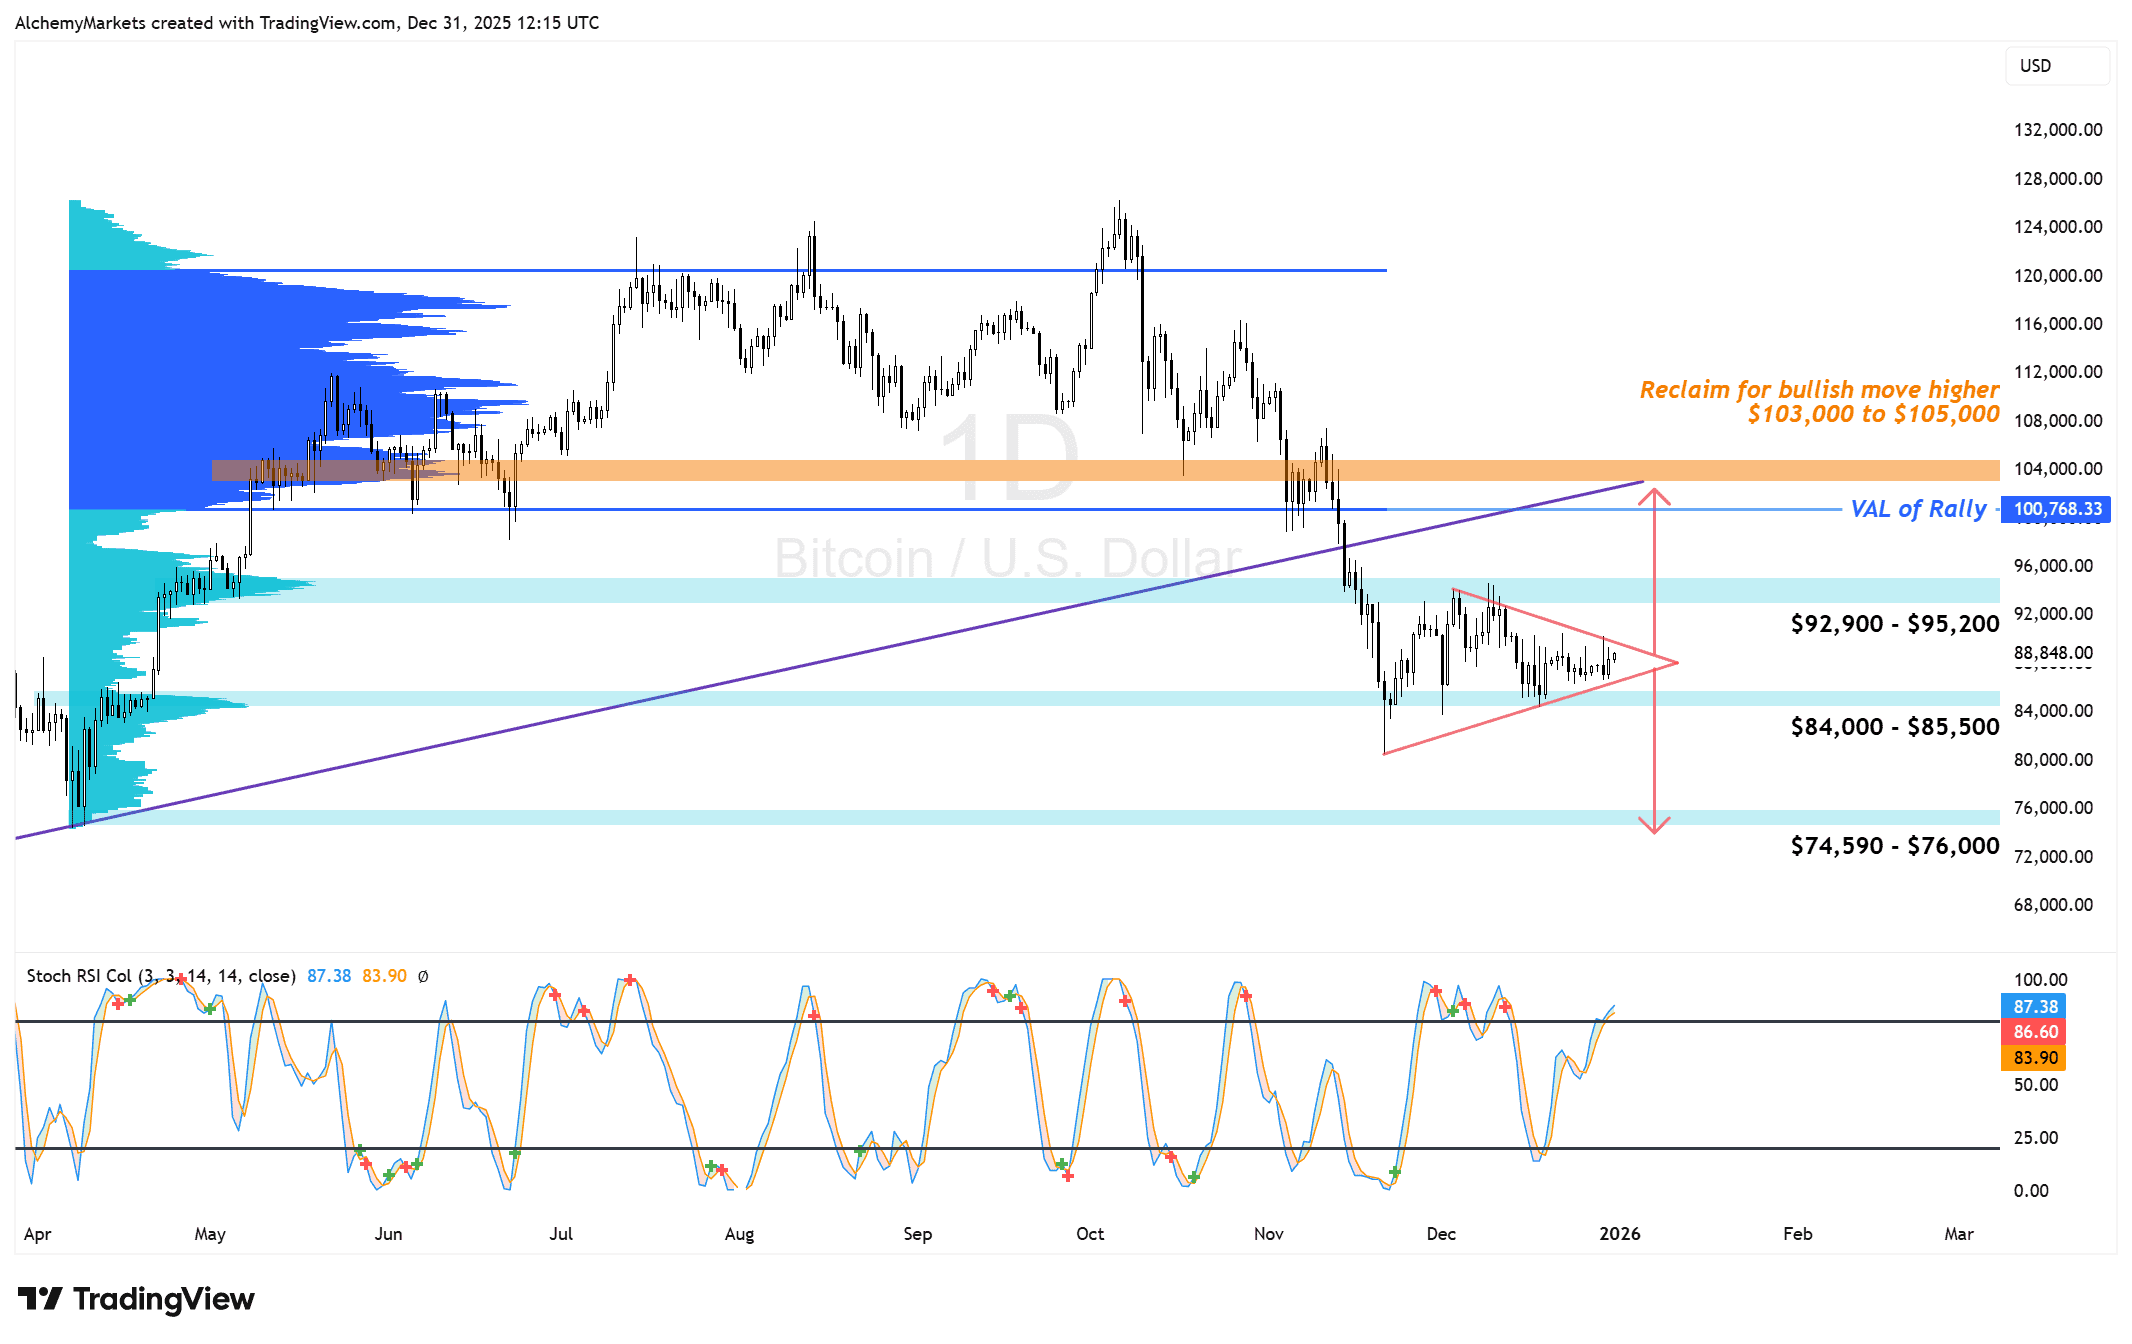
But if we take a step back and actually try to identify a pattern, the closest thing on the daily chart is a symmetrical triangle.
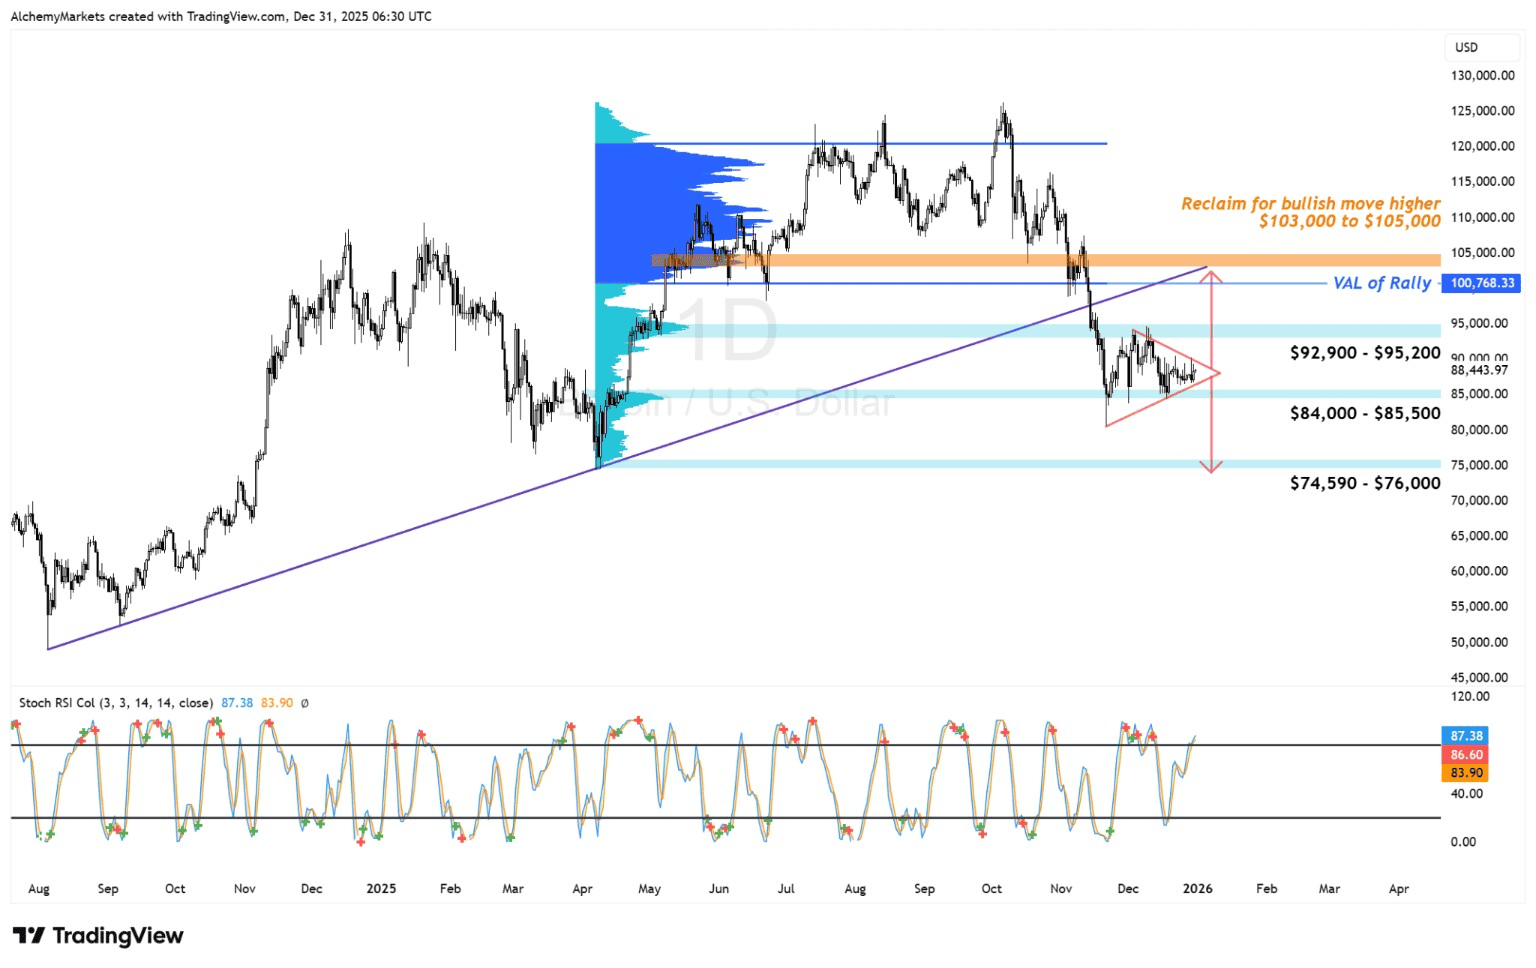
Yes, one of the wicks pushed higher than the rest. And if you drew this strictly wick to wick, you could argue it leans slightly directional. But looking at the most recent candles, and especially the last two rejections, it behaves much more like a symmetrical triangle than a clean trend continuation.
A symmetrical triangle is price compressing. It’s the market getting ready for a move, not making one yet.
This structure formed after a strong move down from the October 2025 high. That context matters. These patterns tend to resolve in the direction of the original impulsive move more often than not.
Some traders might interpret this as a bear pennant instead. That’s fair. The message is the same either way. Compression is happening, and what matters next is the expansion.
If Bitcoin pushes higher from here, the first area that really matters is $103,000 to $105,000.
This zone is marked by a large high-volume node from the Fixed Range Volume Profile (measuring volume during the April Rally) and the macro trendline. It’s also where prior support flipped into resistance.
If price can break into this area and actually hold above it, that would be meaningful. That’s where the case for the low being in starts to build.
If price moves into this zone and gets rejected again, then nothing has really changed. It simply reinforces this area as resistance and keeps the prevailing trend intact.
If the triangle resolves to the downside, the measured move points toward the mid-$70Ks, roughly $75,000.
This level stands out mainly because it marks a prior low and sits near a psychological round number. When price moves into thinly traded zones like this, reactions tend to be sharper, with moves often stalling, bouncing, or consolidating as liquidity gets tested.
That doesn’t mean $75K has to be the bottom. It just means it’s a level where some form of response becomes more likely if price gets there.
Bitcoin is still coiled inside this symmetrical triangle, and it formed after a strong move down.
If price breaks higher and holds above $103K to $105K, the upside case improves and the low may already be in. If it gets rejected there, that zone remains a ceiling.
If the structure breaks lower, $75K lines up with the triangle’s measured move and prior structural support. That’s where reactions become more probable.
There are also projections calling for much deeper downside, even toward $50K. For now, though, these are the zones that matter structurally.
Once Bitcoin breaks out of this triangle, the move toward one of these areas becomes much more likely. This isn’t about predicting the outcome. It’s about understanding why these levels matter when price gets there.
DISCLAIMER: For educational purposes only. Trading comes with substantial risk, leading to possible loss of your capital. Traders are advised to do their own due diligence before investing.
You may also be interested in:
Gold-to-Silver Ratio: Why It’s Falling — and What Could Come Next
Alchemy Markets is a multi-asset brokerage providing retail traders with the same elite trading conditions, tools, and transparency typically reserved for institutions.
Select the categories and companies you wish to follow directly to your person rss feed.
Create Custom RSS FeedSign up and join over 5,000 professional members who receive personalized news alerts, curated professional connections, and more for free!
Retail futures trading leader NinjaTrader Group has appointed Mark Omens as Senior Vice President, Commercial Strategy, bringing a 25-year veteran of derivatives marketplace CME Group into a newly created role focused on exchange partnerships and enterprise growth.
Gold Price Action Forecast: Will XAU/USD Drop to $3930? Meta Description: Read our Gold price action forecast to see if XAU/USD will drop to $3930.
BitDelta Securities Financial Services LLC (“BitDelta Securities”) today announced that it has received full regulatory approval from the Capital Market Authority (“CMA”) of the United Arab Emirates under the Category 5 — Arrangement and Advice license framework (License No. 20200000439). The approval follows the firm's receipt of In-Principal Approval earlier this year and represents the successful conclusion of the CMA's full licensing process, including the satisfaction of capital requirements, governance appointments, and operational setup.
Crypto.com has received a $400 million strategic investment from Citadel Securities, valuing the firm at $20 billion. It marks the first institutional funding round in the company's history, aimed at accelerating its expansion into tokenised securities, derivatives and other asset classes.
WTI’s pullback into $79–82 is the first major test of the bullish Elliott Wave count, with buyers targeting a renewed break above $85.

BitDelta Securities has secured a full CMA Category 5 licence in the UAE and opened a regulated office in Business Bay, Dubai. The firm operates as an introducing broker, connecting investors with licensed international brokers across multiple asset classes, with CEO Dr. Demetrios Zamboglou commenting on the milestone.
Index volatility is asleep while single stocks fight it out underneath, credit refuses to confirm the equity rally, and a bare macro calendar hands next week to oil.
Digital assets and FX brokerage GC Exchange FZE (GCEX) has appointed Mohammed A. Mulla as a Board Member of its Dubai-based entity, part of the wider GCEX Group.
Learn what Blockchain-as-a-Service is, how it works, and why businesses are using BaaS to build blockchain applications without managing infrastructure.
CFDs vs stocks compared on leverage, ownership, costs, dividends, taxes, and risk. Learn the differences between stocks and CFDs and discover which suits your investing or trading goals.