just now

Liquidity Finder Ltd is incorporated in England and Wales, company number 10610740, registered address 167-169 Great Portland Street, Fifth Floor, London W1W 5PF, United Kingdom.
Published: just now
Once you’ve logged the basics in your Trading Journal - such as sessions, setups, MAE/MFE, emotions, and R results - you begin seeing patterns most traders never catch. This alone puts you ahead of the majority.
But to operate at a professional level, you must go far beyond simple stats like win rate. In fact, win rate is one of the most overrated metrics in trading. It’s a comforting number, but a misleading one.
If you’re serious about consistency, you must learn the deeper metrics that actually define your edge:
These metrics transform your Trading Journal from a notebook into a performance engine - something you’ve already begun building through lessons like Backtesting for Traders, Trading Psychology: Controlling Yourself, and Risk Management: The Real Edge Behind Consistency.
Let’s break down the metrics professionals actually care about.
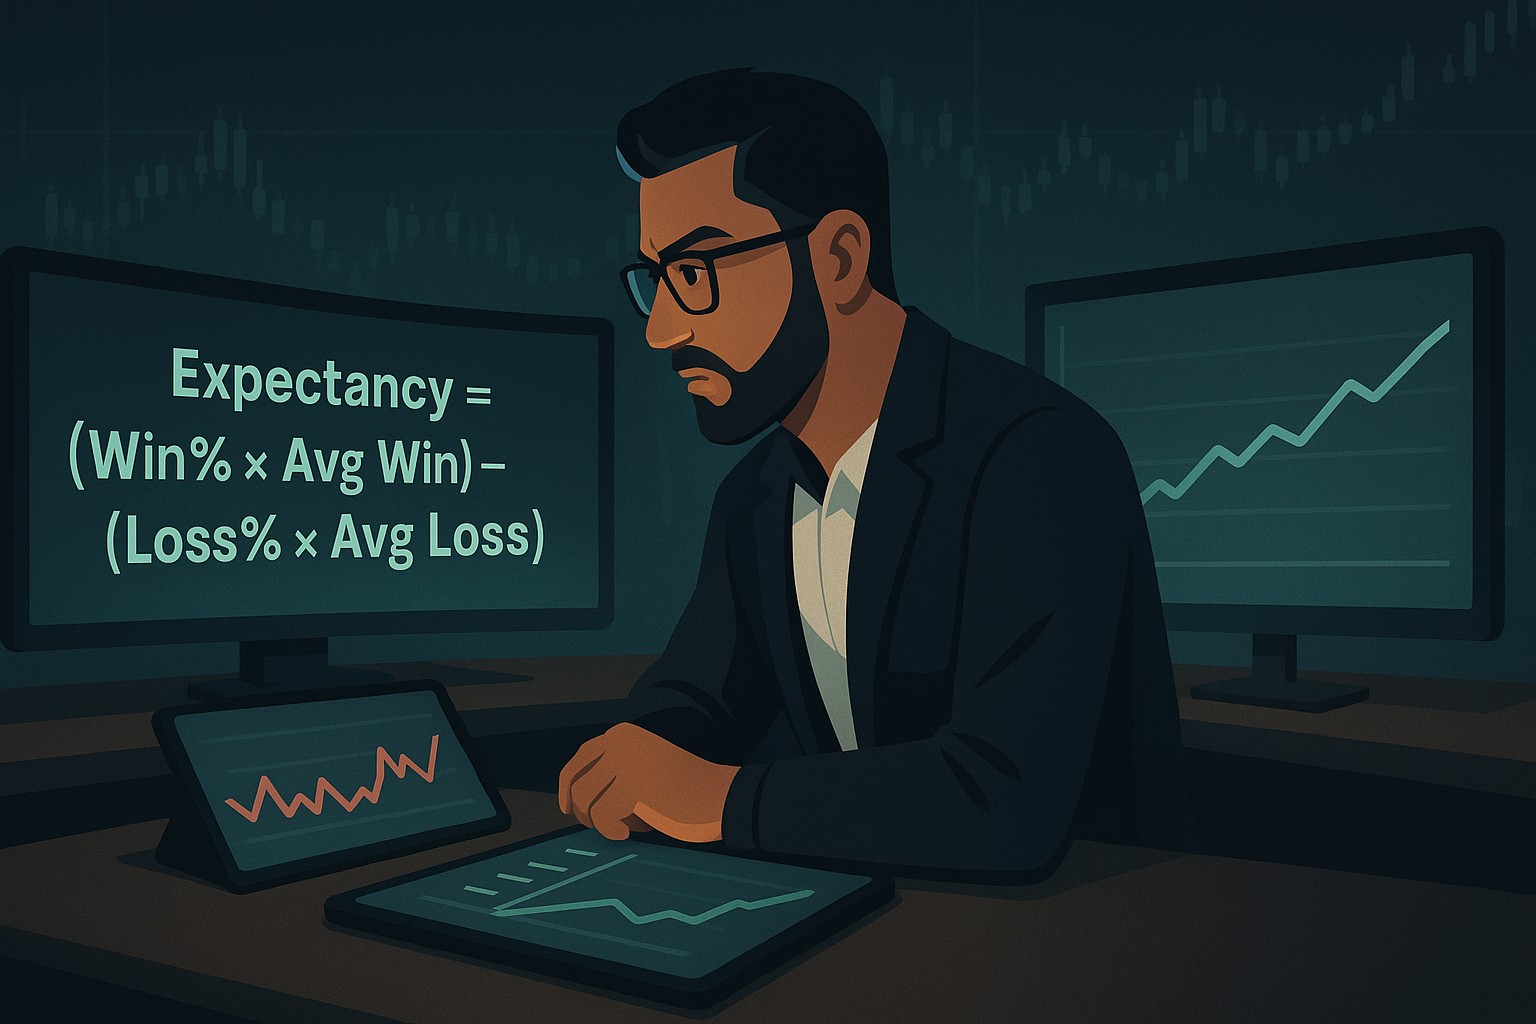
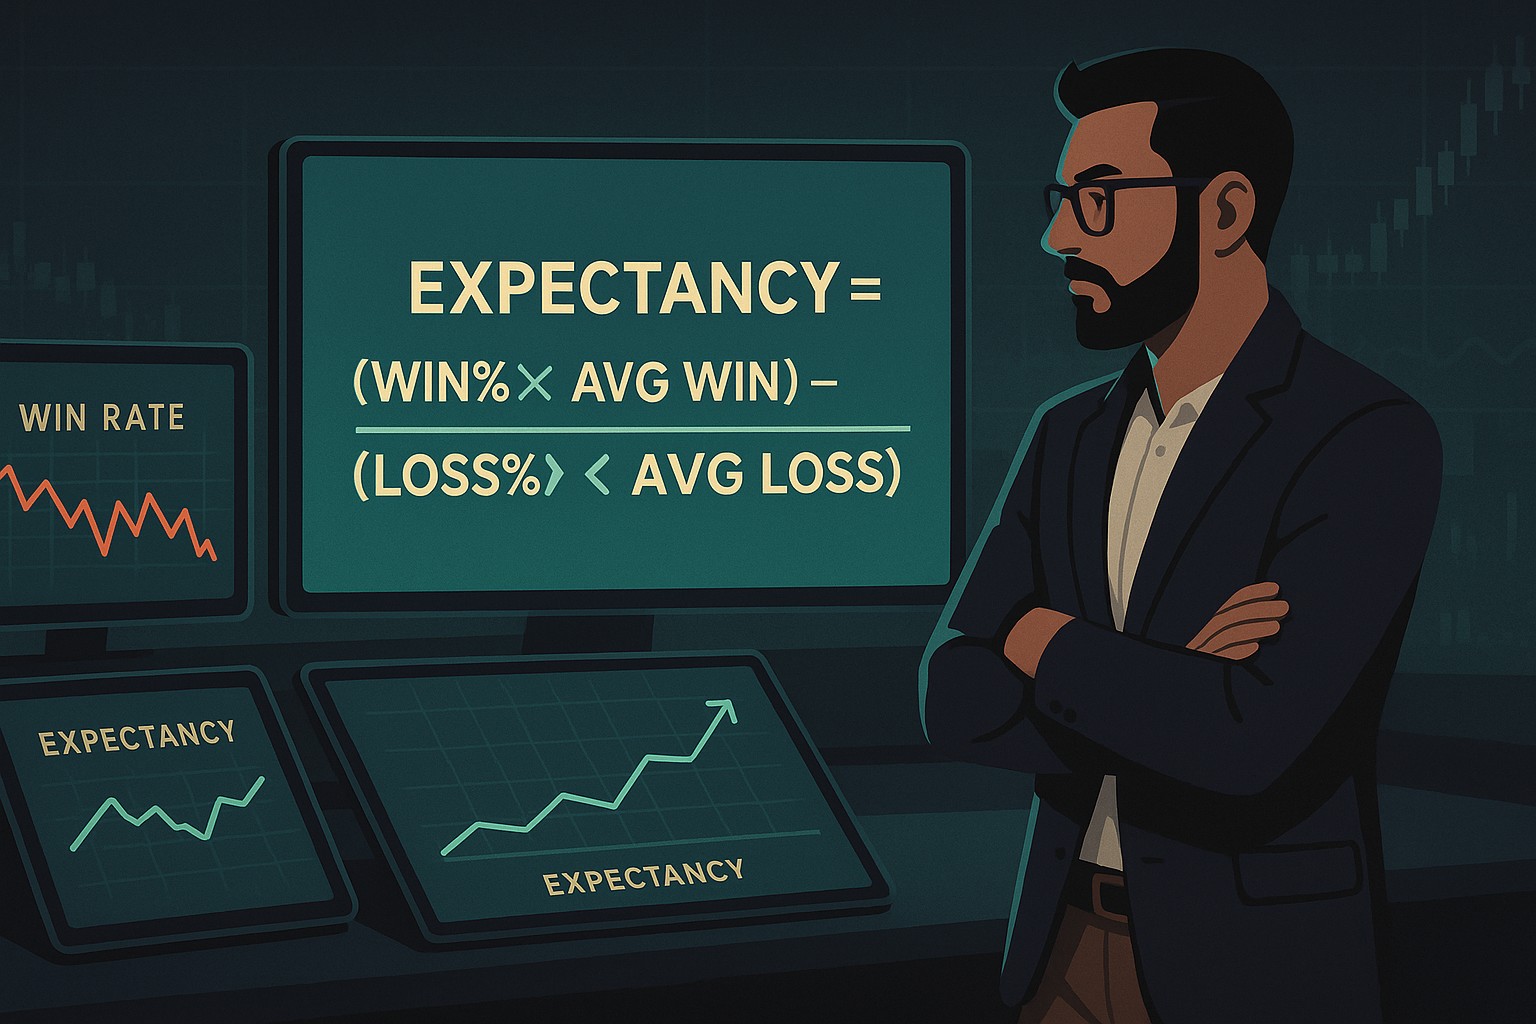
Expectancy measures how much you should make per trade over a large sample size. It is the mathematical heart of your edge.
Expectancy = (Win% × Avg Win) – (Loss% × Avg Loss)
Example:
Expectancy = (0.4 × 2.5R) – (0.6 × 1R) = +0.4R per trade
A positive expectancy means your trading system should make money over time, which is why backtesting frameworks like Proving Your Edge: Backtesting Without Bias and Measuring Your Edge: Metrics That Matter are essential.
If your Trading Journal doesn’t calculate expectancy, you’re navigating blind.
Retail traders think in dollars.
Professionals think in R.
R = the amount you risk per trade.
If you risk $100, then:
R-multiple thinking helps you detach from emotional dollar values and evaluate performance objectively.
It also pairs perfectly with price-action guides like Mastering Price Action at Key Levels, Breakout Trading Using SMC, and How to Use Fibonacci for Targets.
Your Trading Journal should be entirely measured in R - NOT in dollars.
When you do this, your emotional decision-making begins to fade.

Drawdown reveals the deepest drop in your equity curve before a new high is reached.
Most traders fear drawdown, so they avoid measuring it. But avoiding the data doesn’t prevent the damage - it simply blinds you to it.
Your Trading Journal should track:
Your worst peak-to-trough loss.
How long it takes you to recover.
How you behaved during the slump.
Did you revenge trade?
Over-risk?
Stop following your plan?
To understand the psychology behind drawdowns, revisit:
Tracking this data reveals your emotional weaknesses long before they blow your account.

Two traders can suffer the same drawdown.
But the trader who recovers faster is usually the one with:
Your Trading Journal should record:
A fast recovery rate is a hallmark of a professional trader.

Profit Factor = Gross Wins ÷ Gross Losses
If you won 12R and lost 8R this month:
Profit Factor = 12 / 8 = 1.5
Interpretation:
Profit Factor helps you evaluate system health without emotional bias - and works beautifully when paired with frameworks like The Confirmation Model: OB + FVG + Liquidity Sweep and Why Smart Money Concepts Work.

Your equity curve is the most honest visual representation of your trading psychology.
It reveals patterns instantly:
A Trading Journal without an equity curve is incomplete.
A trader who doesn’t study their curve is missing the story behind their behavior.

Imagine Trader A and Trader B both win 50% of their trades.
Same win rate.
Opposite long-term outcome.
This is why professionals track expectancy, not accuracy.
Advanced metrics separate real traders from hopeful ones.
Your win rate does not determine your profitability.
Your expectancy, drawdown behavior, R structure, and equity curve do.
Once your Trading Journal reflects these deeper metrics, your growth accelerates - because you're no longer evaluating your trading emotionally, but statistically.
This is the mindset of professionals.
This is how consistency is built.
Ideally 20–30 minimum, 50+ for robust accuracy.
Your risk is too high or your entries lack confirmation. Study Execution Psychology.
Weekly or monthly - not daily.
Yes. They reveal whether your system is healthy or needs refinement.
It’s time to go from theory to execution!
Create an Account. Start Your Live Trading Now!
Looking for step-by-step approaches you can plug straight into the charts? Start here:
Sharpen your edge with proven tools and frameworks:
News moves markets fast. Learn how to keep pace with SMC-based playbooks:
From NASDAQ opens to DAX trends, here’s how to approach indices like a pro:
Gold remains one of the most traded assets - here’s how to approach it with confidence:
Candlesticks are the building blocks of price action. Master the most powerful ones:
Ready to go intraday? Here’s how to build consistency step by step:
Markets swing between calm and chaos. Learn to read risk-on vs risk-off like a pro:
Step inside the playbook of institutional traders with SMC concepts explained:
Forex pairs aren’t created equal - some are stable, some are volatile, others tied to commodities or sessions.
If you’ve ever been stopped out right before the market reverses - this is why:
Mindset is the deciding factor between growth and blowups. Explore these essentials:
The real edge in trading isn’t strategy - it’s how you protect your capital:
If you’re not sure where to start, follow this roadmap:
This way, you’ll grow from foundation → application → mastery, instead of jumping around randomly.
Follow me for more daily market insights!
Jasper Osita - LinkedIn - FXStreet - YouTube
This content may have been written by a third party. ACY makes no representation or warranty and assumes no liability as to the accuracy or completeness of the information provided, nor any loss arising from any investment based on a recommendation, forecast or other information supplies by any third-party. This content is information only, and does not constitute financial, investment or other advice on which you can rely.
ACY Securities is one of Australia's fastest growing multi-asset online trading providers, offering ultra-low-cost trading, rock-solid execution, technologically superior account management and premium market analysis.
Select the categories and companies you wish to follow directly to your person rss feed.
Create Custom RSS FeedSign up and join over 5,000 professional members who receive personalized news alerts, curated professional connections, and more for free!
Binance has lowered its VIP 3 Wallet Assets threshold from $3 million to $1 million and will now count OTC Spot Trading Volume at a 4x multiplier toward VIP qualification, removing the previous VIP 4 cap and allowing eligible users to progress through the full tier framework up to VIP 9.
Retail futures trading leader NinjaTrader Group has appointed Mark Omens as Senior Vice President, Commercial Strategy, bringing a 25-year veteran of derivatives marketplace CME Group into a newly created role focused on exchange partnerships and enterprise growth.
Gold Price Action Forecast: Will XAU/USD Drop to $3930? Meta Description: Read our Gold price action forecast to see if XAU/USD will drop to $3930.
BitDelta Securities Financial Services LLC (“BitDelta Securities”) today announced that it has received full regulatory approval from the Capital Market Authority (“CMA”) of the United Arab Emirates under the Category 5 — Arrangement and Advice license framework (License No. 20200000439). The approval follows the firm's receipt of In-Principal Approval earlier this year and represents the successful conclusion of the CMA's full licensing process, including the satisfaction of capital requirements, governance appointments, and operational setup.
Crypto.com has received a $400 million strategic investment from Citadel Securities, valuing the firm at $20 billion. It marks the first institutional funding round in the company's history, aimed at accelerating its expansion into tokenised securities, derivatives and other asset classes.
WTI’s pullback into $79–82 is the first major test of the bullish Elliott Wave count, with buyers targeting a renewed break above $85.

BitDelta Securities has secured a full CMA Category 5 licence in the UAE and opened a regulated office in Business Bay, Dubai. The firm operates as an introducing broker, connecting investors with licensed international brokers across multiple asset classes, with CEO Dr. Demetrios Zamboglou commenting on the milestone.
Index volatility is asleep while single stocks fight it out underneath, credit refuses to confirm the equity rally, and a bare macro calendar hands next week to oil.
Digital assets and FX brokerage GC Exchange FZE (GCEX) has appointed Mohammed A. Mulla as a Board Member of its Dubai-based entity, part of the wider GCEX Group.
Learn what Blockchain-as-a-Service is, how it works, and why businesses are using BaaS to build blockchain applications without managing infrastructure.