
just now


Liquidity Finder Ltd is incorporated in England and Wales, company number 10610740, registered address 167-169 Great Portland Street, Fifth Floor, London W1W 5PF, United Kingdom.
Published: just now


The bullish breakout outlined in my previous WTI crude oil price action forecast, published on 14 October 2026, has played out.
The analysis highlighted buying interest at $87.360–$90.830 weekly support and a breakout above the $92.875–$94.765 daily resistance zone. The subsequent upward move followed the bullish direction described in that forecast.
This WTI crude oil technical analysis recap explains the weekly market structure, daily breakout and key support and resistance levels behind the move. It also distinguishes between a successful directional outlook and a confirmed trade entry.
The original upside target was $100.305. The breakout playing out supports the bullish outlook, but does not by itself establish that the target was reached.
The original analysis combined a weekly support reaction with a daily resistance breakout.
Each observation served a different purpose:
| Chart Reference | Original Observation | Why It Mattered |
| Weekly market structure | Potential higher low within a broader uptrend | Supported the possibility of bullish continuation |
| Weekly support | Strong rejection at $87.360–$90.830 | Showed buyers defending the support area |
| Weekly 50 EMA | Price trading above the moving average | Added context to the broader bullish trend |
| Pattern neckline | Rejection around an inverted head-and-shoulders neckline | Provided another technical reference near support |
| Daily resistance | Breakout above $92.875–$94.765 | Showed price clearing the previous consolidation range |
Together, these observations supported the WTI bullish continuation forecast.
The subsequent move followed that direction. However, the chart evidence behind the outlook and the conditions for entering a trade should still be assessed separately.
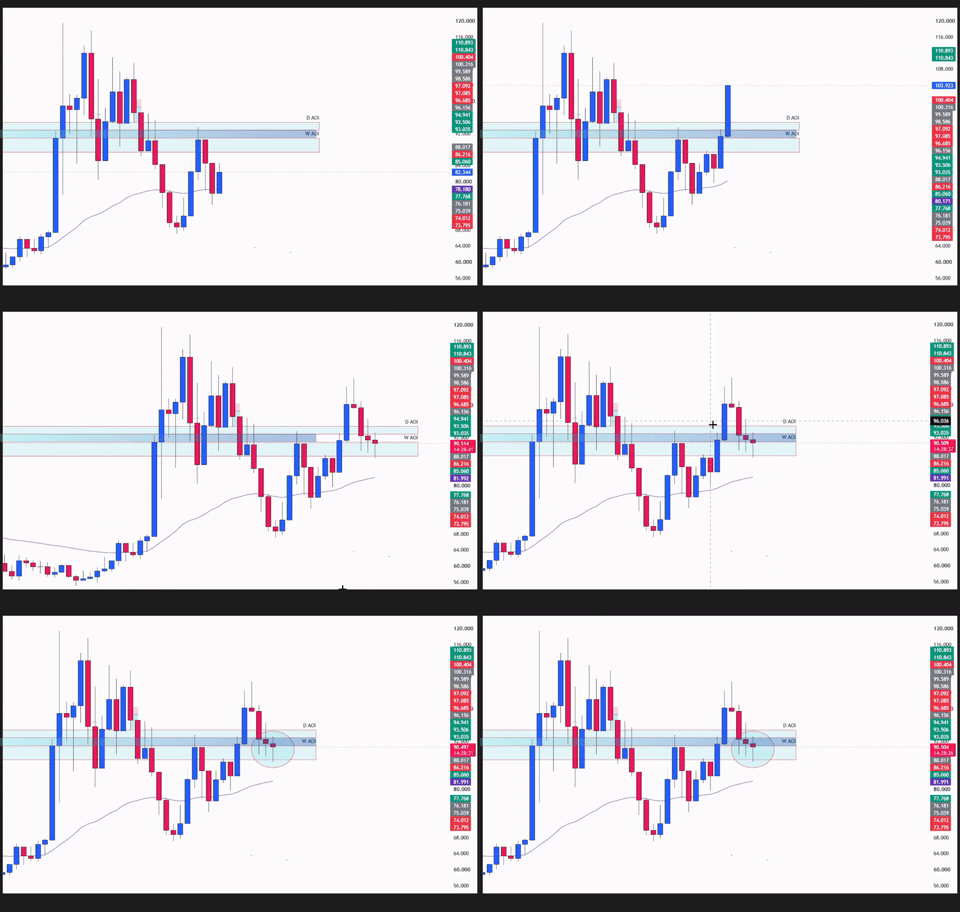
Weekly Timeframe Price Action Analysis. WTI crude oil rejects the $87.360–$90.830 support zone, supporting a potential higher low.
The weekly chart provided the foundation for the forecast.
Crude oil showed strong rejection at $87.360–$90.830, indicating that buyers were responding at an important support area.
In simple terms, price moved lower into the zone, but sellers could not maintain control. Buyers stepped in and pushed price higher.
This supported the interpretation that a potential higher low was forming within the broader uptrend.
Understanding market structure and trend direction helps explain why this mattered. A higher low can support bullish continuation when buyers defend a pullback and price subsequently advances.
Price was also trading above the weekly 50 EMA, providing additional trend context.
The support reaction established the bullish case, while the daily resistance zone defined the next barrier buyers needed to overcome.
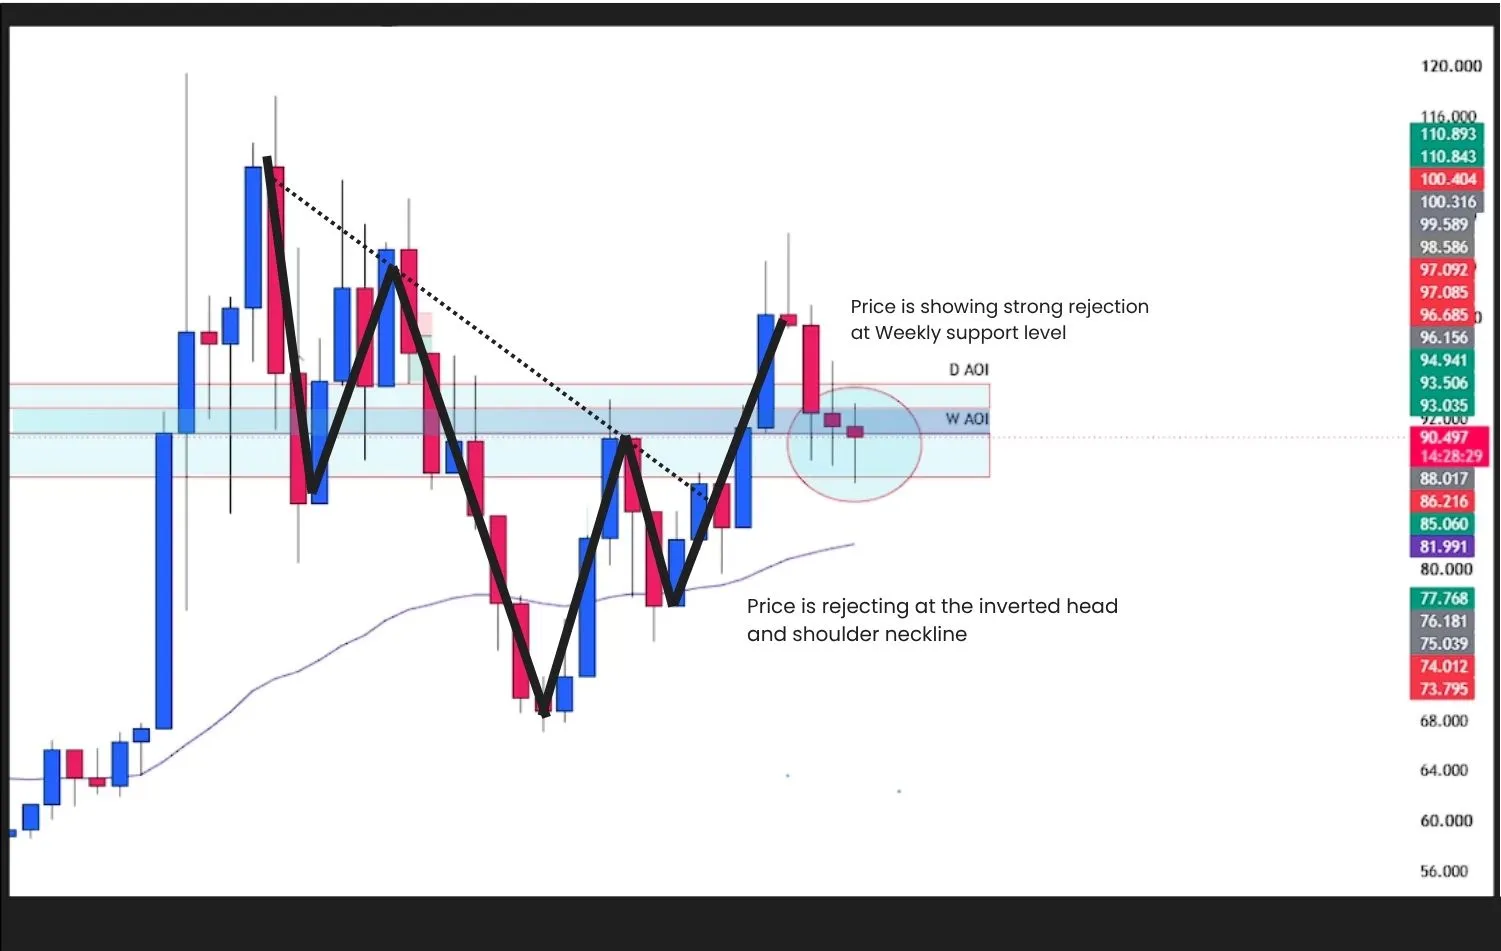
Weekly Timeframe Price Action Analysis: Price reacts around the inverted head-and-shoulders neckline near the weekly support area.
The original analysis also identified a reaction around the inverted head-and-shoulders neckline.
This provided an additional technical reference near the support area. When several chart observations point toward the same zone, traders can use that overlap to focus their analysis.
However, the neckline reaction was not a standalone guarantee of an upward move.
The forecast described a confirmation sequence involving:
These were conditions for evaluating the setup. The later bullish move does not automatically prove that every neckline confirmation condition occurred.
The $100.305 target was an upside reference identified in the forecast, not a calculated head-and-shoulders measured-move target.
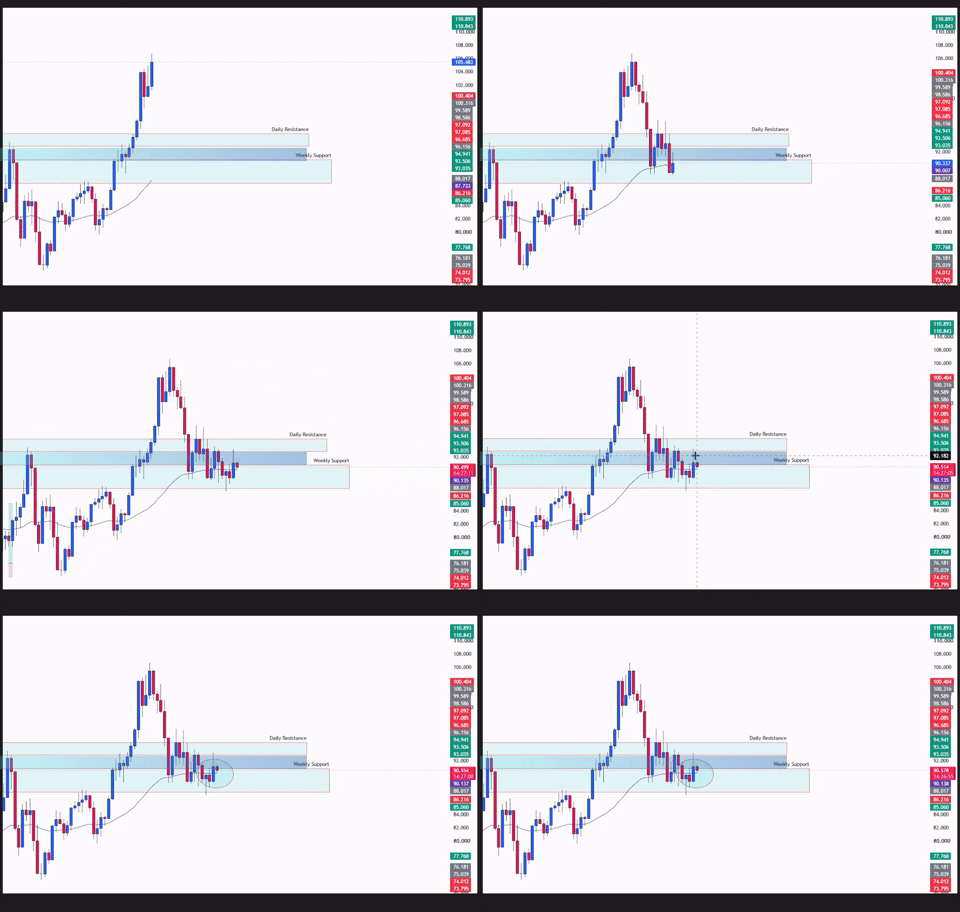
Daily Timeframe Price Action Analysis: Consolidation Below Resistance Before the Bullish Breakout
Before the breakout, the daily chart was consolidating between weekly support and daily resistance.
Price had moved above the daily 50 EMA, suggesting improving momentum. However, the earlier daily structure remained bearish, so the moving average alone was insufficient to confirm a structural reversal.
The $92.875–$94.765 resistance zone was the key barrier.
The breakout showed buyers pushing beyond the area that had previously limited advances. It strengthened the bullish outlook already supported by the weekly chart.

Daily Timeframe Price Action Analysis: Price Broke Above Consolidation
The subsequent bullish move followed the direction outlined in the forecast.
The weekly chart established the broader context. The daily breakout showed buyers overcoming resistance.
Understanding how support and resistance levels change roles also explains why the broken resistance zone became an important area to monitor during any pullback.
Price retested the $92.875–$94.765 daily resistance zone, which held as support. The strong bullish reaction showed buyers defending the level and pushing crude oil higher after the breakout.

Daily Timeframe Price Action Analysis. The Price Followed the Bullish Anticipation
The key development was that the bullish breakout scenario played out, with the upward move following the direction described in the analysis.
The forecast had connected three observations:
The subsequent move was consistent with that bullish framework.
| Forecast Reference | Level or Outcome |
| Weekly support | $87.360–$90.830 |
| Former daily resistance | $92.875–$94.765 |
| Original directional outlook | Bullish continuation |
| Reported outcome | Bullish breakout played out |
| Original upside target | $100.305 |
| Retest entry status | Requires separate confirmation from the chart |
This distinction keeps the recap focused on what the outcome demonstrates.
A successful directional forecast means price moved in the anticipated direction. It does not automatically establish an exact entry, a completed retest, or a realized trading return.
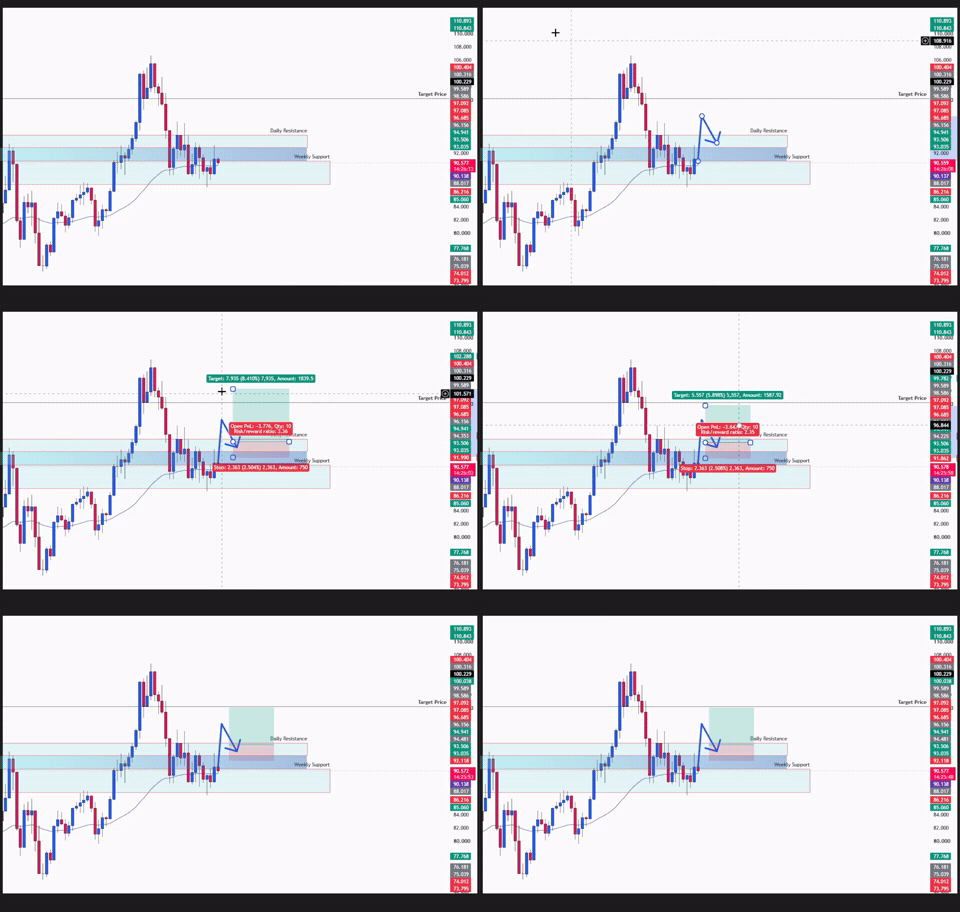
Daily Timeframe Price Action Analysis. The original bullish entry plan required buyers to defend former daily resistance as support.
The original forecast distinguished between a WTI resistance breakout and a confirmed retest opportunity.
The proposed break-and-retest setup followed this sequence:
This matters because a market can move in the forecast direction without returning to the exact entry area a trader planned.
A pullback into the zone also does not automatically qualify as confirmation. Buyers still need to show that they are defending it.
The bullish breakout playing out supports the directional outlook, while a valid entry depends on whether the planned conditions were met.
For traders following a retest strategy, the lesson is to evaluate the setup against the original rules, even when the later move looks clear in hindsight.
The original forecast used specific levels to define where the bullish case could strengthen or weaken.
| Technical LevelRole in the Original Forecast |
| $87.360–$90.830Weekly support zone where buyers showed strong rejection |
| $87.360Lower boundary of weekly support; a confirmed break would significantly weaken the bullish outlook |
| $92.875–$94.765Former daily resistance and potential support after the breakout |
| $92.875Lower boundary of the breakout zone; a daily close below would weaken the immediate setup |
| $94.765Upper resistance boundary cleared during the breakout |
| $100.305Original potential upside target |
These levels provided a framework for interpreting price behavior before the outcome was known.
They helped define the bullish opportunity and the conditions that would require reassessment.
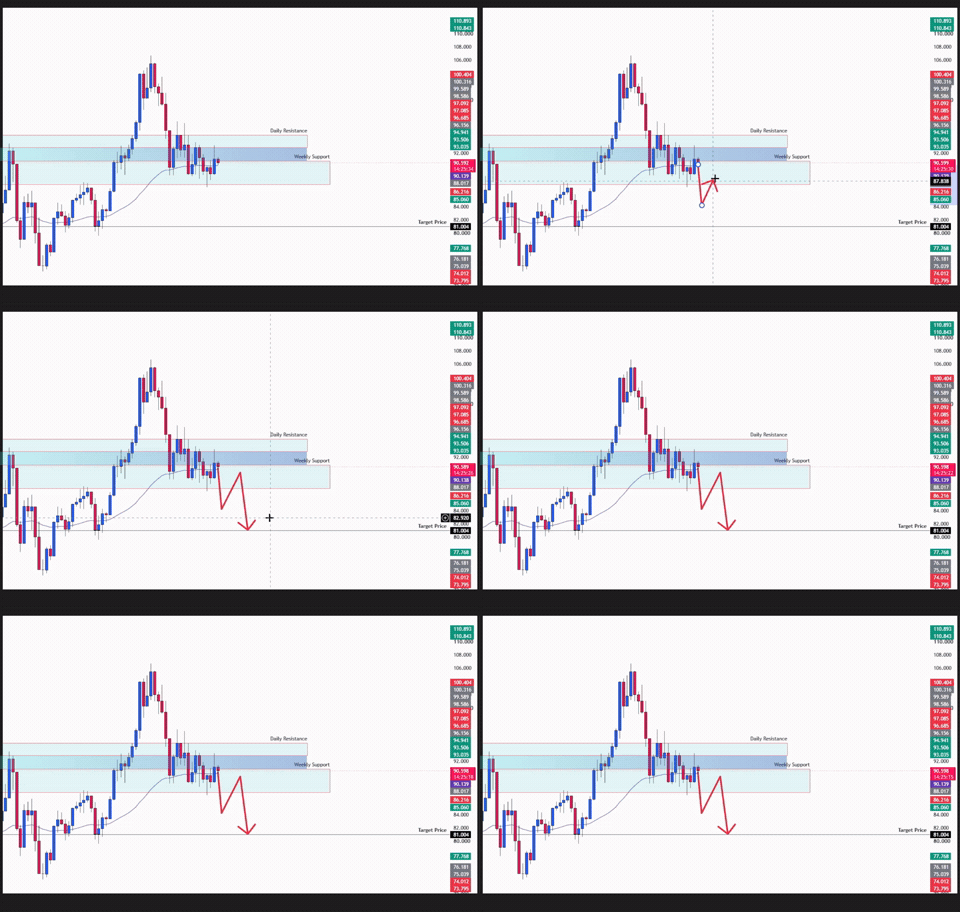
Daily Timeframe Price Action Analysis. The alternative scenario involved a failed breakout and a possible return toward weekly support.
The previous analysis also outlined a bearish alternative.
The first warning was a daily close below $92.875, followed by a failed attempt to reclaim the breakout zone.
That sequence would have suggested that buyers were struggling to sustain the move above resistance.
The failed-breakout scenario involved:
A stronger bearish case required a confirmed break below $87.360, taking price through the entire weekly support zone.
These were conditional scenarios from the forecast. Their purpose was to define when the bullish reasoning would need to change.
The bullish outcome does not make that planning unnecessary. An alternative scenario helps traders respond when price behaves differently from expectations.
The WTI bullish breakout illustrates how several chart observations can support a directional outlook.
The analysis first established the weekly context. It then identified buyers defending support and a daily breakout above resistance. Finally, it outlined entry confirmation and the conditions that would weaken the setup.
The 50 EMA provided trend context, while market structure, support and resistance, and candlestick behavior formed the main price action framework.
For traders, the repeatable process is:
The bullish breakout played out in line with the direction described in the earlier WTI crude oil price forecast. Any new forecast requires a fresh chart assessment, since the historical levels and conditions discussed here may no longer describe the current market.
Plan before the move. Wait for confirmation. Execute when the setup meets your rules.
_____________________________________________________________________________________
Move from learning price action to applying it in the real market.
Trade:
Access trading platforms and tools including ACY, MT4, MT5, and Copy Trading.
Create an Account and Start Live Trading
_____________________________________________________________________________________
Build your trading foundation with these step-by-step guides:
Learn to read price action and assess trading setups at key levels:
Learn to recognize bullish, bearish and sideways markets:
Learn to mark key levels and interpret price reactions:
Understand recurring price patterns, retests and false breakouts:
Learn to combine candlestick signals with price action analysis:
Learn to recognize patterns that may signal a change in market direction:
Explore how to combine the exponential moving average with price action:
Bring your technical analysis skills together through a gold swing trading guide:
Learn how risk management and position sizing fit into your trading plan:
Learn how to plan take-profit targets using market structure and risk-reward:
Develop discipline, emotional awareness and a more consistent trading process:
Explore the psychological habits behind a disciplined trading approach:
_____________________________________________________________________________________
Not sure where to begin? Here’s a simple roadmap to guide you:
By building step by step; from basics → real trading → mastering the craft, you’ll gain clarity, confidence, and steady progress without ever feeling overwhelmed.

_____________________________________________________________________________________
Follow Ruffy Grant B. Capacio for Gold analysis, Forex trading ideas, price action education, trading psychology, and market insights: LinkedIn
ACY Securities: Join the Discord Server
Disclaimer:
Trading Forex, Gold, CFDs, cryptocurrencies, commodities, indices, and other leveraged financial instruments involves a high degree of risk and may not be suitable for all investors or traders. Market conditions can change rapidly, and leveraged trading can result in losses that occur quickly.
Before trading, carefully consider your investment objectives, level of experience, and risk tolerance. Only trade with capital you can afford to lose and seek independent financial or professional advice where appropriate.
All market analysis, price forecasts, technical commentary, trading scenarios, educational materials, and opinions presented in this content are provided solely for general informational and educational purposes. They do not constitute financial advice, investment advice, a recommendation, solicitation, or an offer to buy or sell any financial instrument.
Past performance and historical price movements are not reliable indicators of future results. Any price levels, targets, scenarios, or market outlooks discussed should be viewed as analysis rather than guarantees of future market performance. October 19, 2026
ACY Securities is one of Australia's fastest growing multi-asset online trading providers, offering ultra-low-cost trading, rock-solid execution, technologically superior account management and premium market analysis.

Select the categories and companies you wish to follow directly to your person rss feed.
Create Custom RSS FeedSign up and join over 5,000 professional members who receive personalized news alerts, curated professional connections, and more for free!
Bitcoin holds $78,400–$82,175 support as weekly and daily rejections signal buying interest. Explore the BTCUSD outlook and potential $86,550 target.
WTI crude oil rallies to $101 after breaking above resistance. Explore the price action, key support levels and bullish signals behind the move.
Sky Links Capital has appointed Mitul Kapadia as Commercial Director, a week after naming Hormoz Faryar as Managing Director. Kapadia joins from ANAX Capital, where he was Chief Operating Officer, and has nearly two decades in asset management, desk management and revenue generation across FX and commodities.
The AI trade has always been a supply chain story. For the past two years, the narrative has been simple: insatiable demand for compute infrastructure, constrained supply at every choke point, and the companies that own the bottlenecks collect the toll. NVIDIA on GPUs. ASML on lithography. Samsung, SK Hynix, and Micron on memory. The entire semiconductor complex has traded on scarcity, and scarcity has delivered historic margins.
Interactive Brokers reported customer equity of USD 964.7 billion at the end of the third quarter, up 27% year on year, as customer accounts increased 35% to 5.58 million.
Crypto exchange BingX has secured a Markets in Crypto-Assets Regulation (MiCA) licence for its European arm from Austria's Financial Market Authority (FMA).
CXM Group has agreed to acquire TD Markets (Pty) Ltd, a Johannesburg-headquartered broker authorised by South Africa’s FSCA. TD Markets keeps its brand, team and licence, and Amar Ramith stays as CEO. Financial terms were not disclosed. The deal gives CXM a regulated base in South Africa. Clients need take no action.
Global equities under pressure: Hotter than expected US inflation and rising yields weighed on stocks, particularly technology and semiconductor shares.
Understand trading psychology and learn how a clear strategy, risk management and a trading journal help build discipline and day trading consistency.
Ripple Prime has launched support for real-world asset perpetual swaps, giving institutional clients including Virtu exposure to more than 100 reference markets across equities, indices, ETFs, metals, energy and FX. The swaps reference Trade.xyz perpetual futures on Hyperliquid and trade and settle around the clock.